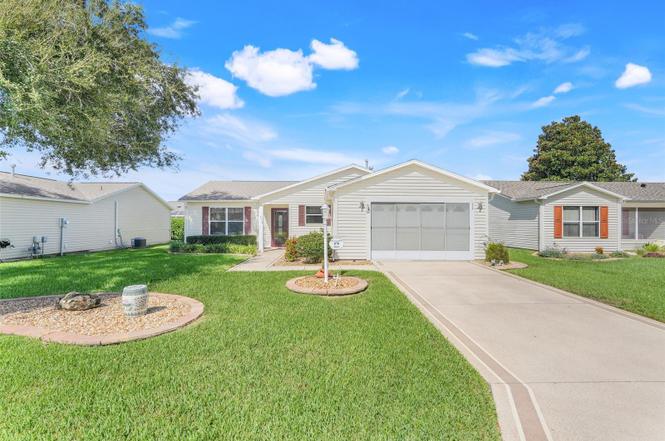
870 Henderson Ln · The Villages, FL
Flood risk 1/10 · Minimal
- FEMA flood zone
- X (unshaded)
- Chance of flooding over 30 yrs
- 0.0%
- Est. flood insurance / yr
- $507 – $1,088
Fire risk 4/10 · Minor
- Est. fire insurance / yr
- $947 – $1,759
Heat risk 8/10 · Major
- Hot days now (above 109°F)
- 6 days/yr
- Hot days in 30 yrs
- 18 days/yr
Wind risk 9/10 · Severe
- Chance of severe wind over 30 yrs
- 99.0%
Air-quality risk 3/10 · Minor
- Unhealthy air days now
- 2 days/yr
- Unhealthy air days in 30 yrs
- 3 days/yr
Risk factors via First Street. Map © Google.
Why this score? — see what drove the C- grade
The composite is a weighted blend of 9 inputs, each scored 0–100. Each bar is that input's sub-score; the figure is the points it added to the 100-point composite (weight × sub-score).
- Cash flow +17.5/30.0
- ARV discount +9.2/15.0
- DSCR +5.5/10.0
- Schools +5.2/10.0
- 1% rule +4.5/10.0
- Rent growth +3.5/5.0
- Livability +3.5/5.0
- Condition / age +2.5/5.0
- Appreciation +0.0/10.0
$319,900
🖨 Deal sheet 📄 Offer letter ✓ Due diligence
Listing remarks
Welcome to your new home. As you walk through the front door, you are immediately greeted by the warmth of this home. Up to date flooring throughout the main living area. It extends out to the additional Florida Room. This home boasts Solar Tube Lighting throughout the home. The charm of the Summerhill community welcomes you. This 3 Bedroom 2 Bathroom, along with a Florida Sunroom, has got it all. The Roof was replaced in 2020. Garage is Screened. In the garage there is space for a golf cart, and two small cars fit just fine. The extra bedroom can be used as an office, still giving you the room for a quest bedroom. Cooking is a dream with a gas stove. The Florida room is bright and sunny. T
Key facts
- Access to amenities
- Solar tube lighting
- Florida room
Tags
Property features AI
Finance
- Other: Senior community; Pets allowed (cats and dogs)
- Financial info: No lease restrictions noted; Total annual association fees listed as $2,388
- HOA & community: Community clubhouse, pool and fitness center; Golf course access and golf carts allowed; Tennis, racquetball and pickleball courts; Trails, playground, park and sidewalks; Dog park; Community mailboxes and street lights; Wheelchair access; Association fee $199 monthly (Villages); fee includes common area taxes, pool and grounds maintenance
Exterior
- Parking: Driveway; Attached oversized garage with garage door opener (1 garage space); Ground level parking
- Security: Smoke detectors
- Utilities: Public water; Public sewer; Electricity connected; Natural gas connected; Cable available and connected; High-speed internet/BB availability; Phone available; Sprinkler meter and recycled irrigation; Underground utilities
- Home design: Single family residence; One story; East-facing; Homesteaded property
- Construction: Vinyl siding; Shingle roof; Slab foundation; Built as a residential single family home
- Exterior features: Covered, enclosed and screened porches (front and rear); Screened Florida room; Exterior lighting; Rain gutters; Sidewalks; Irrigation equipment; Landscaped yard with trees; Cleared, level and paved lot
Interior
- Kitchen: Range; Range hood; Refrigerator; Freezer; Ice maker; Exhaust fan; Gas water heater
- Bedrooms: 3 bedrooms
- Flooring: Carpet; Hardwood
- Bathrooms: 2 full bathrooms
- Heating & cooling: Central heating; Electric heating; Heat pump; Natural gas available; Central air conditioning; Exhaust fan
- Interior features: Ceiling fans; Kitchen/family room combo; Formal dining; Living/dining room combo; Open floorplan; Split bedroom plan; Thermostat; Walk-in closets; Window treatments; Skylights; Drapes and shades
- Laundry & utility: Washer hookup; Dryer hookup; Electric dryer hookup; Laundry area in garage
Neighborhood map
What this means for you Summary
Snapshot
- This is a 3-bed/2.0-bath single-family listed at $320k.
Deal economics
- At list price, monthly cash flow is $246 ($3k/yr) — positive.
- The deal already cash-flows at list — no discount required.
- To meet the 1% rule (rent ≥ 1% of price), the offer needs to be $304k (4.9% below list).
- Recommended offer: $282k (12.0% below list) — sets the bar for market timing.
- Cap rate 7.2% vs local median 5.0% in The Villages — top-decile yield for the area; either an underpriced asset or a hidden risk that comps aren't pricing in. Stress-test before assuming the spread holds.
Location & tenants
- Location reads 70/100 on livability (#431 in FL) — a middle-class / working-renter tenant base. Strengths: schools A+, crime A+, housing A; Watch: amenities F, commute F, health & safety F.
- Sumter (rural): math 61% / reading 61% proficiency, ranked #11 of 73 in FL (top 15%) — acceptable for families but not a draw, mixed tenant base, ~2y average lease.
- Market conditions: Rents rising (+3.9%/yr); 550 active listings in the ZIP; 16 comparable units currently listed for rent nearby; rentals at typical pace (median 21d on market — plan ~3-4 weeks tenant-placement turnaround); 3,961 units permitted in Sumter County in 2024 (248 in 5+ unit buildings).
- At $3,044/mo this rent would consume 49% of the median local household income ($74k/yr) (locally 987% of renters already pay >50% of income on rent) — very limited rent-growth headroom before tenants either downsize or default.
Forward outlook
- Local home prices are declining (-3.0%/yr); year-one equity from $2k of loan paydown is wiped out by about $10k of value loss. Plan a longer hold.
- Sumter County population projected at +45% by 2050 — long-run rental-demand tailwind backs the buy-and-hold thesis.
Negotiation context
- It's been on market 259 days — a 12% lower offer ($282k) is reasonable based on typical stale-listing flexibility.
- Current owner paid $180k; list at $320k implies a 78% gain — meaningful room to come down on a strong offer.
Risks & watch-outs
- Climate carrying-cost: severe wind risk, 99% chance of damaging wind over 30y; extreme-heat days projected 6→18/yr by 2055 (HVAC capex compounding) — expect insurance premiums to compound above CPI over the hold.
Questions for the listing agent
- It's been on market 259 days. Have you received any prior offers? Is the seller open to a 12% concession, seller financing, or rate buy-down credit?
- What does the HOA fee cover, when was the last increase, and are there any pending special assessments or reserve-fund shortfalls?
- Why hasn't it sold? Are there any deal-killer items the seller is aware of (foundation, flood, title, zoning, code violations)?
- Is there a deadline driving the sale (1031 exchange, divorce, estate, relocation)? That informs how much negotiation room exists.
- Schools are A-rated — typically a magnet for longer-tenancy family renters. What's the average tenant stay here, and is there a school-zone premium baked into asking?
- What's the average days-on-market for RENTAL listings here right now (not sales)? A rising rental-DOM trend means longer vacancies and softer asking-rent achievability than the comps imply.
- What's the recent tenant-quality profile in this submarket — average credit score on applications, eviction rate, late-payment / NSF rate, and stable-employment percentage? A property-management company in the area should have these aggregated.
- How much new for-sale + rental construction is in the pipeline within 1–3 miles? Heavy new supply typically softens prices + rents 12–24 months out; constrained supply supports both.
Investment metrics
- 1% rule
- 0.95% ✗
- Cap rate
- 7.22%
- Cash-on-cash
- 3.30%
- DSCR
- 1.15
- GRM
- 8.8
CMA / ARV
- ARV (on-the-fly)
- $332,750
- Comps found
- 12
Show comp detail 12 sales within ~0.75 mi
| Address | Dist | Beds/Ba | Sqft | Sold | Price | $/sf | Match |
|---|---|---|---|---|---|---|---|
| 766 Artesia Ave | 0.23mi | 3/2.0 | 1,392 (+1%) | 3mo | $295,000 | $212 | 85 |
| 5162 NE 122nd Blvd | 0.26mi | 3/2.0 | 1,314 (-4%) | 2mo | $260,000 | $198 | 79 |
| 3248 Williams Rd | 0.41mi | 3/2.0 | 1,392 (+1%) | 0mo | $375,000 | $269 | 79 |
| 3562 Auburndale Ave | 0.46mi | 3/2.0 | 1,392 (+1%) | 2mo | $300,000 | $216 | 75 |
| 3437 Sipsey St | 0.18mi | 3/2.0 | 1,240 (-10%) | 4mo | $310,000 | $250 | 72 |
| 3183 Hatch Ln | 0.65mi | 3/2.0 | 1,404 (+2%) | 3mo | $379,000 | $270 | 64 |
| 3189 Atwell Ave | 0.53mi | 3/2.0 | 1,477 (+7%) | 0mo | $315,000 | $213 | 62 |
| 935 Kenova Ave | 0.30mi | 3/2.0 | 1,572 (+14%) | 0mo | $397,000 | $253 | 62 |
| 3249 Mansfield St | 0.43mi | 3/2.0 | 1,527 (+11%) | 1mo | $336,000 | $220 | 61 |
| 1253 Addison Ave | 0.74mi | 3/2.0 | 1,437 (+4%) | 2mo | $348,000 | $242 | 57 |
| 876 Radclife Berea Pl | 0.50mi | 2/2.0 (-1) | 1,228 (-11%) | 2mo | $265,000 | $216 | 52 |
| 3173 Archer Ave | 0.53mi | 2/2.0 (-1) | 1,221 (-11%) | 4mo | $450,000 | $369 | 49 |
Match score weights: distance 35% · size 25% · config 20% · recency 20%. Top-matched comps best support the ARV.
Projected returns pro-forma
-3.0% appreciation · 3.92% rent growth · sell at horizon
- IRR
- -10.1%
- Equity multiple
- 0.63×
- Total profit
- $-33,299
- Equity at exit
- $47,698
- IRR
- 0.5%
- Equity multiple
- 1.04×
- Total profit
- $3,140
- Equity at exit
- $27,659
Cash invested: $89,572 (down + closing). Projections, not guarantees.
Landlord ↔ Tenant lean methodology
- Overall (STATE)
- 87 Strongly Landlord-Friendly
- State Florida
- 87 Strongly Landlord-Friendly · R+3
- County
- — inherits STATE
- City
- — inherits STATE
ZIP-level market 32162
- Home prices YoY
- -6.9%
- Rents YoY
- 3.9%
- Active inventory
- 550
- Price-to-rent
- 8.8×
Monthly cashflow live
- Estimated rent
- $3,044 high interval (Pro) →
- Mortgage (P&I)
- −$1,678
- Tax from tax record
- −$149 /mo · $1,782/yr
- Insurance
- −$133
- HOA
- −$199
- Vacancy / Maint / Mgmt
- −$639
- Net cashflow
- $246
Break-even live
UW: 25.0% down · 7.5% · 30yr · 1.5% tax · 5.0% vac · 8.0% maint · 8.0% mgmt
Financing live
Cash to close
- Down payment
- $79,975
- Closing costs
- $9,597
- Reserves months
- —
- Total cash needed
- —
Loan-product check · same deal, 3 products live
Conventional
25% down · 7.5% · 30yr
- Down + closing
- —
- Monthly P&I
- —
- Monthly cashflow
- —
- DSCR
- —
- Eligible?
- —
Personal DTI + credit; lowest rate.
DSCR
20% down · 8.5% · 30yr
- Down + closing
- —
- Monthly P&I
- —
- Monthly cashflow
- —
- DSCR
- —
- Eligible?
- —
No personal income docs; deal must DSCR.
Hard money
10% down · 12.0% · 12mo
- Down + closing
- —
- Monthly P&I
- —
- Monthly cashflow
- —
- DSCR
- —
- Eligible?
- —
Short-term bridge; refi at stabilization.
Rent comps 16 comps
| Address | Beds | Baths | Sqft | Rent | $/sqft | DOM | Units | Dist |
|---|---|---|---|---|---|---|---|---|
| 3545 Idlewood Loop The Villages, FL | 2.0 | 2.0 | 1240 | $4,500 | $3.63 | 21d | 1 | 0.09mi |
| 3489 Cambria Cir The Villages, FL | 2.0 | 2.0 | 1188 | $1,745 | $1.47 | 21d | 1 | 0.16mi |
| 3260 Atwell Ave The Villages, FL | 3.0 | 2.0 | 1392 | $2,500 | $1.80 | 21d | 1 | 0.39mi |
| 971 Kingmont Ter The Villages, FL | 3.0 | 2.0 | 1392 | $3,400 | $2.44 | 21d | 1 | 0.40mi |
| 12020 Brush Hill Rd Oxford, FL | 1.0–3.0 | 1.0–2.0 | 947 | $2,295 | $2.42 | 21d | 15 | 0.49mi |
| 3292 Riverton Rd The Villages, FL | 2.0 | 2.0 | 1143 | $2,100 | $1.84 | 21d | 1 | 0.50mi |
| 12388 NE 48th Loop Oxford, FL | 3.0 | 2.0 | 1426 | $1,700 | $1.19 | 21d | 1 | 0.54mi |
| 3207 Woodridge Dr The Villages, FL | 2.0 | 2.0 | 1148 | $4,200 | $3.66 | 21d | 1 | 0.54mi |
| 888 Radclife Berea Pl The Villages, FL | 2.0 | 2.0 | 1288 | $4,200 | $3.26 | 21d | 1 | 0.55mi |
| 1129 Santa Cruz Dr The Villages, FL | 2.0 | 2.0 | 1102 | $2,350 | $2.13 | 21d | 1 | 1.10mi |
| 2864 Leicester Ter Unit 1525680P The Villages, FL | 2.0 | 2.0 | 1130 | $2,090 | $1.85 | 21d | 1 | 1.13mi |
| 2829 Burgos Dr The Villages, FL | 2.0 | 2.0 | 1156 | $1,850 | $1.60 | 21d | 1 | 1.17mi |
| 6367 NE 118th Ave The Villages, FL | 3.0–4.0 | 2.0–2.5 | 1645 | $1,925 | $1.17 | 21d | 10 | 1.22mi |
| 650 Richland Rd The Villages, FL | 2.0 | 2.0 | 1188 | $4,500 | $3.79 | 21d | 1 | 1.33mi |
| 2111 Thornton Ter The Villages, FL | 2.0 | 2.0 | 1156 | $4,400 | $3.81 | 21d | 1 | 1.35mi |
| 12246 N US Highway 301 Oxford, FL | 2.0–3.0 | 2.0 | 1180 | $1,875 | $1.59 | 21d | 7 | 1.38mi |
HOA detail
- Monthly dues
- $199 · $2,388/yr
- Likely covers
- gas
Listing history 18 events
-
2026-06-19days on market $319,900 Active 259 DOM
-
2026-06-18days on market $319,900 Active 258 DOM
-
2026-06-17days on market $319,900 Active 257 DOM
-
2026-06-16days on market $319,900 Active 256 DOM
-
2026-06-15days on market $319,900 Active 255 DOM
-
2026-06-14days on market $319,900 Active 253 DOM
-
2026-06-13days on market $319,900 Active 252 DOM
-
2026-06-10days on market $319,900 Active 250 DOM
-
2026-06-09days on market $319,900 Active 249 DOM
-
2026-06-08days on market $319,900 Active 248 DOM
-
2026-06-07days on market $319,900 Active 247 DOM
-
2026-06-02days on market $319,900 Active 242 DOM
-
2026-06-01days on market $319,900 Active 241 DOM
-
2026-05-31days on market $319,900 Active 240 DOM
-
2026-05-30days on market $319,900 Active 239 DOM
-
2026-02-14price $319,900
-
2025-10-03$329,900 Active
-
2008-08-04soldstatus $180,000
ⓘ Source: listings_history table (triggers on properties + properties_extension) + one-shot
backfill from property_details.listing_events for pre-trigger history.
Tax reassessment forecast FL · Resets to sale price
- Current annual tax
- $1,782 · $149/mo
- Projected year-2 tax
- $2,655 · $221/mo
- Expected delta
- +$873/yr (+$73/mo · 49.0%)
ⓘ Screening estimate from a state-policy table — verify with the county assessor before closing.
Climate risk First Street
- Flood 1/10 Low FEMA zone X (unshaded) · 0% chance over 30 yrs
- Wildfire 4/10 Moderate
- Heat 8/10 Severe 6 d/yr ≥109°F today · 18 d/yr by 30 yrs out
- Wind 9/10 Extreme 99% chance of damaging wind over 30 yrs
- Air quality 3/10 Moderate 2 unhealthy d/yr today · 3 by 30 yrs out
Nearby sold comps map
Loading sold comps map…
Walkable amenities ~0.75 mi
Loading nearby amenities…
Taxation est. · year 1
- Rental income
- $36,526
- − Mortgage interest
- −$17,919
- − Property taxes
- −$1,782
- − Insurance
- −$1,600
- − Repairs & maintenance
- −$2,922
- − Management
- −$2,922
- − HOA
- −$2,388
- − Depreciation
- −$9,306
- Taxable loss
- −$2,314
- Est. tax savings @ 24.0%
- +$555
- After-tax cash flow
- $3,510/yr
For passive investors: Depreciation is non-cash, so a rental often shows a tax loss while cash-flowing — sheltering income. Rental losses are passive: they offset passive income freely, and up to $25,000/yr can offset ordinary (W-2) income if you actively participate and your MAGI is under $100k (phasing out to $0 by $150k); unused losses carry forward. On sale, claimed depreciation is recaptured at up to 25%, and gains may owe capital-gains tax (a 1031 exchange can defer both). Figures are a year-1 estimate at your 24.0% rate — not tax advice; consult a CPA.
Schools (NCES district)
- District
- Sumter
- NCES district ID
- 1201800
- Math proficiency
- 61% ▼ -4.00%
- Reading proficiency
- 61% ▼ -2.00%
- Median HH income
- $48,240
- Composite
- 51.74/100
- National rank
- #1682
- State rank
- #11 of 73 in FL
Livability — The Villages
- Score
- 70/100
- State rank
- #431
- US rank
- #7363
Category grades
Schools grade is shown separately in the Schools card above.
Census & demographics
- Census place
- The Villages, FL
- County
- Sumter County · 110,591 people
- City population
- 83,973
- Metro
- The Villages, FL
- Population (ZIP)
- 55,424
- Household income
- $74,119
- Rent vs Own
- Severe rent burden
- 987.0
Population outlook (Sumter County) Hauer SSP2
- Today (2025)
- 161,172 people
- By 2030
- 180,083 · +11.7%
- By 2040
- 209,892 · +30.2%
- By 2050
- 234,186 · +45.3%
- By 2075
- 284,602 · +76.6%
- By 2100
- 317,039 · +96.7%
Race, ethnicity, and origin ACS 2023
- Neighborhood character
- Predominantly White (95%)
- Race & ethnicity
- White 95% Two or more races 2% Hispanic / Latino 2% Asian 1% Black 1%
- Common ancestry
- Romanian 7% Slovak 4% Lithuanian 4%
- Foreign-born
- 5% · Canada
- Languages at home
- 96% English-only · Spanish 1% Tagalog/Filipino 1%
Political lean MEDSL · Sumter
- 2024 margin
- Solid R (+37.6) · D 30.9% · R 68.6%
- 2008→2024 swing
- -10.6pp toward R · 2008: -27.0pp · 2024: -37.6pp
- All cycles
- 2024: R+37.6 2020: R+36.1 2016: R+39.2 2012: R+34.9 2008: R+27.0
Not yet ingested
- Civics
- —
Market trends
- HPI YoY
- ▼ -16.16%
- Current HPI
- 218.1956
- Rent YoY
- ▲ 3.92%
- Metro
- The Villages, FL
- State GDP YoY
- ▲ 3.28%
- F500 in state
- 36
Industry mix (Fortune 500 HQ in FL)
| Industry | F500 HQs | Revenue |
|---|---|---|
| Industrial Technology | 2 | $29B |
|
||
| Insurance | 2 | $17B |
|
||
| Retail | 1 | $60B |
|
||
| Technology Distribution | 1 | $58B |
|
||
| Homebuilding | 1 | $35B |
|
||
| Technology Manufacturing | 1 | $35B |
|
||
Price history
+77.7% since first listed3 events — show timeline
- 2026-02-14 Price Changed $319,900 Stellar MLS as Distributed by MLS Grid
- 2025-10-03 Listed $329,900 Stellar MLS as Distributed by MLS Grid
- 2008-08-04 Sold (Public Records) $180,000 Public Records
Property tax history
-1.2%/yrLatest (2025): $1,782 · +1.4% YoY. Source: county tax records.
Cash-flow waterfall
monthlySold comps — $/sqft
last 12 mo · ≤1 miLoading sold comps…