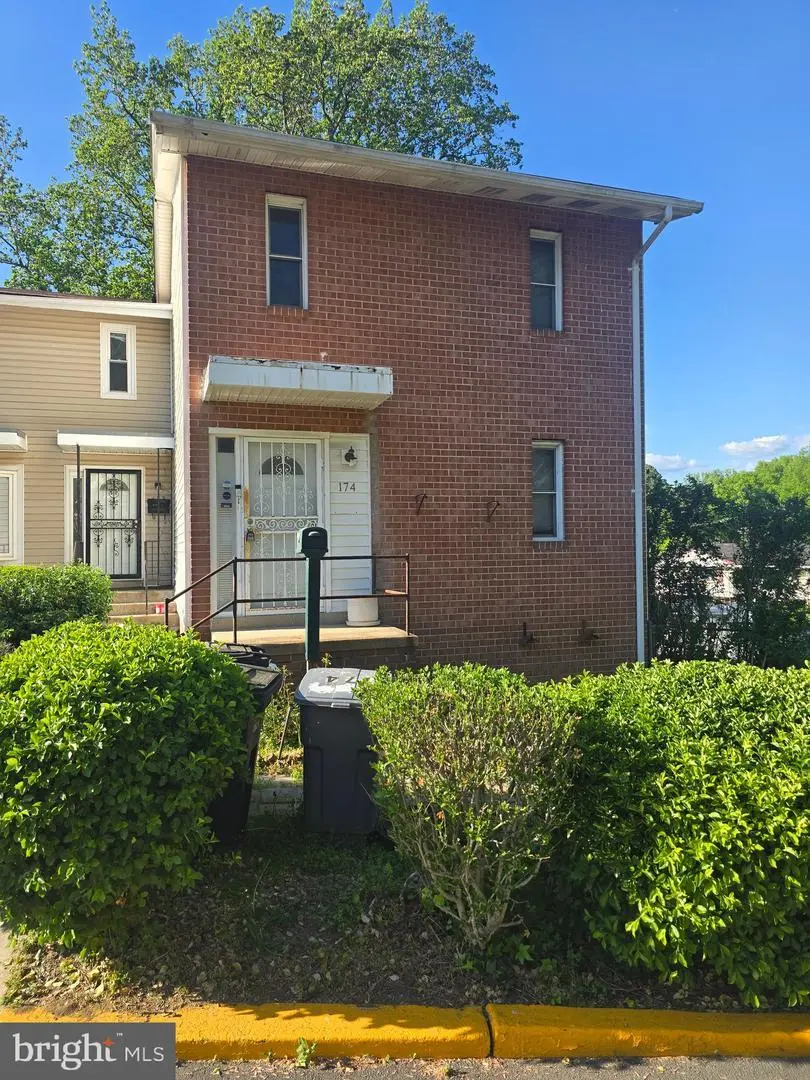
174 Daimler Dr #54 · Peppermill Village, MD
Flood risk 1/10 · Minimal
- FEMA flood zone
- X (unshaded)
- Chance of flooding over 30 yrs
- 0.0%
- Est. flood insurance / yr
- $507 – $1,088
Fire risk 2/10 · Minimal
- Est. fire insurance / yr
- $755 – $1,403
Heat risk 8/10 · Major
- Hot days now (above 102°F)
- 7 days/yr
- Hot days in 30 yrs
- 16 days/yr
Wind risk 4/10 · Minor
- Chance of severe wind over 30 yrs
- 20.0%
Air-quality risk 4/10 · Minor
- Unhealthy air days now
- 4 days/yr
- Unhealthy air days in 30 yrs
- 5 days/yr
Risk factors via First Street. Map © Google.
Why this score? — see what drove the B- grade
The composite is a weighted blend of 9 inputs, each scored 0–100. Each bar is that input's sub-score; the figure is the points it added to the 100-point composite (weight × sub-score).
- Cash flow +30.0/30.0
- 1% rule +10.0/10.0
- DSCR +10.0/10.0
- ARV discount +7.5/15.0
- Rent growth +4.0/5.0
- Livability +3.6/5.0
- Condition / age +2.5/5.0
- Schools +1.7/10.0
- Appreciation +0.0/10.0
$179,900
🖨 Deal sheet 📄 Offer letter ✓ Due diligence
Key facts
- $48 HOA
- 2 parking spots
- Built 1972
Neighborhood map
What this means for you Summary
Snapshot
- This is a 3-bed/2.0-bath townhouse listed at $180k.
Deal economics
- At list price, monthly cash flow is $800 ($10k/yr) — positive.
- The deal already cash-flows at list — no discount required.
- Meets the 1% rule at list price ($3k rent vs $180k).
Location & tenants
- Location reads 72/100 on livability (#142 in MD) — a middle-class / working-renter tenant base. Strengths: commute A+, housing A+, employment A; Watch: health & safety C-, amenities F, cost of living F.
- Prince George'S County Public Schools (suburban): math 8% / reading 24% proficiency, ranked #21 of 24 in MD (top 88%) — low school quality limits family demand, transient renter base, plan for 1-2y turnover.
- Zoned schools: Central High (math 12% / reading 37%, grade F, #163 of 222 statewide, top 75%, 877 students, 74% FRL) — zoned schools average 74% FRL vs 53% district-wide (21 pts higher); higher-poverty schools than district average — tighter screening recommended.
- Market conditions: Rents rising fast (+5.9%/yr); 217 active listings in the ZIP; 18 comparable units currently listed for rent nearby; rentals at typical pace (median 19d on market — plan ~3-4 weeks tenant-placement turnaround); solid renter incomes; 1,481 units permitted in Prince George's County in 2024 (0 in 5+ unit buildings).
- This rent runs 43% of the median local income ($76k/yr) — at the standard rent-burdened threshold; future hikes will face affordability resistance.
Forward outlook
- Local home prices are declining (-3.0%/yr); year-one equity from $1k of loan paydown is wiped out by about $5k of value loss. Plan a longer hold.
- Prince George's County population projected at +18% by 2050 — long-run rental-demand tailwind backs the buy-and-hold thesis.
- At projected returns (-3.0% appreciation + 5.9% rent growth), your $50k cash investment doubles in ~6 years — after that, you're playing with house money.
Negotiation context
- Only 3 days on market — expect competitive offers; lowballing is unlikely to land.
- Current owner paid $30k; list at $180k implies a 506% gain — meaningful room to come down on a strong offer.
Risks & watch-outs
- Climate carrying-cost: extreme-heat days projected 7→16/yr by 2055 (HVAC capex compounding) — expect insurance premiums to compound above CPI over the hold.
Questions for the listing agent
- Built in 1972 — when were the roof, HVAC, electrical panel, plumbing, and water heater last replaced?
- What does the HOA fee cover, when was the last increase, and are there any pending special assessments or reserve-fund shortfalls?
- Is there a deadline driving the sale (1031 exchange, divorce, estate, relocation)? That informs how much negotiation room exists.
- What's the average days-on-market for RENTAL listings here right now (not sales)? A rising rental-DOM trend means longer vacancies and softer asking-rent achievability than the comps imply.
- What's the recent tenant-quality profile in this submarket — average credit score on applications, eviction rate, late-payment / NSF rate, and stable-employment percentage? A property-management company in the area should have these aggregated.
- How much new for-sale + rental construction is in the pipeline within 1–3 miles? Heavy new supply typically softens prices + rents 12–24 months out; constrained supply supports both.
Investment metrics
- 1% rule
- 1.54% ✓
- Cap rate
- 11.63%
- Cash-on-cash
- 19.06%
- DSCR
- 1.85
- GRM
- 5.4
CMA / ARV
- ARV (on-the-fly)
- $401,952
- Comps found
- 12
Show comp detail 12 sales within ~0.75 mi
| Address | Dist | Beds/Ba | Sqft | Sold | Price | $/sf | Match |
|---|---|---|---|---|---|---|---|
| 58 Daimler Dr #104 | 0.11mi | 3/1.5 | 1,818 (-4%) | 0mo | $290,000 | $160 | 86 |
| 178 Daimler Dr #44 | 0.04mi | 3/2.0 | 1,896 (0%) | 15mo | $180,000 | $95 | 85 |
| 86 Daimler Dr #90 | 0.11mi | 3/2.5 | 1,896 (0%) | 18mo | $300,000 | $158 | 78 |
| 1 Thomasson Ct | 0.30mi | 3/3.0 | 1,926 (+2%) | 9mo | $465,000 | $241 | 72 |
| 8 Cindy Ln | 0.23mi | 3/2.5 | 1,730 (-9%) | 4mo | $452,000 | $261 | 69 |
| 109 Gray St | 0.26mi | 3/3.0 | 1,710 (-10%) | 3mo | $450,000 | $263 | 65 |
| 6706 Central Ave | 0.26mi | 4/2.5 (+1) | 1,680 (-11%) | 2mo | $425,000 | $253 | 60 |
| 114 Gray St | 0.29mi | 3/3.0 | 1,710 (-10%) | 14mo | $457,000 | $267 | 55 |
| 442 Shady Glen Rd | 0.59mi | 3/2.5 | 1,700 (-10%) | 8mo | $360,000 | $212 | 47 |
| 6916 Aquamarine Ct | 0.72mi | 4/2.5 (+1) | 1,942 (+2%) | 14mo | $375,000 | $193 | 44 |
| 406 Shady Glen Dr | 0.66mi | 3/3.0 | 1,700 (-10%) | 9mo | $320,000 | $188 | 41 |
| 370 Shady Glen Dr | 0.69mi | 3/3.0 | 1,700 (-10%) | 8mo | $315,000 | $185 | 40 |
Match score weights: distance 35% · size 25% · config 20% · recency 20%. Top-matched comps best support the ARV.
Projected returns pro-forma
-3.0% appreciation · 5.9% rent growth · sell at horizon
- IRR
- 14.4%
- Equity multiple
- 1.60×
- Total profit
- $30,253
- Equity at exit
- $26,824
- IRR
- 25.5%
- Equity multiple
- 3.56×
- Total profit
- $128,703
- Equity at exit
- $15,554
Cash invested: $50,372 (down + closing). Projections, not guarantees.
Landlord ↔ Tenant lean methodology
- Overall (STATE)
- 27 Tenant-Leaning
- State Maryland
- 27 Tenant-Leaning · D+14
- County
- — inherits STATE
- City
- — inherits STATE
ZIP-level market 20743
- Rents YoY
- 5.9%
- Active inventory
- 217
- Price-to-rent
- 5.4×
Monthly cashflow live
- Estimated rent
- $2,769 high interval (Pro) →
- Mortgage (P&I)
- −$943
- Tax from tax record
- −$321 /mo · $3,854/yr
- Insurance
- −$75
- HOA
- −$48
- Vacancy / Maint / Mgmt
- −$582
- Net cashflow
- $800
Break-even live
UW: 25.0% down · 7.5% · 30yr · 1.5% tax · 5.0% vac · 8.0% maint · 8.0% mgmt
Financing live
Cash to close
- Down payment
- $44,975
- Closing costs
- $5,397
- Reserves months
- —
- Total cash needed
- —
Loan-product check · same deal, 3 products live
Conventional
25% down · 7.5% · 30yr
- Down + closing
- —
- Monthly P&I
- —
- Monthly cashflow
- —
- DSCR
- —
- Eligible?
- —
Personal DTI + credit; lowest rate.
DSCR
20% down · 8.5% · 30yr
- Down + closing
- —
- Monthly P&I
- —
- Monthly cashflow
- —
- DSCR
- —
- Eligible?
- —
No personal income docs; deal must DSCR.
Hard money
10% down · 12.0% · 12mo
- Down + closing
- —
- Monthly P&I
- —
- Monthly cashflow
- —
- DSCR
- —
- Eligible?
- —
Short-term bridge; refi at stabilization.
Rent comps 18 comps
| Address | Beds | Baths | Sqft | Rent | $/sqft | DOM | Units | Dist |
|---|---|---|---|---|---|---|---|---|
| 7425 Drumlea Rd Capitol Heights, MD | 4.0 | 3.5 | 1394 | $2,500 | $1.79 | 44d | 1 | 0.48mi |
| 6221 Addison Rd Capitol Heights, MD | 3.0 | 1.5 | 1554 | $3,000 | $1.93 | 18d | 1 | 0.73mi |
| 6137 Hanlon St Capitol Heights, MD | 3.0 | 2.5 | 2280 | $3,162 | $1.39 | 5d | 1 | 0.93mi |
| 6308 Santo Pl Capitol Heights, MD | 3.0 | 2.5 | 2000 | $2,900 | $1.45 | 44d | 1 | 0.93mi |
| 6308 Santo Pl Capitol Heights, MD | 3.0 | 2.5 | 2000 | $2,900 | $1.45 | 5d | 1 | 0.93mi |
| 7290 Mahogany Dr Hyattsville, MD | 3.0 | 2.5 | 1300 | $2,400 | $1.85 | 4d | 1 | 0.93mi |
| 7727 Swan Ter Hyattsville, MD | 3.0 | 2.5 | 1700 | $2,200 | $1.29 | 17d | 1 | 1.00mi |
| 522 70th St Capitol Heights, MD | 4.0 | 1.5 | 1840 | $3,000 | $1.63 | 3d | 1 | 1.09mi |
| 522 70th St Capitol Heights, MD | 4.0 | 1.5 | 1820 | $3,000 | $1.65 | 44d | 1 | 1.09mi |
| 8100 Gibbs Way Hyattsville, MD | 1.0–3.0 | 1.0–2.5 | 1082 | $2,825 | $2.61 | 2d | 58 | 1.13mi |
| 8210 Goldstone Ct Hyattsville, MD | 4.0 | 3.5 | 1696 | $4,000 | $2.36 | 18d | 1 | 1.17mi |
| 6801 James Farmer Way Capitol Heights, MD | 3.0 | 1.5 | 1512 | $2,150 | $1.42 | 18d | 1 | 1.23mi |
| 6565 Ronald Rd Capitol Heights, MD | 3.0 | 3.5 | 1350 | $2,650 | $1.96 | 44d | 1 | 1.24mi |
| 6957 Walker Mill Rd Capitol Heights, MD | 3.0 | 2.5 | 1320 | $2,650 | $2.01 | 44d | 1 | 1.28mi |
| 6340 Southern Ave NE Washington, DC | 4.0 | 2.0 | 1248 | $4,200 | $3.37 | 24d | 1 | 1.31mi |
| 7017 Migliori Ct District Heights, MD | 3.0 | 2.5 | 1320 | $2,650 | $2.01 | 5d | 1 | 1.33mi |
| 8251 Ridgefield Blvd Landover, MD | 2.0–4.0 | 1.5–2.5 | 1182 | $2,643 | $2.24 | 1d | 54 | 1.34mi |
| 6313 Field St Capitol Heights, MD | 3.0 | 2.0 | 1700 | $2,250 | $1.32 | 18d | 1 | 1.34mi |
HOA detail
- Monthly dues
- $48 · $576/yr
Listing history 4 events
-
2026-04-26status Pending
-
2026-04-20historical
-
2026-04-17$179,900 Active
-
1973-08-01soldstatus $29,700
ⓘ Source: listings_history table (triggers on properties + properties_extension) + one-shot
backfill from property_details.listing_events for pre-trigger history.
Tax reassessment forecast MD · Partial reset (capped growth)
- Current annual tax
- $3,854 · $321/mo
- Projected year-2 tax
- $3,854 · $321/mo
- Expected delta
- $0/yr ($0/mo · 0.0%)
ⓘ Screening estimate from a state-policy table — verify with the county assessor before closing.
Climate risk First Street
- Flood 1/10 Low FEMA zone X (unshaded) · 0% chance over 30 yrs
- Wildfire 2/10 Low
- Heat 8/10 Severe 7 d/yr ≥102°F today · 16 d/yr by 30 yrs out
- Wind 4/10 Moderate 20% chance of damaging wind over 30 yrs
- Air quality 4/10 Moderate 4 unhealthy d/yr today · 5 by 30 yrs out
Nearby sold comps map
Loading sold comps map…
Walkable amenities ~0.75 mi
Loading nearby amenities…
Taxation est. · year 1
- Rental income
- $33,230
- − Mortgage interest
- −$10,077
- − Property taxes
- −$3,854
- − Insurance
- −$900
- − Repairs & maintenance
- −$2,658
- − Management
- −$2,658
- − HOA
- −$576
- − Depreciation
- −$5,233
- Taxable income
- $7,273
- Est. tax owed @ 24.0%
- −$1,746
- After-tax cash flow
- $7,856/yr
For passive investors: Depreciation is non-cash, so a rental often shows a tax loss while cash-flowing — sheltering income. Rental losses are passive: they offset passive income freely, and up to $25,000/yr can offset ordinary (W-2) income if you actively participate and your MAGI is under $100k (phasing out to $0 by $150k); unused losses carry forward. On sale, claimed depreciation is recaptured at up to 25%, and gains may owe capital-gains tax (a 1031 exchange can defer both). Figures are a year-1 estimate at your 24.0% rate — not tax advice; consult a CPA.
Schools (NCES district)
- District
- Prince George'S County Public Schools
- NCES district ID
- 2400510
- Math proficiency
- 8% ▼ -11.00%
- Reading proficiency
- 24% ▼ -9.00%
- Median HH income
- $73,967
- Composite
- 16.82/100
- National rank
- #9151
- State rank
- #21 of 24 in MD
Livability — Peppermill Village
- Score
- 72/100
- State rank
- #142
- US rank
- #6113
Category grades
Schools grade is shown separately in the Schools card above.
Census & demographics
- Census place
- Peppermill Village, MD
- County
- Prince Georges County · 919,866 people
- Metro
- Washington-Arlington-Alexandria, DC-VA-MD-WV
- Population (ZIP)
- 41,093
- Household income
- $76,466
- Rent vs Own
- Severe rent burden
- 1418.0
Population outlook (Prince George's County) Hauer SSP2
- Today (2025)
- 1,005,426 people
- By 2030
- 1,048,416 · +4.3%
- By 2040
- 1,123,425 · +11.7%
- By 2050
- 1,183,220 · +17.7%
- By 2075
- 1,306,202 · +29.9%
- By 2100
- 1,408,179 · +40.1%
Race, ethnicity, and origin ACS 2023
- Neighborhood character
- Predominantly Black (78%)
- Race & ethnicity
- Black 78% Hispanic / Latino 16% Two or more races 4% White 3% Asian 1%
- Hispanic origin (detail)
- Mexican 2% Puerto Rican 2%
- Foreign-born
- 16% · Canada
- Languages at home
- 81% English-only · Spanish 13% French/Haitian/Cajun 1%
Political lean MEDSL · Prince George's
- 2024 margin
- Solid D (+75.2) · D 86.3% · R 11.2% · Other 2.5%
- 2008→2024 swing
- -3.3pp toward R · 2008: 78.5pp · 2024: 75.2pp
- All cycles
- 2024: D+75.2 2020: D+80.5 2016: D+81.0 2012: D+80.9 2008: D+78.5
Not yet ingested
- Civics
- —
Market trends
- HPI YoY
- ▼ -311.97%
- Current HPI
- 335.5152
- Rent YoY
- ▲ 5.90%
- Metro
- Washington-Arlington-Alexandria, DC-VA-MD-WV
- State GDP YoY
- ▲ 2.97%
- F500 in state
- 12
Industry mix (Fortune 500 HQ in MD)
| Industry | F500 HQs | Revenue |
|---|---|---|
| Aerospace / Defense | 1 | $71B |
|
||
| Utilities | 1 | $25B |
|
||
| Hotels | 1 | $24B |
|
||
| Consumer Goods | 1 | $7B |
|
||
| Real Estate | 1 | $6B |
|
||
| Chemicals | 1 | $2B |
|
||
Price history
+505.7% since first listed4 events — show timeline
- 2026-04-26 Pending — BRIGHT MLS
- 2026-04-20 Listing Removed — BRIGHT MLS
- 2026-04-17 Listed $179,900 BRIGHT MLS
- 1973-08-01 Sold (Public Records) $29,700 Public Records
Property tax history
+8.4%/yrLatest (2025): $3,854 · +3.6% YoY. Source: county tax records.
Cash-flow waterfall
monthlySold comps — $/sqft
last 12 mo · ≤1 miLoading sold comps…