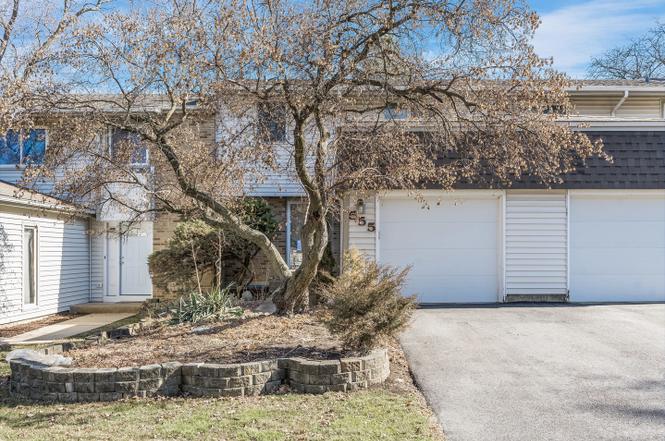
555 Monroe Rd · Bolingbrook, IL
Flood risk 1/10 · Minimal
- FEMA flood zone
- X (unshaded)
- Chance of flooding over 30 yrs
- 0.0%
- Est. flood insurance / yr
- $473 – $860
Fire risk 3/10 · Minor
- Est. fire insurance / yr
- $804 – $1,492
Heat risk 3/10 · Minor
- Hot days now (above 103°F)
- 7 days/yr
- Hot days in 30 yrs
- 15 days/yr
Wind risk 2/10 · Minimal
- Chance of severe wind over 30 yrs
- —
Air-quality risk 4/10 · Minor
- Unhealthy air days now
- 4 days/yr
- Unhealthy air days in 30 yrs
- 6 days/yr
Risk factors via First Street. Map © Google.
Why this score? — see what drove the C- grade
The composite is a weighted blend of 9 inputs, each scored 0–100. Each bar is that input's sub-score; the figure is the points it added to the 100-point composite (weight × sub-score).
- Cash flow +17.5/30.0
- 1% rule +7.8/10.0
- ARV discount +7.5/15.0
- DSCR +5.5/10.0
- Livability +3.8/5.0
- Rent growth +3.5/5.0
- Condition / age +2.5/5.0
- Schools +2.3/10.0
- Appreciation +0.0/10.0
$203,000
🖨 Deal sheet 📄 Offer letter ✓ Due diligence
Listing remarks MLS
There are no remarks available.
Key facts
- Attached garage
- Private bath
- Eat in kitchen
Tags
Neighborhood map
What this means for you Summary
Snapshot
- This is a 3-bed/2.5-bath other listed at $203k.
Deal economics
- At list price, monthly cash flow is $156 ($2k/yr) — positive.
- The deal already cash-flows at list — no discount required.
- Meets the 1% rule at list price ($3k rent vs $203k).
- Cap rate 7.2% vs local median 4.8% in Bolingbrook — top-decile yield for the area; either an underpriced asset or a hidden risk that comps aren't pricing in. Stress-test before assuming the spread holds.
Location & tenants
- Location reads 76/100 on livability (#199 in IL, #3,692 nationally) — a middle-class / working-renter tenant base. Strengths: employment A+, housing A+, crime A; Watch: amenities F, health & safety F.
- Valley View CUSD 365U (suburban): math 21% / reading 28% proficiency, ranked #289 of 620 in IL (top 47%) — low school quality limits family demand, transient renter base, plan for 1-2y turnover.
- Zoned schools: Wood View Elem School (math 8% / reading 12%, grade F, #1,517 of 2,056 statewide, top 78%, 450 students, 0% FRL); Brooks Middle School (math 27% / reading 40%, grade F, #214 of 665 statewide, top 32%, 933 students, 0% FRL); Bolingbrook High School (math 23% / reading 29%, grade F, #244 of 693 statewide, top 35%, 3,405 students, 0% FRL) — zoned schools average 0% FRL vs 51% district-wide (51 pts lower); this property's tenant base skews higher-income than the district average.
- Market conditions: Rents rising fast (+4.1%/yr); 68 active listings in the ZIP; 10 comparable units currently listed for rent nearby; rentals at typical pace (median 21d on market — plan ~3-4 weeks tenant-placement turnaround); solid renter incomes; 2,028 units permitted in Will County in 2024 (530 in 5+ unit buildings).
- This rent runs 33% of the median local income ($93k/yr) — at the standard rent-burdened threshold; future hikes will face affordability resistance.
Forward outlook
- Local home prices are declining (-3.0%/yr); year-one equity from $1k of loan paydown is wiped out by about $6k of value loss. Plan a longer hold.
- Will County population projected to shrink 4% by 2050 — rents likely to lag national; underwrite the cash flow, not the appreciation.
Negotiation context
- Only 10 days on market — expect competitive offers; lowballing is unlikely to land.
- 4 sale attempts since 17y ago with the ask held roughly flat each time — persistent listings suggest the price (not the market) is what's stuck; bring a comps-based counter.
- Current owner paid $166k; 22% above their basis — modest negotiation headroom, anchor on the comps not their cost.
Risks & watch-outs
- Watch-outs: property tax is 3.1% of price.
Questions for the listing agent
- Built in 1972 — when were the roof, HVAC, electrical panel, plumbing, and water heater last replaced?
- Property tax is high relative to price — has the assessment been appealed recently, and will the sale trigger a re-assessment?
- What does the HOA fee cover, when was the last increase, and are there any pending special assessments or reserve-fund shortfalls?
- Is there a deadline driving the sale (1031 exchange, divorce, estate, relocation)? That informs how much negotiation room exists.
- Schools are D-rated, which usually means shorter tenancies and higher turnover. Who's the typical renter profile here, and what's been the actual vacancy rate?
- What's the average days-on-market for RENTAL listings here right now (not sales)? A rising rental-DOM trend means longer vacancies and softer asking-rent achievability than the comps imply.
- What's the recent tenant-quality profile in this submarket — average credit score on applications, eviction rate, late-payment / NSF rate, and stable-employment percentage? A property-management company in the area should have these aggregated.
- How much new for-sale + rental construction is in the pipeline within 1–3 miles? Heavy new supply typically softens prices + rents 12–24 months out; constrained supply supports both.
Investment metrics
- 1% rule
- 1.28% ✓
- Cap rate
- 7.22%
- Cash-on-cash
- 3.30%
- DSCR
- 1.15
- GRM
- 6.5
CMA / ARV
No comps found within radius.
Projected returns pro-forma
-3.0% appreciation · 4.1% rent growth · sell at horizon
- IRR
- -9.3%
- Equity multiple
- 0.65×
- Total profit
- $-19,675
- Equity at exit
- $30,268
- IRR
- 2.2%
- Equity multiple
- 1.16×
- Total profit
- $9,341
- Equity at exit
- $17,552
Cash invested: $56,840 (down + closing). Projections, not guarantees.
Landlord ↔ Tenant lean methodology
- Overall (STATE)
- 43 Moderately Tenant-Leaning
- State Illinois
- 43 Moderately Tenant-Leaning · D+7
- County
- — inherits STATE
- City
- — inherits STATE
ZIP-level market 60440
- Rents YoY
- 4.1%
- Active inventory
- 68
- Price-to-rent
- 6.5×
Monthly cashflow live
- Estimated rent
- $2,608 high interval (Pro) →
- Mortgage (P&I)
- −$1,065
- Tax from tax record
- −$518 /mo · $6,214/yr
- Insurance
- −$85
- HOA
- −$237
- Vacancy / Maint / Mgmt
- −$548
- Net cashflow
- $156
Break-even live
UW: 25.0% down · 7.5% · 30yr · 1.5% tax · 5.0% vac · 8.0% maint · 8.0% mgmt
Financing live
Cash to close
- Down payment
- $50,750
- Closing costs
- $6,090
- Reserves months
- —
- Total cash needed
- —
Loan-product check · same deal, 3 products live
Conventional
25% down · 7.5% · 30yr
- Down + closing
- —
- Monthly P&I
- —
- Monthly cashflow
- —
- DSCR
- —
- Eligible?
- —
Personal DTI + credit; lowest rate.
DSCR
20% down · 8.5% · 30yr
- Down + closing
- —
- Monthly P&I
- —
- Monthly cashflow
- —
- DSCR
- —
- Eligible?
- —
No personal income docs; deal must DSCR.
Hard money
10% down · 12.0% · 12mo
- Down + closing
- —
- Monthly P&I
- —
- Monthly cashflow
- —
- DSCR
- —
- Eligible?
- —
Short-term bridge; refi at stabilization.
Rent comps 10 comps
| Address | Beds | Baths | Sqft | Rent | $/sqft | DOM | Units | Dist |
|---|---|---|---|---|---|---|---|---|
| 228 Monroe Rd Bolingbrook, IL | 3.0 | 1.5 | 1180 | $2,600 | $2.20 | 43d | 1 | 0.04mi |
| 513 Monroe Rd Bolingbrook, IL | 2.0 | 2.5 | 1200 | $2,495 | $2.08 | 24d | 1 | 0.10mi |
| 239 Malibu Dr Bolingbrook, IL | 3.0 | 1.5 | 975 | $2,550 | $2.62 | 19d | 1 | 0.74mi |
| 601 Preston Dr Bolingbrook, IL | 3.0 | 1.0–2.0 | 980 | $2,250 | $2.30 | 7d | 1 | 0.78mi |
| 131 Enclave Cir Unit C Bolingbrook, IL | 2.0 | 1.5 | 1498 | $2,499 | $1.67 | 20d | 1 | 1.15mi |
| 3420 Joann Ln Woodridge, IL | 1.0–2.0 | 1.0 | 775 | $2,085 | $2.69 | 1d | 15 | 1.16mi |
| 401 Janes Ave Bolingbrook, IL | 2.0 | 1.0–2.0 | 826 | $2,740 | $3.32 | 1d | 17 | 1.27mi |
| 668 Niagara Dr Bolingbrook, IL | 3.0 | 2.5 | 1402 | $2,695 | $1.92 | 43d | 1 | 1.27mi |
| 2709 Northcreek Dr #2102 Woodridge, IL | 2.0 | 1.5 | 963 | $1,850 | $1.92 | 12d | 1 | 1.34mi |
| 3514 83rd St Woodridge, IL | 3.0 | 3.0 | 1300 | $2,486 | $1.91 | 24d | 1 | 1.42mi |
HOA detail
- Monthly dues
- $237 · $2,844/yr
Listing history 21 events
-
2026-03-16status Pending
-
2026-03-05$203,000 Active
-
2023-06-27historical Contingent - No Showings
-
2023-06-27historical
-
2023-06-20Active
-
2019-12-26soldstatus $166,000
-
2019-12-10soldstatus $166,000 Closed Sale 31-char remark
Show marketing remark (31 chars)
There are no remarks available.
-
2019-09-25historical Contingent 31-char remark
Show marketing remark (31 chars)
There are no remarks available.
-
2019-09-24historical 31-char remark
Show marketing remark (31 chars)
There are no remarks available.
-
2019-09-03$162,800 New 31-char remark
Show marketing remark (31 chars)
There are no remarks available.
-
2009-10-06soldstatus $145,000
-
2009-09-03soldstatus $145,000 Closed Sale
-
2009-07-12historical Contingent
-
2009-07-02price $165,000 Price Change
-
2009-06-24price $174,945
-
2009-05-08price $174,950
-
2009-04-17$184,900
-
1999-10-22soldstatus $92,000
-
1990-04-04soldstatus $72,000
-
1987-05-01soldstatus $52,500
-
1985-08-01soldstatus $44,900
ⓘ Source: listings_history table (triggers on properties + properties_extension) + one-shot
backfill from property_details.listing_events for pre-trigger history.
Tax reassessment forecast IL · Partial reset (capped growth)
- Current annual tax
- $6,214 · $518/mo
- Projected year-2 tax
- $6,214 · $518/mo
- Expected delta
- $0/yr ($0/mo · 0.0%)
ⓘ Screening estimate from a state-policy table — verify with the county assessor before closing.
Climate risk First Street
- Flood 1/10 Low FEMA zone X (unshaded) · 0% chance over 30 yrs
- Wildfire 3/10 Moderate
- Heat 3/10 Moderate 7 d/yr ≥103°F today · 15 d/yr by 30 yrs out
- Wind 2/10 Low
- Air quality 4/10 Moderate 4 unhealthy d/yr today · 6 by 30 yrs out
Nearby sold comps map
Loading sold comps map…
Walkable amenities ~0.75 mi
Loading nearby amenities…
Taxation est. · year 1
- Rental income
- $31,296
- − Mortgage interest
- −$11,371
- − Property taxes
- −$6,214
- − Insurance
- −$1,015
- − Repairs & maintenance
- −$2,504
- − Management
- −$2,504
- − HOA
- −$2,844
- − Depreciation
- −$5,905
- Taxable loss
- −$1,062
- Est. tax savings @ 24.0%
- +$255
- After-tax cash flow
- $2,130/yr
For passive investors: Depreciation is non-cash, so a rental often shows a tax loss while cash-flowing — sheltering income. Rental losses are passive: they offset passive income freely, and up to $25,000/yr can offset ordinary (W-2) income if you actively participate and your MAGI is under $100k (phasing out to $0 by $150k); unused losses carry forward. On sale, claimed depreciation is recaptured at up to 25%, and gains may owe capital-gains tax (a 1031 exchange can defer both). Figures are a year-1 estimate at your 24.0% rate — not tax advice; consult a CPA.
Schools (NCES district)
- District
- Valley View CUSD 365U
- NCES district ID
- 1740070
- Math proficiency
- 21% ▼ -15.00%
- Reading proficiency
- 28% ▼ -10.00%
- Median HH income
- $69,424
- Composite
- 23.48/100
- National rank
- #7875
- State rank
- #289 of 620 in IL
Livability — Bolingbrook
- Score
- 76/100
- State rank
- #199
- US rank
- #3692
Category grades
Schools grade is shown separately in the Schools card above.
Census & demographics
- Census place
- Bolingbrook, IL
- County
- Will County · 412,448 people
- City population
- 74,096
- Metro
- Chicago-Naperville-Elgin, IL-IN-WI
- Population (ZIP)
- 51,940
- Household income
- $93,494
- Rent vs Own
- Severe rent burden
- 1149.0
Population outlook (Will County) Hauer SSP2
- Today (2025)
- 705,368 people
- By 2030
- 708,154 · +0.4%
- By 2040
- 702,692 · -0.4%
- By 2050
- 680,249 · -3.6%
- By 2075
- 611,990 · -13.2%
- By 2100
- 516,215 · -26.8%
Race, ethnicity, and origin ACS 2023
- Neighborhood character
- Highly diverse neighborhood (Simpson 0.72)
- Race & ethnicity
- White 36% Hispanic / Latino 33% Black 19% Two or more races 15% Asian 10%
- Hispanic origin (detail)
- Mexican 30%
- Common ancestry
- Romanian 7% Lithuanian 1% Italian 1%
- Foreign-born
- 23% · Canada, China, South Korea
- Languages at home
- 62% English-only · Spanish 26% Other Indo-European 5% Tagalog/Filipino 2%
Political lean MEDSL · Will
- 2024 margin
- Toss-up / Even · D 50.1% · R 48.5% · Other 1.4%
- 2008→2024 swing
- -11.6pp toward R · 2008: 13.2pp · 2024: 1.6pp
- All cycles
- 2024: D+1.6 2020: D+8.3 2016: D+5.7 2012: D+3.7 2008: D+13.2
Not yet ingested
- Civics
- —
Market trends
- HPI YoY
- ▼ -256.14%
- Current HPI
- 246.1906
- Rent YoY
- ▲ 4.10%
- Metro
- Chicago-Naperville-Elgin, IL-IN-WI
- State GDP YoY
- ▲ 1.59%
- F500 in state
- 60
Industry mix (Fortune 500 HQ in IL)
| Industry | F500 HQs | Revenue |
|---|---|---|
| Insurance | 4 | $201B |
|
||
| Consumer Goods | 4 | $87B |
|
||
| Industrial Machinery | 3 | $64B |
|
||
| Healthcare | 2 | $55B |
|
||
| Retail / Pharmacy | 1 | $148B |
|
||
| Agriculture / Food | 1 | $86B |
|
||
Price history
+352.1% since first listed21 events — show timeline
- 2026-03-16 Pending — MRED as Distributed by MLS Grid
- 2026-03-05 Listed $203,000 MRED as Distributed by MLS Grid
- 2023-06-27 Contingent — MRED as Distributed by MLS Grid
- 2023-06-27 Listing Removed — MRED as Distributed by MLS Grid
- 2023-06-20 Listed — MRED as Distributed by MLS Grid
- 2019-12-26 Sold (Public Records) $166,000 Public Records
- 2019-12-10 Sold (MLS) $166,000 MRED as Distributed by MLS Grid
- 2019-09-25 Contingent — MRED as Distributed by MLS Grid
- 2019-09-24 Listing Removed — MRED as Distributed by MLS Grid
- 2019-09-03 Listed $162,800 MRED as Distributed by MLS Grid
- 2009-10-06 Sold (Public Records) $145,000 Public Records
- 2009-09-03 Sold (MLS) $145,000 MRED as Distributed by MLS Grid
- 2009-07-12 Contingent — MRED as Distributed by MLS Grid
- 2009-07-02 Price Changed $165,000 MRED as Distributed by MLS Grid
- 2009-06-24 Price Changed $174,945 MRED as Distributed by MLS Grid
- 2009-05-08 Price Changed $174,950 MRED as Distributed by MLS Grid
- 2009-04-17 Listed $184,900 MRED as Distributed by MLS Grid
- 1999-10-22 Sold (Public Records) $92,000 Public Records
- 1990-04-04 Sold (Public Records) $72,000 Public Records
- 1987-05-01 Sold (Public Records) $52,500 Public Records
- 1985-08-01 Sold (Public Records) $44,900 Public Records
Property tax history
+3.7%/yrLatest (2024): $6,214 · +7.2% YoY. Source: county tax records.
Cash-flow waterfall
monthlySold comps — $/sqft
last 12 mo · ≤1 miLoading sold comps…