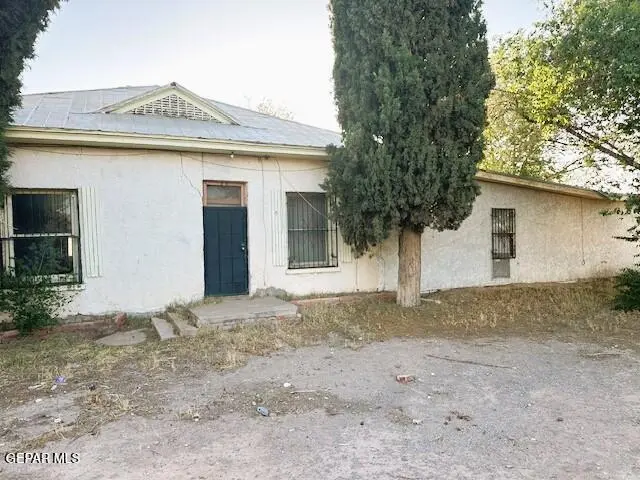
250 Trotter Ct · Canutillo, TX
Flood risk 1/10 · Minimal
- FEMA flood zone
- X (shaded)
- Chance of flooding over 30 yrs
- 0.0%
- Est. flood insurance / yr
- $507 – $1,088
Fire risk 5/10 · Moderate
- Est. fire insurance / yr
- $706 – $1,312
Heat risk 6/10 · Moderate
- Hot days now (above 101°F)
- 7 days/yr
- Hot days in 30 yrs
- 26 days/yr
Wind risk 1/10 · Minimal
- Chance of severe wind over 30 yrs
- —
Air-quality risk 2/10 · Minimal
- Unhealthy air days now
- 1 days/yr
- Unhealthy air days in 30 yrs
- 1 days/yr
Risk factors via First Street. Map © Google.
Why this score? — see what drove the D- grade
The composite is a weighted blend of 9 inputs, each scored 0–100. Each bar is that input's sub-score; the figure is the points it added to the 100-point composite (weight × sub-score).
- Cash flow +10.8/30.0
- ARV discount +7.5/15.0
- Appreciation +6.3/10.0
- DSCR +3.1/10.0
- Livability +2.9/5.0
- Rent growth +2.5/5.0
- Condition / age +2.5/5.0
- Schools +2.2/10.0
- 1% rule +2.0/10.0
$225,000
🖨 Deal sheet (PDF) 📄 Offer letter ✓ Due diligence
Listing remarks MLS
Charming Opportunity in a Desirable Location! Set on 1.49 acres in a pleasant and sought-after area, this 2212 square foot home offers space, and plenty of potential. The property features a great setting with room to grow, both inside and out. Whether you're looking to personalize a home to your tastes or simply enjoy the generous lot and peaceful surroundings, this is a rare chance to make something truly your own in a prime location. Please call or text for a viewing today!
Key facts
- Generous lot
- 1.49 acres
- Prime location
Tags
Neighborhood map
What this means for you Summary
Snapshot
- This is a 2-bed/1.0-bath single-family listed at $225k.
Deal economics
- At list price, monthly cash flow is $-102 ($-1k/yr) — negative.
- To cash-flow at today's rent, offer at most $207k (8.0% below list).
- To meet the 1% rule (rent ≥ 1% of price), the offer needs to be $157k (30.3% below list).
- Recommended offer: $157k (30.3% below list) — sets the bar for 1% rule.
Location & tenants
- Location reads 57/100 on livability (#1,277 in TX) — a working-class tenant base; expect higher turnover. Strengths: cost of living A+, housing A+; Watch: crime C-, schools F, amenities F.
- Gadsden Independent Schools (rural): math 20% / reading 34% proficiency, ranked #21 of 29 in NM (top 72%) — low school quality limits family demand, transient renter base, plan for 1-2y turnover; 95% free/reduced lunch — lower-income household profile, screen leases tightly.
- Market conditions: 2 active listings in the ZIP; 964 units permitted in Doña Ana County in 2024 (0 in 5+ unit buildings).
Forward outlook
- In year one you build about $7k of equity ($2k loan paydown + $6k appreciation (2.5% local appreciation)).
- By year 5, paydown + projected appreciation supports a ~$31k cash-out refi (75% LTV) — recoverable capital for the next deal without selling this one.
Negotiation context
- It's been on market 394 days — a 12% lower offer ($198k) is reasonable based on typical stale-listing flexibility.
Risks & watch-outs
- Watch-outs: built in 1917 — expect roof / HVAC / electrical / plumbing capex.
- Climate carrying-cost: moderate wildfire risk; extreme-heat days projected 7→26/yr by 2055 (HVAC capex compounding) — expect insurance premiums to compound above CPI over the hold.
Questions for the listing agent
- What do current leases actually rent for vs. the listed asking? Can we see a recent rent roll and the last 12 months of T-12 income?
- It's been on market 394 days. Have you received any prior offers? Is the seller open to a 30% concession, seller financing, or rate buy-down credit?
- Built in 1917 — when were the roof, HVAC, electrical panel, plumbing, and water heater last replaced?
- Why hasn't it sold? Are there any deal-killer items the seller is aware of (foundation, flood, title, zoning, code violations)?
- Is there a deadline driving the sale (1031 exchange, divorce, estate, relocation)? That informs how much negotiation room exists.
- Schools are F-rated, which usually means shorter tenancies and higher turnover. Who's the typical renter profile here, and what's been the actual vacancy rate?
- The area grade is low — what's the realistic commute time and amenity access for the typical tenant pool here? Any planned neighborhood developments (good or bad) we should know about?
- What's the average days-on-market for RENTAL listings here right now (not sales)? A rising rental-DOM trend means longer vacancies and softer asking-rent achievability than the comps imply.
- What's the recent tenant-quality profile in this submarket — average credit score on applications, eviction rate, late-payment / NSF rate, and stable-employment percentage? A property-management company in the area should have these aggregated.
- How much new for-sale + rental construction is in the pipeline within 1–3 miles? Heavy new supply typically softens prices + rents 12–24 months out; constrained supply supports both.
Investment metrics
- 1% rule
- 0.70% ✗
- Cap rate
- 5.75%
- Cash-on-cash
- -1.95%
- DSCR
- 0.91
- GRM
- 11.9
CMA / ARV
No comps found within radius.
Projected returns pro-forma
2.51% appreciation · 3.0% rent growth · sell at horizon
- IRR
- 4.2%
- Equity multiple
- 1.23×
- Total profit
- $14,730
- Equity at exit
- $95,063
- IRR
- 7.6%
- Equity multiple
- 2.09×
- Total profit
- $68,754
- Equity at exit
- $141,921
Cash invested: $63,000 (down + closing). Projections, not guarantees.
Landlord ↔ Tenant lean methodology
- Overall (STATE)
- 87 Strongly Landlord-Friendly
- State Texas
- 87 Strongly Landlord-Friendly · R+5
- County
- — inherits STATE
- City
- — inherits STATE
ZIP-level market 88021
- Home prices YoY
- 0.9%
- Active inventory
- 2
- Price-to-rent
- 11.9×
Monthly cashflow live
- Estimated rent
- $1,569 medium interval (Pro) →
- Mortgage (P&I)
- −$1,180
- Tax from tax record
- −$68 /mo · $821/yr
- Insurance
- −$94
- HOA
- −$0
- Vacancy / Maint / Mgmt
- −$330
- Net cashflow
- $-102
Break-even live
Sensitivity live
| Price | -10% $25 | -5% $-39 | +0% $-102 | +5% $-166 | +10% $-230 |
|---|---|---|---|---|---|
| Rent | -10% $-226 | -5% $-164 | +0% $-102 | +5% $-40 | +10% $21 |
| Rate | -1.0pp $11 | -0.5pp $-45 | base $-102 | +0.5pp $-161 | +1.0pp $-220 |
UW: 25.0% down · 7.5% · 30yr · 1.5% tax · 5.0% vac · 8.0% maint · 8.0% mgmt
Financing live
Cash to close
- Down payment
- $56,250
- Closing costs
- $6,750
- Reserves months
- —
- Total cash needed
- —
Loan-product check · same deal, 3 products live
Conventional
25% down · 7.5% · 30yr
- Down + closing
- —
- Monthly P&I
- —
- Monthly cashflow
- —
- DSCR
- —
- Eligible?
- —
Personal DTI + credit; lowest rate.
DSCR
20% down · 8.5% · 30yr
- Down + closing
- —
- Monthly P&I
- —
- Monthly cashflow
- —
- DSCR
- —
- Eligible?
- —
No personal income docs; deal must DSCR.
Hard money
10% down · 12.0% · 12mo
- Down + closing
- —
- Monthly P&I
- —
- Monthly cashflow
- —
- DSCR
- —
- Eligible?
- —
Short-term bridge; refi at stabilization.
Listing history 17 events
-
2026-06-19days on market $225,000 Active 394 DOM
-
2026-06-18days on market $225,000 Active 393 DOM
-
2026-06-17days on market $225,000 Active 392 DOM
-
2026-06-16days on market $225,000 Active 391 DOM
-
2026-06-15days on market $225,000 Active 390 DOM
-
2026-06-14days on market $225,000 Active 388 DOM
-
2026-06-13days on market $225,000 Active 387 DOM
-
2026-06-10days on market $225,000 Active 385 DOM
-
2026-06-09days on market $225,000 Active 384 DOM
-
2026-06-08days on market $225,000 Active 383 DOM
-
2026-06-07days on market $225,000 Active 382 DOM
-
2026-06-05days on market $225,000 Active 379 DOM
-
2026-06-02days on market $225,000 Active 377 DOM
-
2026-06-01days on market $225,000 Active 376 DOM
-
2026-05-31days on market $225,000 Active 375 DOM
-
2026-05-30days on market $225,000 Active 374 DOM
-
2025-05-21$225,000 Active 483-char remark
Show marketing remark (483 chars)
Charming Opportunity in a Desirable Location! Set on 1.49 acres in a pleasant and sought-after area, this 2212 square foot home offers space, and plenty of potential. The property features a great setting with room to grow, both inside and out. Whether you're looking to personalize a home to your tastes or simply enjoy the generous lot and peaceful surroundings, this is a rare chance to make something truly your own in a prime location. Please call or text for a viewing today!
ⓘ Source: listings_history table (triggers on properties + properties_extension) + one-shot
backfill from property_details.listing_events for pre-trigger history.
Tax reassessment forecast TX · Resets to sale price
- Current annual tax
- $821 · $68/mo
- Projected year-2 tax
- $4,118 · $343/mo
- Expected delta
- +$3,296/yr (+$275/mo · 401.5%)
ⓘ Screening estimate from a state-policy table — verify with the county assessor before closing.
Climate risk First Street
- Flood 1/10 Low FEMA zone X (shaded) · 0% chance over 30 yrs
- Wildfire 5/10 Major
- Heat 6/10 Major 7 d/yr ≥101°F today · 26 d/yr by 30 yrs out
- Wind 1/10 Low
- Air quality 2/10 Low 1 unhealthy d/yr today · 1 by 30 yrs out
Nearby sold comps map
Loading sold comps map…
Walkable amenities ~0.75 mi
Loading nearby amenities…
Taxation est. · year 1
- Rental income
- $18,830
- − Mortgage interest
- −$12,603
- − Property taxes
- −$821
- − Insurance
- −$1,125
- − Repairs & maintenance
- −$1,506
- − Management
- −$1,506
- − Depreciation
- −$6,545
- Taxable loss
- −$5,278
- Est. tax savings @ 24.0%
- +$1,267
- After-tax cash flow
- $37/yr
For passive investors: Depreciation is non-cash, so a rental often shows a tax loss while cash-flowing — sheltering income. Rental losses are passive: they offset passive income freely, and up to $25,000/yr can offset ordinary (W-2) income if you actively participate and your MAGI is under $100k (phasing out to $0 by $150k); unused losses carry forward. On sale, claimed depreciation is recaptured at up to 25%, and gains may owe capital-gains tax (a 1031 exchange can defer both). Figures are a year-1 estimate at your 24.0% rate — not tax advice; consult a CPA.
Schools (NCES district)
- District
- Gadsden Independent Schools
- NCES district ID
- 3501080
- Math proficiency
- 20% ▼ -2.00%
- Reading proficiency
- 34% ▼ -3.00%
- Median HH income
- $28,461
- Composite
- 21.6/100
- National rank
- #8298
- State rank
- #21 of 29 in NM
Livability — Canutillo
- Score
- 57/100
- State rank
- #1277
- US rank
- #22193
Category grades
Schools grade is shown separately in the Schools card above.
Census & demographics
- Population (ZIP)
- 16,102
Population outlook (Doña Ana County) Hauer SSP2
- Today (2025)
- 219,177 people
- By 2030
- 220,967 · +0.8%
- By 2040
- 222,775 · +1.6%
- By 2050
- 223,576 · +2.0%
- By 2075
- 228,461 · +4.2%
- By 2100
- 214,536 · -2.1%
Race, ethnicity, and origin ACS 2023
- Neighborhood character
- Predominantly Hispanic (94%)
- Race & ethnicity
- Hispanic / Latino 94% Two or more races 32% White 5%
- Hispanic origin (detail)
- Mexican 87%
- Foreign-born
- 26% · Canada
- Languages at home
- 19% English-only · Spanish 81%
Political lean MEDSL · Doña Ana
- 2024 margin
- Lean D (+9.8) · D 53.8% · R 44.0% · Other 2.2%
- 2008→2024 swing
- -7.9pp toward R · 2008: 17.6pp · 2024: 9.8pp
- All cycles
- 2024: D+9.8 2020: D+18.3 2016: D+18.0 2012: D+14.9 2008: D+17.6
Not yet ingested
- Civics
- —
Market trends
- HPI YoY
- ▲ 2.51%
- Current HPI
- 278.827
- Rent YoY
- —
- Metro
- —
- State GDP YoY
- ▲ 3.95%
- F500 in state
- 110
Industry mix (Fortune 500 HQ in TX)
| Industry | F500 HQs | Revenue |
|---|---|---|
| Energy | 16 | $1,198B |
|
||
| Technology | 5 | $198B |
|
||
| Engineering / Construction | 4 | $72B |
|
||
| Energy Services | 3 | $60B |
|
||
| Utilities | 3 | $41B |
|
||
| Healthcare | 2 | $330B |
|
||
Price history
1 event — show timeline
- 2025-05-21 Listed $225,000 GEPARMLS
Property tax history
+3.0%/yrLatest (2025): $821 · +2.7% YoY. Source: county tax records.
Cash-flow waterfall
monthlySold comps — $/sqft
last 12 mo · ≤1 miLoading sold comps…