 8-Plex
800 W South St · Kalamazoo, MI
Flood risk No data
- FEMA flood zone
- —
- Chance of flooding over 30 yrs
- —
- Est. flood insurance / yr
- —
Fire risk No data
- Est. fire insurance / yr
- —
Heat risk No data
- Hot days now (above threshold)
- —
- Hot days in 30 yrs
- —
Wind risk No data
- Chance of severe wind over 30 yrs
- —
Air-quality risk No data
- Unhealthy air days now
- —
- Unhealthy air days in 30 yrs
- —
Risk factors via First Street. Map © Google.
Why this score? — see what drove the B grade
The composite is a weighted blend of 9 inputs, each scored 0–100. Each bar is that input's sub-score; the figure is the points it added to the 100-point composite (weight × sub-score).
- Cash flow +30.0/30.0
- DSCR +10.0/10.0
- 1% rule +9.6/10.0
- ARV discount +7.5/15.0
- Schools +4.7/10.0
- Livability +3.8/5.0
- Condition / age +2.5/5.0
- Rent growth +2.3/5.0
- Appreciation +0.0/10.0
$855,000
🖨 Deal sheet 📄 Offer letter ✓ Due diligence
Multi-family units
County records classify this as Multi-Family (5+ Unit). Listing-text estimate: 8 units. confirmed
5+ unit building — per-unit beds/baths from public records are typically unavailable; the breakdown below (if shown) is an estimate from the listing text.
Listing remarks MLS
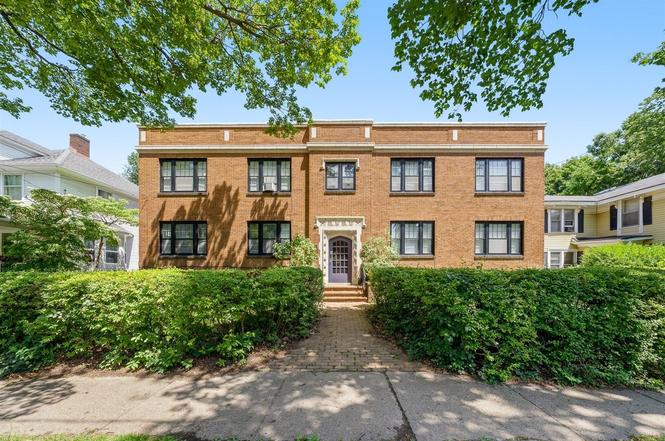
Own a Piece of Kalamazoo History! Located in one of Kalamazoo's most prestigious and sought-after neighborhoods, South Street, this stately all-brick 8-unit apartment building presents an exceptional investment opportunity. Rich in character and timeless appeal, this well-maintained property is considered one of the area's finest multifamily assets. Most units are currently occupied, providing immediate rental income for the next owner. A unique opportunity to own a landmark investment property in a premier location.
Key facts
- 6,538 sq ft lot
- 8 parking spots
- Built 1927
Property features AI
Finance
- Financial info: Multiple rental units with listed rents by unit type (examples): studio units rent from $800–$950; 1-bedroom units rent from $1,050–$1,100; 2-bedroom units rent from $880–$1,300; Property described as residential income / multifamily
- HOA & community: Community features include sidewalks
Exterior
- Parking: Total of 8 parking spaces; Carport available; Parking surfaces: concrete, gravel, unpaved
- Utilities: Public water; Public sewer; Electricity connected; Natural gas connected; Cable connected; Phone available and connected; Sewer available
- Home design: Residential income property (multifamily); Multiple buildings accessed from Oakland Drive and W. South Street; cross street Oakland & Oak
- Construction: Brick construction
- Exterior features: Rubber roof; Level lot; Paved public-maintained road; Sidewalks
Interior
- Kitchen: Kitchens included as part of each rental unit (standard unit kitchens)
- Bedrooms: Multiple unit types including studios, 1-bedroom and 2-bedroom units (some with sunrooms and dining areas); Some units described as first-floor or second-floor (e.g., 1st floor studio; 2nd floor studio; 1st floor 1-bed + sun; 2nd floor 1-bed + sun)
- Bathrooms: Each unit has one bathroom
- Heating & cooling: Heating present; Baseboard heating; Natural gas heating; Steam heating
- Interior features: Storage; Walk-out, daylight, full basement
- Laundry & utility: Common area laundry with sink; Other shared laundry facilities
Neighborhood map
What this means for you Summary
Snapshot
- This is a 8 × 8-bed/7.0-bath units multifamily listed at $855k.
Deal economics
- At list price, monthly cash flow is $4k ($52k/yr) — positive. Per door: $538/mo.
- The deal already cash-flows at list — no discount required.
- Meets the 1% rule at list price ($12k rent vs $855k).
- Cap rate 12.3% vs local median 4.1% in Kalamazoo — top-decile yield for the area; either an underpriced asset or a hidden risk that comps aren't pricing in. Stress-test before assuming the spread holds.
Location & tenants
- Location reads 76/100 on livability (#141 in MI, #3,492 nationally) — a middle-class / working-renter tenant base. Strengths: commute A+, cost of living A+, housing A+; Watch: crime F, employment D-.
- Kalamazoo Public Schools (urban): math 43% / reading 72% proficiency, ranked #71 of 540 in MI (top 13%) — acceptable for families but not a draw, mixed tenant base, ~2y average lease; 66% free/reduced lunch — lower-income household profile, screen leases tightly.
- Market conditions: Rents soft (-0.8%/yr); 77 active listings in the ZIP; lower-income renter base — watch delinquency; 339 units permitted in Kalamazoo County in 2024 (22 in 5+ unit buildings).
- At $12,466/mo this rent would consume 380% of the median local household income ($39k/yr) (locally 816% of renters already pay >50% of income on rent) — very limited rent-growth headroom before tenants either downsize or default.
Forward outlook
- Local home prices are declining (-3.0%/yr); year-one equity from $6k of loan paydown is wiped out by about $26k of value loss. Plan a longer hold.
- Kalamazoo County population projected at +18% by 2050 — long-run rental-demand tailwind backs the buy-and-hold thesis.
- At projected returns (-3.0% appreciation + 0.0% rent growth), your $239k cash investment doubles in ~7 years — after that, you're playing with house money.
Negotiation context
- Only 3 days on market — expect competitive offers; lowballing is unlikely to land.
- 4 sale attempts since 24y ago with the ask held roughly flat each time — persistent listings suggest the price (not the market) is what's stuck; bring a comps-based counter.
- Current owner paid $285k; list at $855k implies a 200% gain — meaningful room to come down on a strong offer.
Risks & watch-outs
- Watch-outs: built in 1927 — expect roof / HVAC / electrical / plumbing capex.
Questions for the listing agent
- Can we see the unit-by-unit rent roll, current vacancy, and any below-market leases? What's the average tenancy length?
- What capital expenditures (roof, boiler, parking lot, exteriors) have been made in the last 5 years, and what's planned in the next 2?
- Built in 1927 — when were the roof, HVAC, electrical panel, plumbing, and water heater last replaced?
- Is there a deadline driving the sale (1031 exchange, divorce, estate, relocation)? That informs how much negotiation room exists.
- Crime grade is F in this area — have there been break-ins, vandalism, or insurance claims at this property in the last 3 years? What carrier currently insures it and at what premium?
- What's the average days-on-market for RENTAL listings here right now (not sales)? A rising rental-DOM trend means longer vacancies and softer asking-rent achievability than the comps imply.
- What's the recent tenant-quality profile in this submarket — average credit score on applications, eviction rate, late-payment / NSF rate, and stable-employment percentage? A property-management company in the area should have these aggregated.
- How much new apartment / multifamily construction is in the pipeline within 1–3 miles? Heavy new supply (>2% of stock underway) typically softens rents 12–24 months out; light construction supports rent growth.
Investment metrics
- 1% rule
- 1.46% ✓
- Cap rate
- 12.33%
- Cash-on-cash
- 21.58%
- DSCR
- 1.96
- GRM
- 5.7
CMA / ARV
No comps found within radius.
Projected returns pro-forma
-3.0% appreciation · 0.0% rent growth · sell at horizon
- IRR
- 10.8%
- Equity multiple
- 1.41×
- Total profit
- $99,031
- Equity at exit
- $127,483
- IRR
- 17.4%
- Equity multiple
- 2.24×
- Total profit
- $297,910
- Equity at exit
- $73,925
Cash invested: $239,400 (down + closing). Projections, not guarantees.
Landlord ↔ Tenant lean methodology
- Overall (STATE)
- 62 Landlord-Friendly
- State Michigan
- 62 Landlord-Friendly · EVEN
- County
- — inherits STATE
- City
- — inherits STATE
ZIP-level market 49007
- Rents YoY
- -0.8%
- Active inventory
- 77
- Price-to-rent
- 45.7×
Monthly cashflow live
- Estimated rent
- $12,466 medium interval (Pro) →
- Mortgage (P&I)
- −$4,484
- Tax from tax record
- −$704 /mo · $8,446/yr
- Insurance
- −$356
- HOA
- −$0
- Vacancy / Maint / Mgmt
- −$2,618
- Net cashflow
- $4,304
Break-even live
8-unit breakdown (identical units grouped — click to expand)
| Units | Beds | Baths | Est. rent |
|---|---|---|---|
| 8× units | 8 | 7 | $12,464 |
| #1 | 8 | 7 | $1,558 |
| #2 | 8 | 7 | $1,558 |
| #3 | 8 | 7 | $1,558 |
| #4 | 8 | 7 | $1,558 |
| #5 | 8 | 7 | $1,558 |
| #6 | 8 | 7 | $1,558 |
| #7 | 8 | 7 | $1,558 |
| #8 | 8 | 7 | $1,558 |
| Total (8 units) | $12,466 | ||
UW: 25.0% down · 7.5% · 30yr · 1.5% tax · 5.0% vac · 8.0% maint · 8.0% mgmt
Financing live
Cash to close
- Down payment
- $213,750
- Closing costs
- $25,650
- Reserves months
- —
- Total cash needed
- —
Loan-product check · same deal, 3 products live
Conventional
25% down · 7.5% · 30yr
- Down + closing
- —
- Monthly P&I
- —
- Monthly cashflow
- —
- DSCR
- —
- Eligible?
- —
Personal DTI + credit; lowest rate.
DSCR
20% down · 8.5% · 30yr
- Down + closing
- —
- Monthly P&I
- —
- Monthly cashflow
- —
- DSCR
- —
- Eligible?
- —
No personal income docs; deal must DSCR.
Hard money
10% down · 12.0% · 12mo
- Down + closing
- —
- Monthly P&I
- —
- Monthly cashflow
- —
- DSCR
- —
- Eligible?
- —
Short-term bridge; refi at stabilization.
Listing history 4 events
-
2026-06-18days on market $855,000 Active 3 DOM
-
2026-06-17days on market $855,000 Active 2 DOM
-
2026-06-15remarks 522-char remark
-
2026-06-15$855,000 Active 1 DOM
ⓘ Source: listings_history table (triggers on properties + properties_extension) + one-shot
backfill from property_details.listing_events for pre-trigger history.
Tax reassessment forecast MI · Partial reset (capped growth)
- Current annual tax
- $8,446 · $704/mo
- Projected year-2 tax
- $10,806 · $901/mo
- Expected delta
- +$2,361/yr (+$197/mo · 27.9%)
ⓘ Screening estimate from a state-policy table — verify with the county assessor before closing.
Nearby sold comps map
Loading sold comps map…
Walkable amenities ~0.75 mi
Loading nearby amenities…
Taxation est. · year 1
- Rental income
- $149,592
- − Mortgage interest
- −$47,893
- − Property taxes
- −$8,446
- − Insurance
- −$4,275
- − Repairs & maintenance
- −$11,967
- − Management
- −$11,967
- − Depreciation
- −$24,873
- Taxable income
- $40,170
- Est. tax owed @ 24.0%
- −$9,641
- After-tax cash flow
- $42,011/yr
For passive investors: Depreciation is non-cash, so a rental often shows a tax loss while cash-flowing — sheltering income. Rental losses are passive: they offset passive income freely, and up to $25,000/yr can offset ordinary (W-2) income if you actively participate and your MAGI is under $100k (phasing out to $0 by $150k); unused losses carry forward. On sale, claimed depreciation is recaptured at up to 25%, and gains may owe capital-gains tax (a 1031 exchange can defer both). Figures are a year-1 estimate at your 24.0% rate — not tax advice; consult a CPA.
Schools (NCES district)
- District
- Kalamazoo Public Schools
- NCES district ID
- 2619950
- Math proficiency
- 43% ▲ 13.00%
- Reading proficiency
- 72% ▲ 33.00%
- Median HH income
- $35,291
- Composite
- 47.48/100
- National rank
- #2275
- State rank
- #71 of 540 in MI
Livability — Kalamazoo
- Score
- 76/100
- State rank
- #141
- US rank
- #3492
Category grades
Schools grade is shown separately in the Schools card above.
Census & demographics
- Census place
- Kalamazoo, MI
- County
- Kalamazoo County · 224,317 people
- City population
- 121,397
- Metro
- Kalamazoo-Portage, MI
- Population (ZIP)
- 9,836
- Household income
- $39,344
- Rent vs Own
- Severe rent burden
- 816.0
Population outlook (Kalamazoo County) Hauer SSP2
- Today (2025)
- 280,982 people
- By 2030
- 292,068 · +3.9%
- By 2040
- 312,191 · +11.1%
- By 2050
- 331,196 · +17.9%
- By 2075
- 379,021 · +34.9%
- By 2100
- 396,579 · +41.1%
Race, ethnicity, and origin ACS 2023
- Neighborhood character
- Diverse neighborhood (Simpson 0.61)
- Race & ethnicity
- White 44% Black 44% Two or more races 7% Hispanic / Latino 3%
- Common ancestry
- Iranian 3% Romanian 2% Lithuanian 1%
- Foreign-born
- 3% · Canada
- Languages at home
- 94% English-only · Spanish 4% French/Haitian/Cajun 1% Arabic 1%
Political lean MEDSL · Kalamazoo
- 2024 margin
- D (+17.7) · D 58.0% · R 40.3% · Other 1.7%
- 2008→2024 swing
- -1.8pp toward R · 2008: 19.5pp · 2024: 17.7pp
- All cycles
- 2024: D+17.7 2020: D+18.7 2016: D+12.8 2012: D+13.3 2008: D+19.5
Not yet ingested
- Civics
- —
Market trends
- HPI YoY
- ▼ -68.80%
- Current HPI
- 112.4973
- Rent YoY
- ▼ -0.85%
- Metro
- Kalamazoo-Portage, MI
- State GDP YoY
- ▲ 1.37%
- F500 in state
- 28
Industry mix (Fortune 500 HQ in MI)
| Industry | F500 HQs | Revenue |
|---|---|---|
| Automotive Parts | 3 | $48B |
|
||
| Automotive | 2 | $372B |
|
||
| Chemicals | 1 | $45B |
|
||
| Automotive Retail | 1 | $29B |
|
||
| Healthcare / Medical Devices | 1 | $23B |
|
||
| Automotive Technology | 1 | $20B |
|
||
Price history
+185.0% since first listed7 events — show timeline
- 2026-06-08 Listed $855,000 REALCOMP
- 2026-06-08 Listed $855,000 MiRealSource-MiMLS
- 2007-07-09 Sold (Public Records) $285,000 Public Records
- 2007-04-30 Sold (MLS) $285,000 SW Michigan MLS
- 2006-04-20 Listed $299,900 SW Michigan MLS
- 2002-08-12 Sold (MLS) $383,000 SW Michigan MLS
- 2002-07-01 Listed $300,000 SW Michigan MLS
Property tax history
+3.7%/yrLatest (2025): $8,446 · +3.0% YoY. Source: county tax records.
Cash-flow waterfall
monthlySold comps — $/sqft
last 12 mo · ≤1 miLoading sold comps…