 Multi-family
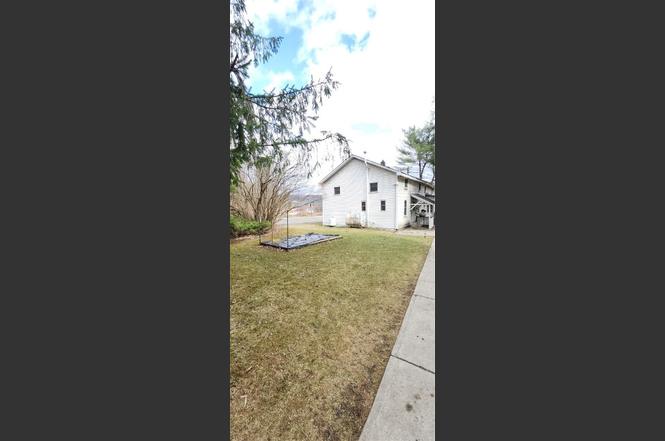
2448 Nys Route 223 · Van Etten, NY
Flood risk 9/10 · Severe
- FEMA flood zone
- X
- Chance of flooding over 30 yrs
- 0.99%
- Est. flood insurance / yr
- $473 – $860
Fire risk 1/10 · Minimal
- Est. fire insurance / yr
- $691 – $1,283
Heat risk 2/10 · Minimal
- Hot days now (above 93°F)
- 8 days/yr
- Hot days in 30 yrs
- 17 days/yr
Wind risk 2/10 · Minimal
- Chance of severe wind over 30 yrs
- 1.0%
Air-quality risk 2/10 · Minimal
- Unhealthy air days now
- 0 days/yr
- Unhealthy air days in 30 yrs
- 1 days/yr
Risk factors via First Street. Map © Google.
Why this score? — see what drove the B+ grade
The composite is a weighted blend of 9 inputs, each scored 0–100. Each bar is that input's sub-score; the figure is the points it added to the 100-point composite (weight × sub-score).
- Cash flow +30.0/30.0
- 1% rule +10.0/10.0
- DSCR +10.0/10.0
- Appreciation +7.7/10.0
- ARV discount +7.5/15.0
- Schools +4.2/10.0
- Livability +2.9/5.0
- Rent growth +2.5/5.0
- Condition / age +2.5/5.0
$39,000
🖨 Deal sheet 📄 Offer letter ✓ Due diligence
Multi-family units
County records classify this as Multi-Family (2-4 Unit). Listing-text estimate: 1 unit. estimate disagrees with records
Listing remarks
Unique opportunity to own a duplex shared. This is a duplex home, with one owner owning the one side, and the other side being sold. New owner would co-own the property but fully own their 2 bedroom 1 bathroom side of the home. The home comes with 2 sheds, and half the garage, fully separated for a one car and storage space. Well maintained home, with a nice size eat in kitchen, with laundry room, full bathroom and large livingroom on the first floor. Upstairs has two bedrooms with large closet space in each room. Affordable home, or make it an investment property and rent out.
Key facts
- Laundry room
- Full bathroom
- Eat in kitchen
Tags
Neighborhood map
What this means for you Summary
Snapshot
- This is a 5-bed/2.0-bath multifamily listed at $39k.
Deal economics
- At list price, monthly cash flow is $824 ($10k/yr) — positive.
- The deal already cash-flows at list — no discount required.
- Meets the 1% rule at list price ($1k rent vs $39k).
- Recommended offer: $34k (12.0% below list) — sets the bar for market timing.
Location & tenants
- Location reads 58/100 on livability (#1,054 in NY) — a working-class tenant base; expect higher turnover. Strengths: cost of living A+, housing A-; Watch: employment C-, crime F, amenities F.
- Spencer-Van Etten Central School District (rural): math 50% / reading 48% proficiency, ranked #405 of 590 in NY (top 69%) — families likely to look elsewhere, expect single-tenant / working-renter base with shorter leases.
- Zoned schools: Spencer-Van Etten Elementary School (math 47% / reading 47%, grade D-, #1,195 of 2,108 statewide, top 60%, 332 students, 51% FRL).
- Market conditions: 15 active listings in the ZIP; 91 units permitted in Chemung County in 2024 (63 in 5+ unit buildings).
Forward outlook
- In year one you build about $2k of equity ($270 loan paydown + $2k appreciation (5.4% local appreciation)).
- Chemung County population projected at -17% by 2050 — secular population decline; favor cash flow + early exit over multi-decade hold.
- At projected returns (5.4% appreciation + 3.0% rent growth), your $11k cash investment doubles in ~1 year — after that, you're playing with house money.
Negotiation context
- It's been on market 128 days — a 12% lower offer ($34k) is reasonable based on typical stale-listing flexibility.
Risks & watch-outs
- Watch-outs: flood insurance adds $56/mo; built in 1949 — expect roof / HVAC / electrical / plumbing capex.
- Climate carrying-cost: severe flood risk — expect insurance premiums to compound above CPI over the hold.
Questions for the listing agent
- It's been on market 128 days. Have you received any prior offers? Is the seller open to a 12% concession, seller financing, or rate buy-down credit?
- Built in 1949 — when were the roof, HVAC, electrical panel, plumbing, and water heater last replaced?
- What's the actual annual flood-insurance premium (NFIP or private), and is the property in a SFHA with mandatory coverage?
- Why hasn't it sold? Are there any deal-killer items the seller is aware of (foundation, flood, title, zoning, code violations)?
- Is there a deadline driving the sale (1031 exchange, divorce, estate, relocation)? That informs how much negotiation room exists.
- Schools are D-rated, which usually means shorter tenancies and higher turnover. Who's the typical renter profile here, and what's been the actual vacancy rate?
- Crime grade is F in this area — have there been break-ins, vandalism, or insurance claims at this property in the last 3 years? What carrier currently insures it and at what premium?
- What's the average days-on-market for RENTAL listings here right now (not sales)? A rising rental-DOM trend means longer vacancies and softer asking-rent achievability than the comps imply.
- What's the recent tenant-quality profile in this submarket — average credit score on applications, eviction rate, late-payment / NSF rate, and stable-employment percentage? A property-management company in the area should have these aggregated.
- How much new apartment / multifamily construction is in the pipeline within 1–3 miles? Heavy new supply (>2% of stock underway) typically softens rents 12–24 months out; light construction supports rent growth.
Investment metrics
- 1% rule
- 3.73% ✓
- Cap rate
- 33.35%
- Cash-on-cash
- 96.63%
- DSCR
- 5.30
- GRM
- 2.2
CMA / ARV
No comps found within radius.
Projected returns pro-forma
5.42% appreciation · 3.0% rent growth · sell at horizon
- IRR
- 96.4%
- Equity multiple
- 6.72×
- Total profit
- $62,447
- Equity at exit
- $23,092
- IRR
- 94.5%
- Equity multiple
- 14.11×
- Total profit
- $143,113
- Equity at exit
- $40,699
Cash invested: $10,920 (down + closing). Projections, not guarantees.
Landlord ↔ Tenant lean methodology
- Overall (STATE)
- 15 Strongly Tenant-Friendly
- State New York
- 15 Strongly Tenant-Friendly · D+10
- County
- — inherits STATE
- City
- — inherits STATE
ZIP-level market 14889
- Home prices YoY
- 2.6%
- Active inventory
- 15
- Price-to-rent
- 2.2×
Monthly cashflow live
- Estimated rent
- $1,454 medium interval (Pro) →
- Mortgage (P&I)
- −$205
- Tax est. 1.5%
- −$49 /mo · $585/yr
- Insurance
- −$16
- Flood insurance flood zone
- −$56 /mo · $666/yr
- HOA
- −$0
- Vacancy / Maint / Mgmt
- −$305
- Net cashflow
- $824
Break-even live
UW: 25.0% down · 7.5% · 30yr · 1.5% tax · 5.0% vac · 8.0% maint · 8.0% mgmt
Financing live
Cash to close
- Down payment
- $9,750
- Closing costs
- $1,170
- Reserves months
- —
- Total cash needed
- —
Loan-product check · same deal, 3 products live
Conventional
25% down · 7.5% · 30yr
- Down + closing
- —
- Monthly P&I
- —
- Monthly cashflow
- —
- DSCR
- —
- Eligible?
- —
Personal DTI + credit; lowest rate.
DSCR
20% down · 8.5% · 30yr
- Down + closing
- —
- Monthly P&I
- —
- Monthly cashflow
- —
- DSCR
- —
- Eligible?
- —
No personal income docs; deal must DSCR.
Hard money
10% down · 12.0% · 12mo
- Down + closing
- —
- Monthly P&I
- —
- Monthly cashflow
- —
- DSCR
- —
- Eligible?
- —
Short-term bridge; refi at stabilization.
Listing history 3 events
-
2025-08-08status Pending
-
2025-05-23price $39,000
-
2025-04-02$45,500 Active
ⓘ Source: listings_history table (triggers on properties + properties_extension) + one-shot
backfill from property_details.listing_events for pre-trigger history.
Climate risk First Street
- Flood 9/10 Extreme FEMA zone X · 99% chance over 30 yrs
- Wildfire 1/10 Low
- Heat 2/10 Low 8 d/yr ≥93°F today · 17 d/yr by 30 yrs out
- Wind 2/10 Low 100% chance of damaging wind over 30 yrs
- Air quality 2/10 Low 0 unhealthy d/yr today · 1 by 30 yrs out
Nearby sold comps map
Loading sold comps map…
Walkable amenities ~0.75 mi
Loading nearby amenities…
Taxation est. · year 1
- Rental income
- $17,451
- − Mortgage interest
- −$2,185
- − Property taxes
- −$585
- − Insurance
- −$861
- − Repairs & maintenance
- −$1,396
- − Management
- −$1,396
- − Depreciation
- −$1,135
- Taxable income
- $9,893
- Est. tax owed @ 24.0%
- −$2,374
- After-tax cash flow
- $7,511/yr
For passive investors: Depreciation is non-cash, so a rental often shows a tax loss while cash-flowing — sheltering income. Rental losses are passive: they offset passive income freely, and up to $25,000/yr can offset ordinary (W-2) income if you actively participate and your MAGI is under $100k (phasing out to $0 by $150k); unused losses carry forward. On sale, claimed depreciation is recaptured at up to 25%, and gains may owe capital-gains tax (a 1031 exchange can defer both). Figures are a year-1 estimate at your 24.0% rate — not tax advice; consult a CPA.
Schools (NCES district)
- District
- Spencer-Van Etten Central School District
- NCES district ID
- 3627750
- Math proficiency
- 50% ▼ -13.00%
- Reading proficiency
- 48% ▲ 4.00%
- Median HH income
- $48,456
- Composite
- 41.82/100
- National rank
- #3389
- State rank
- #405 of 590 in NY
Livability — Van Etten
- Score
- 58/100
- State rank
- #1054
- US rank
- #20940
Category grades
Schools grade is shown separately in the Schools card above.
Census & demographics
- Population (ZIP)
- 1,341
Population outlook (Chemung County) Hauer SSP2
- Today (2025)
- 82,931 people
- By 2030
- 80,356 · -3.1%
- By 2040
- 74,745 · -9.9%
- By 2050
- 69,012 · -16.8%
- By 2075
- 55,689 · -32.8%
- By 2100
- 41,428 · -50.0%
Race, ethnicity, and origin ACS 2023
- Neighborhood character
- Predominantly White (92%)
- Race & ethnicity
- White 92% Two or more races 6% Hispanic / Latino 1%
- Common ancestry
- Lithuanian 2% Romanian 2% Scotch-Irish 1%
- Foreign-born
- 1% · Canada
Political lean MEDSL · Chemung
- 2024 margin
- R (+16.8) · D 41.6% · R 58.4%
- 2008→2024 swing
- -15.6pp toward R · 2008: -1.2pp · 2024: -16.8pp
- All cycles
- 2024: R+16.8 2020: R+13.4 2016: R+20.0 2012: R+2.9 2008: R+1.2
Not yet ingested
- Civics
- —
Market trends
- HPI YoY
- ▲ 5.42%
- Current HPI
- 211.941
- Rent YoY
- —
- Metro
- —
- State GDP YoY
- ▲ 2.60%
- F500 in state
- 92
Industry mix (Fortune 500 HQ in NY)
| Industry | F500 HQs | Revenue |
|---|---|---|
| Financial Services | 10 | $950B |
|
||
| Consumer Goods | 9 | $162B |
|
||
| Insurance | 4 | $225B |
|
||
| Telecommunications | 2 | $144B |
|
||
| Pharmaceuticals | 2 | $112B |
|
||
| Media / Entertainment | 2 | $69B |
|
||
Price history
-14.3% since first listed3 events — show timeline
- 2025-08-08 Pending — IBRMLS
- 2025-05-23 Price Changed $39,000 IBRMLS
- 2025-04-02 Listed $45,500 IBRMLS
Property tax history
+13.8%/yrLatest (2025): $2,353 · +2.3% YoY. Source: county tax records.
Cash-flow waterfall
monthlySold comps — $/sqft
last 12 mo · ≤1 miLoading sold comps…