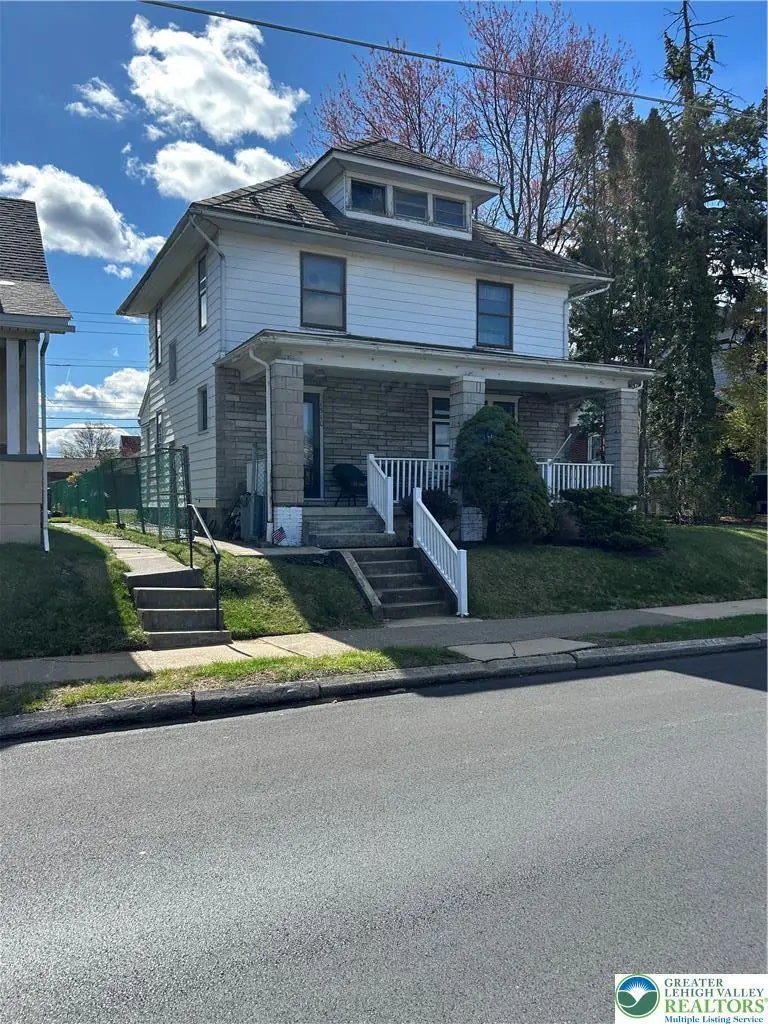
1510 Easton Ave · Bethlehem, PA
Flood risk 1/10 · Minimal
- FEMA flood zone
- X (unshaded)
- Chance of flooding over 30 yrs
- 0.0%
- Est. flood insurance / yr
- $473 – $860
Fire risk 1/10 · Minimal
- Est. fire insurance / yr
- $511 – $949
Heat risk 5/10 · Moderate
- Hot days now (above 99°F)
- 7 days/yr
- Hot days in 30 yrs
- 15 days/yr
Wind risk 4/10 · Minor
- Chance of severe wind over 30 yrs
- 16.0%
Air-quality risk 4/10 · Minor
- Unhealthy air days now
- 3 days/yr
- Unhealthy air days in 30 yrs
- 6 days/yr
Risk factors via First Street. Map © Google.
Why this score? — see what drove the D+ grade
The composite is a weighted blend of 9 inputs, each scored 0–100. Each bar is that input's sub-score; the figure is the points it added to the 100-point composite (weight × sub-score).
- Cash flow +13.3/30.0
- ARV discount +12.4/15.0
- Livability +4.1/5.0
- DSCR +4.0/10.0
- 1% rule +3.6/10.0
- Schools +3.5/10.0
- Rent growth +3.2/5.0
- Condition / age +2.5/5.0
- Appreciation +0.0/10.0
$289,000
🖨 Deal sheet 📄 Offer letter ✓ Due diligence
Listing remarks
Terrific 4 Br Single home in North Bethlehem with many updates. Home features a large eat in kitchen, modern bathroom, an oversized fenced city lot with off-street parking, large living room with hardwood floors, covered front porch, gas heat, and much more. This home is conveniently located near restaurants, bars, schools, and major transportation routes. This home is a definite MUST SEE!!!!
Key facts
- 6,000 sq ft lot
- Parking
- Built 1920
Property features AI
Exterior
- Parking: Off-street parking on a parking pad
- Utilities: Public water; Public sewer
- Home design: Two-story home; Residential zoning
- Construction: Aluminum siding and brick exterior; Slate roof; Full basement
- Exterior features: Porch; Yard fenced
Interior
- Kitchen: Dishwasher; Gas oven and gas range; Microwave; Refrigerator; Gas water heater
- Bedrooms: Four bedrooms on the second floor (approx. 9x9, 11x9, 13x11, 13x11)
- Flooring: Carpet; Hardwood; Linoleum
- Bathrooms: One full bathroom on the second floor (approx. 9x6)
- Heating & cooling: Gas heating with radiators
- Interior features: Dining area and separate/formal dining room; Eat-in kitchen
- Laundry & utility: Gas water heater
Neighborhood map
What this means for you Summary
Snapshot
- This is a 4-bed/1.0-bath single-family listed at $289k.
Deal economics
- At list price, monthly cash flow is $0 ($-2/yr) — negative.
- To cash-flow at today's rent, offer at most $289k (0.0% below list).
- To meet the 1% rule (rent ≥ 1% of price), the offer needs to be $248k (14.3% below list).
- Recommended offer: $248k (14.3% below list) — sets the bar for 1% rule.
- Cap rate 6.3% vs local median 4.3% in Bethlehem — top-decile yield for the area; either an underpriced asset or a hidden risk that comps aren't pricing in. Stress-test before assuming the spread holds.
Location & tenants
- Location reads 82/100 on livability (#138 in PA, #1,122 nationally) — a professional / high-income tenant draw. Strengths: amenities A+, cost of living A+, housing A+; Watch: commute F.
- Bethlehem Area SD (urban): math 31% / reading 49% proficiency, ranked #342 of 539 in PA (top 64%) — families likely to look elsewhere, expect single-tenant / working-renter base with shorter leases.
- Market conditions: Rents rising (+2.6%/yr); 153 active listings in the ZIP; 28 comparable units currently listed for rent nearby; rentals at typical pace (median 14d on market — plan ~3-4 weeks tenant-placement turnaround); solid renter incomes; 567 units permitted in Northampton County in 2024 (151 in 5+ unit buildings).
- This rent runs 33% of the median local income ($91k/yr) — at the standard rent-burdened threshold; future hikes will face affordability resistance.
Forward outlook
- Local home prices are declining (-3.0%/yr); year-one equity from $2k of loan paydown is wiped out by about $9k of value loss. Plan a longer hold.
Negotiation context
- Only 5 days on market — expect competitive offers; lowballing is unlikely to land.
- 3 sale attempts since 15y ago with the ask held roughly flat each time — persistent listings suggest the price (not the market) is what's stuck; bring a comps-based counter.
- Current owner paid $75k; list at $289k implies a 285% gain — meaningful room to come down on a strong offer.
Risks & watch-outs
- Watch-outs: built in 1920 — expect roof / HVAC / electrical / plumbing capex.
- Climate carrying-cost: extreme-heat days projected 7→15/yr by 2055 (HVAC capex compounding) — expect insurance premiums to compound above CPI over the hold.
Questions for the listing agent
- What do current leases actually rent for vs. the listed asking? Can we see a recent rent roll and the last 12 months of T-12 income?
- Built in 1920 — when were the roof, HVAC, electrical panel, plumbing, and water heater last replaced?
- Is there a deadline driving the sale (1031 exchange, divorce, estate, relocation)? That informs how much negotiation room exists.
- Schools are B-rated — typically a magnet for longer-tenancy family renters. What's the average tenant stay here, and is there a school-zone premium baked into asking?
- The area grade is low — what's the realistic commute time and amenity access for the typical tenant pool here? Any planned neighborhood developments (good or bad) we should know about?
- What's the average days-on-market for RENTAL listings here right now (not sales)? A rising rental-DOM trend means longer vacancies and softer asking-rent achievability than the comps imply.
- What's the recent tenant-quality profile in this submarket — average credit score on applications, eviction rate, late-payment / NSF rate, and stable-employment percentage? A property-management company in the area should have these aggregated.
- How much new for-sale + rental construction is in the pipeline within 1–3 miles? Heavy new supply typically softens prices + rents 12–24 months out; constrained supply supports both.
Investment metrics
- 1% rule
- 0.86% ✗
- Cap rate
- 6.29%
- Cash-on-cash
- -0.00%
- DSCR
- 1.00
- GRM
- 9.7
CMA / ARV
- ARV (on-the-fly)
- $324,612
- Comps found
- 12
Show comp detail 12 sales within ~0.75 mi
| Address | Dist | Beds/Ba | Sqft | Sold | Price | $/sf | Match |
|---|---|---|---|---|---|---|---|
| 1510 Easton Ave | 0.00mi | 4/1.0 | 1,524 (0%) | 1mo | $289,000 | $190 | 99 |
| 1415 Maple St | 0.10mi | 3/1.5 (-1) | 1,640 (+8%) | 8mo | $350,000 | $213 | 70 |
| 1608 Millard St | 0.16mi | 4/2.0 | 1,344 (-12%) | 1mo | $430,000 | $320 | 68 |
| 1738 Madison Ave | 0.36mi | 3/2.0 (-1) | 1,622 (+6%) | 7mo | $339,900 | $210 | 58 |
| 2012 Kemmerer St | 0.63mi | 3/2.0 (-1) | 1,551 (+2%) | 3mo | $325,000 | $210 | 56 |
| 2109 Kemmerer St | 0.70mi | 3/1.5 (-1) | 1,466 (-4%) | 2mo | $370,000 | $252 | 53 |
| 1433 Chelsea Ave | 0.52mi | 3/1.5 (-1) | 1,645 (+8%) | 6mo | $349,900 | $213 | 50 |
| 1918 Montgomery St | 0.65mi | 3/1.5 (-1) | 1,652 (+8%) | 1mo | $361,500 | $219 | 48 |
| 439 E Union Blvd | 0.55mi | 3/1.0 (-1) | 1,310 (-14%) | 7mo | $314,537 | $240 | 40 |
| 128 E Spruce St | 0.64mi | 3/1.5 (-1) | 1,728 (+13%) | 5mo | $285,000 | $165 | 37 |
| 1936 Kemmerer St | 0.61mi | 3/1.5 (-1) | 1,312 (-14%) | 6mo | $280,000 | $213 | 37 |
| 1022 Hilton St | 0.72mi | 3/1.5 (-1) | 1,733 (+14%) | 2mo | $310,000 | $179 | 35 |
Match score weights: distance 35% · size 25% · config 20% · recency 20%. Top-matched comps best support the ARV.
Projected returns pro-forma
-3.0% appreciation · 2.6% rent growth · sell at horizon
- IRR
- -16.8%
- Equity multiple
- 0.41×
- Total profit
- $-47,823
- Equity at exit
- $43,091
- IRR
- -9.3%
- Equity multiple
- 0.44×
- Total profit
- $-45,651
- Equity at exit
- $24,987
Cash invested: $80,920 (down + closing). Projections, not guarantees.
Landlord ↔ Tenant lean methodology
- Overall (STATE)
- 62 Landlord-Friendly
- State Pennsylvania
- 62 Landlord-Friendly · EVEN
- County
- — inherits STATE
- City
- — inherits STATE
ZIP-level market 18017
- Rents YoY
- 2.6%
- Active inventory
- 153
- Price-to-rent
- 9.7×
Monthly cashflow live
- Estimated rent
- $2,476 high interval (Pro) →
- Mortgage (P&I)
- −$1,516
- Tax from tax record
- −$321 /mo · $3,847/yr
- Insurance
- −$120
- HOA
- −$0
- Vacancy / Maint / Mgmt
- −$520
- Net cashflow
- $-0
Break-even live
UW: 25.0% down · 7.5% · 30yr · 1.5% tax · 5.0% vac · 8.0% maint · 8.0% mgmt
Financing live
Cash to close
- Down payment
- $72,250
- Closing costs
- $8,670
- Reserves months
- —
- Total cash needed
- —
Loan-product check · same deal, 3 products live
Conventional
25% down · 7.5% · 30yr
- Down + closing
- —
- Monthly P&I
- —
- Monthly cashflow
- —
- DSCR
- —
- Eligible?
- —
Personal DTI + credit; lowest rate.
DSCR
20% down · 8.5% · 30yr
- Down + closing
- —
- Monthly P&I
- —
- Monthly cashflow
- —
- DSCR
- —
- Eligible?
- —
No personal income docs; deal must DSCR.
Hard money
10% down · 12.0% · 12mo
- Down + closing
- —
- Monthly P&I
- —
- Monthly cashflow
- —
- DSCR
- —
- Eligible?
- —
Short-term bridge; refi at stabilization.
Rent comps 28 comps
| Address | Beds | Baths | Sqft | Rent | $/sqft | DOM | Units | Dist |
|---|---|---|---|---|---|---|---|---|
| 409 E Washington Ave Bethlehem, PA | 4.0 | 1.5 | 1650 | $2,645 | $1.60 | 2d | 1 | 0.20mi |
| 1214 Maple St Bethlehem, PA | 3.0 | 1.0 | 1462 | $2,000 | $1.37 | 43d | 1 | 0.22mi |
| 754 E Washington Ave Bethlehem, PA | 3.0 | 2.0 | 1200 | $1,900 | $1.58 | 43d | 1 | 0.34mi |
| 1138 Arcadia St Bethlehem, PA | 3.0 | 1.0 | 1802 | $2,095 | $1.16 | 43d | 1 | 0.46mi |
| 537 Goepp Cir Unit B Bethlehem, PA | 3.0 | 1.5 | 1225 | $1,895 | $1.55 | 43d | 1 | 0.46mi |
| 830 Media St Bethlehem, PA | 3.0 | 1.0 | 1128 | $2,100 | $1.86 | 23d | 1 | 0.48mi |
| 830 Media St Bethlehem, PA | 3.0 | 1.0 | 1128 | $2,100 | $1.86 | 43d | 1 | 0.48mi |
| 822 Elm St Bethlehem, PA | 3.0 | 1.5 | 1406 | $2,195 | $1.56 | 14d | 1 | 0.52mi |
| 1320 Chelsea Ave Bethlehem, PA | 3.0 | 2.0 | 1373 | $2,395 | $1.74 | 2d | 1 | 0.53mi |
| 1320 Chelsea Ave Bethlehem, PA | 3.0 | 2.0 | 1373 | $2,349 | $1.71 | 14d | 1 | 0.53mi |
| 802 Elm St Bethlehem, PA | 4.0 | 1.5 | 1520 | $2,800 | $1.84 | 21d | 1 | 0.55mi |
| 316 E Union Blvd Bethlehem, PA | 4.0 | 2.0 | 1460 | $2,145 | $1.47 | 43d | 1 | 0.59mi |
| 129 E Goepp St Bethlehem, PA | 3.0 | 2.0 | 1648 | $2,600 | $1.58 | 2d | 1 | 0.59mi |
| 1136 N New St Bethlehem, PA | 3.0 | 1.0 | 1296 | $2,300 | $1.77 | 2d | 1 | 0.61mi |
| 122 E Goepp St Unit 1 Bethlehem, PA | 3.0 | 1.0 | 1137 | $1,895 | $1.67 | 2d | 1 | 0.62mi |
| 69 E Goepp St Bethlehem, PA | 3.0 | 1.0 | 1100 | $2,150 | $1.95 | 2d | 1 | 0.65mi |
| 47 W Goepp St Bethlehem, PA | 3.0 | 1.5 | 1184 | $1,995 | $1.68 | 2d | 1 | 0.84mi |
| 68 W Union Blvd Bethlehem, PA | 4.0 | 1.5 | 1804 | $2,295 | $1.27 | 14d | 1 | 0.90mi |
| 1240 Pembroke Rd #1 Bethlehem, PA | 3.0 | 1.0 | 1249 | $1,795 | $1.44 | 43d | 1 | 0.92mi |
| 2234 Easton Ave Bethlehem, PA | 3.0 | 1.5 | 1254 | $2,395 | $1.91 | 2d | 1 | 0.93mi |
| 417 Linden St Bethlehem, PA | 3.0 | 1.5 | 1699 | $2,450 | $1.44 | 2d | 1 | 0.98mi |
| 239 E Church St Bethlehem, PA | 3.0 | 2.5 | 1724 | $2,950 | $1.71 | 23d | 1 | 1.01mi |
| 1057 Decatur St Bethlehem, PA | 3.0 | 2.5 | 1773 | $2,650 | $1.49 | 44d | 1 | 1.03mi |
| 87 W Broad St Unit 2 Bethlehem, PA | 5.0 | 1.0 | 1300 | $2,200 | $1.69 | 14d | 1 | 1.06mi |
| 42 E Wall St Bethlehem, PA | 4.0 | 1.0 | 1474 | $2,550 | $1.73 | 23d | 1 | 1.07mi |
| 1416 Livingston St Bethlehem, PA | 1.0–4.0 | 1.0–2.0 | 1002 | $2,554 | $2.55 | 2d | 20 | 1.25mi |
| 520 W Union Blvd Unit 2 Bethlehem, PA | 3.0 | 1.0 | 2225 | $2,150 | $0.97 | 23d | 1 | 1.33mi |
| 314 State St Bethlehem, PA | 4.0 | 2.0 | 1654 | $2,650 | $1.60 | 14d | 1 | 1.49mi |
Listing history 7 events
-
2026-04-16status Pending
-
2026-04-10$289,000 Active
-
2012-09-07historical
-
2012-05-21$139,900
-
2011-09-07historical
-
2011-03-14$148,000
-
1987-11-01soldstatus $75,000
ⓘ Source: listings_history table (triggers on properties + properties_extension) + one-shot
backfill from property_details.listing_events for pre-trigger history.
Tax reassessment forecast PA · Partial reset (capped growth)
- Current annual tax
- $3,847 · $321/mo
- Projected year-2 tax
- $4,207 · $351/mo
- Expected delta
- +$359/yr (+$30/mo · 9.3%)
ⓘ Screening estimate from a state-policy table — verify with the county assessor before closing.
Climate risk First Street
- Flood 1/10 Low FEMA zone X (unshaded) · 0% chance over 30 yrs
- Wildfire 1/10 Low
- Heat 5/10 Major 7 d/yr ≥99°F today · 15 d/yr by 30 yrs out
- Wind 4/10 Moderate 16% chance of damaging wind over 30 yrs
- Air quality 4/10 Moderate 3 unhealthy d/yr today · 6 by 30 yrs out
Nearby sold comps map
Loading sold comps map…
Walkable amenities ~0.75 mi
Loading nearby amenities…
Taxation est. · year 1
- Rental income
- $29,717
- − Mortgage interest
- −$16,188
- − Property taxes
- −$3,847
- − Insurance
- −$1,445
- − Repairs & maintenance
- −$2,377
- − Management
- −$2,377
- − Depreciation
- −$8,407
- Taxable loss
- −$4,926
- Est. tax savings @ 24.0%
- +$1,182
- After-tax cash flow
- $1,180/yr
For passive investors: Depreciation is non-cash, so a rental often shows a tax loss while cash-flowing — sheltering income. Rental losses are passive: they offset passive income freely, and up to $25,000/yr can offset ordinary (W-2) income if you actively participate and your MAGI is under $100k (phasing out to $0 by $150k); unused losses carry forward. On sale, claimed depreciation is recaptured at up to 25%, and gains may owe capital-gains tax (a 1031 exchange can defer both). Figures are a year-1 estimate at your 24.0% rate — not tax advice; consult a CPA.
Schools (NCES district)
- District
- Bethlehem Area SD
- NCES district ID
- 4203570
- Math proficiency
- 31% ▼ -2.00%
- Reading proficiency
- 49% ▼ -6.00%
- Median HH income
- $55,124
- Composite
- 34.92/100
- National rank
- #5068
- State rank
- #342 of 539 in PA
Livability — Bethlehem
- Score
- 82/100
- State rank
- #138
- US rank
- #1122
Category grades
Schools grade is shown separately in the Schools card above.
Census & demographics
- Census place
- Bethlehem, PA
- County
- Northampton County · 236,814 people
- City population
- 129,661
- Metro
- Allentown-Bethlehem-Easton, PA-NJ
- Population (ZIP)
- 40,640
- Household income
- $91,173
- Rent vs Own
- Severe rent burden
- 950.0
Population outlook (Northampton County) Hauer SSP2
- Today (2025)
- 312,227 people
- By 2030
- 314,769 · +0.8%
- By 2040
- 316,914 · +1.5%
- By 2050
- 318,037 · +1.9%
- By 2075
- 334,003 · +7.0%
- By 2100
- 344,696 · +10.4%
Race, ethnicity, and origin ACS 2023
- Neighborhood character
- Majority White (64%)
- Race & ethnicity
- White 64% Hispanic / Latino 25% Two or more races 14% Black 5% Asian 4%
- Hispanic origin (detail)
- Puerto Rican 16% Dominican 4%
- Common ancestry
- Romanian 4% Polish 2% Lithuanian 1%
- Foreign-born
- 10% · Canada, China, Vietnam
- Languages at home
- 77% English-only · Spanish 15% Other Indo-European 2% French/Haitian/Cajun 1%
Political lean MEDSL · Northampton
- 2024 margin
- Toss-up / Even · D 48.6% · R 50.4%
- 2008→2024 swing
- -14.1pp toward R · 2008: 12.3pp · 2024: -1.8pp
- All cycles
- 2024: R+1.8 2020: D+0.7 2016: R+3.8 2012: D+4.6 2008: D+12.3
Not yet ingested
- Civics
- —
Market trends
- HPI YoY
- ▼ -218.92%
- Current HPI
- 203.0358
- Rent YoY
- ▲ 2.60%
- Metro
- Allentown-Bethlehem-Easton, PA-NJ
- State GDP YoY
- ▲ 1.68%
- F500 in state
- 34
Industry mix (Fortune 500 HQ in PA)
| Industry | F500 HQs | Revenue |
|---|---|---|
| Healthcare | 2 | $309B |
|
||
| Insurance | 2 | $27B |
|
||
| Telecommunications / Media | 1 | $124B |
|
||
| Industrial Distribution | 1 | $22B |
|
||
| Financial Services | 1 | $20B |
|
||
| Chemicals / Materials | 1 | $18B |
|
||
Price history
+285.3% since first listed7 events — show timeline
- 2026-04-16 Pending — GLVRMLS
- 2026-04-10 Listed $289,000 GLVRMLS
- 2012-09-07 Listing Removed — GLVRMLS
- 2012-05-21 Listed $139,900 GLVRMLS
- 2011-09-07 Listing Removed — GLVRMLS
- 2011-03-14 Listed $148,000 GLVRMLS
- 1987-11-01 Sold (Public Records) $75,000 Public Records
Property tax history
+1.9%/yrLatest (2026): $3,847 · +3.5% YoY. Source: county tax records.
Cash-flow waterfall
monthlySold comps — $/sqft
last 12 mo · ≤1 miLoading sold comps…