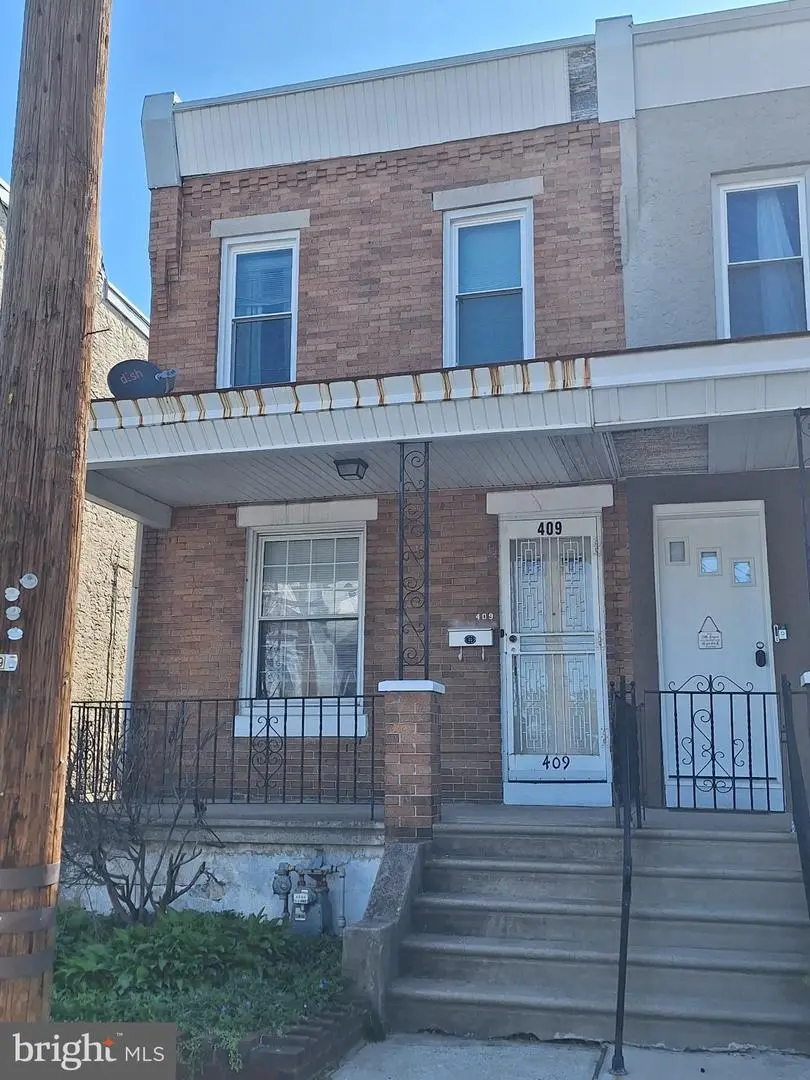
409 S 4th St · Colwyn, PA
Flood risk 1/10 · Minimal
- FEMA flood zone
- X (unshaded)
- Chance of flooding over 30 yrs
- 0.0%
- Est. flood insurance / yr
- $473 – $860
Fire risk 1/10 · Minimal
- Est. fire insurance / yr
- $511 – $949
Heat risk 7/10 · Major
- Hot days now (above 103°F)
- 7 days/yr
- Hot days in 30 yrs
- 15 days/yr
Wind risk 6/10 · Moderate
- Chance of severe wind over 30 yrs
- 27.0%
Air-quality risk 4/10 · Minor
- Unhealthy air days now
- 3 days/yr
- Unhealthy air days in 30 yrs
- 6 days/yr
Risk factors via First Street. Map © Google.
Why this score? — see what drove the B+ grade
The composite is a weighted blend of 9 inputs, each scored 0–100. Each bar is that input's sub-score; the figure is the points it added to the 100-point composite (weight × sub-score).
- Cash flow +29.0/30.0
- ARV discount +15.0/15.0
- 1% rule +10.0/10.0
- DSCR +10.0/10.0
- Rent growth +5.0/5.0
- Livability +4.2/5.0
- Condition / age +2.5/5.0
- Schools +1.7/10.0
- Appreciation +0.0/10.0
$100,000
🖨 Deal sheet (PDF) 📄 Offer letter ✓ Due diligence
Key facts
- Parking
- Built 1929
- Listed 47 days
Neighborhood map
What this means for you Summary
Snapshot
- This is a 3-bed/1.0-bath single-family listed at $100k.
Deal economics
- At list price, monthly cash flow is $342 ($4k/yr) — positive.
- The deal already cash-flows at list — no discount required.
- Meets the 1% rule at list price ($2k rent vs $100k).
- Recommended offer: $97k (3.0% below list) — sets the bar for market timing.
Location & tenants
- Location reads 83/100 on livability (#119 in PA, #943 nationally) — a professional / high-income tenant draw. Strengths: crime A+, commute A+, cost of living A+; Watch: schools D.
- William Penn SD (suburban): math 11% / reading 28% proficiency, ranked #491 of 539 in PA (top 91%) — low school quality limits family demand, transient renter base, plan for 1-2y turnover; 69% free/reduced lunch — lower-income household profile, screen leases tightly.
- Market conditions: Rents rising fast (+13.1%/yr); 98 active listings in the ZIP; 20 comparable units currently listed for rent nearby; rentals at typical pace (median 21d on market — plan ~3-4 weeks tenant-placement turnaround); 299 units permitted in Delaware County in 2024 (5 in 5+ unit buildings).
- This rent runs 41% of the median local income ($46k/yr) — at the standard rent-burdened threshold; future hikes will face affordability resistance.
Forward outlook
- Local home prices are declining (-3.0%/yr); year-one equity from $691 of loan paydown is wiped out by about $3k of value loss. Plan a longer hold.
- At projected returns (-3.0% appreciation + 8.0% rent growth), your $28k cash investment doubles in ~6 years — after that, you're playing with house money.
Negotiation context
- It's been on market 47 days — a 3% lower offer ($97k) is reasonable based on typical stale-listing flexibility.
- Current owner paid $37k; list at $100k implies a 170% gain — meaningful room to come down on a strong offer.
Risks & watch-outs
- Watch-outs: property tax is 4.0% of price; built in 1929 — expect roof / HVAC / electrical / plumbing capex.
- Climate carrying-cost: major wind risk, 27% chance of damaging wind over 30y; extreme-heat days projected 7→15/yr by 2055 (HVAC capex compounding) — expect insurance premiums to compound above CPI over the hold.
Questions for the listing agent
- It's been on market 47 days. Have you received any prior offers? Is the seller open to a 3% concession, seller financing, or rate buy-down credit?
- Built in 1929 — when were the roof, HVAC, electrical panel, plumbing, and water heater last replaced?
- Property tax is high relative to price — has the assessment been appealed recently, and will the sale trigger a re-assessment?
- Is there a deadline driving the sale (1031 exchange, divorce, estate, relocation)? That informs how much negotiation room exists.
- Schools are D-rated, which usually means shorter tenancies and higher turnover. Who's the typical renter profile here, and what's been the actual vacancy rate?
- What's the average days-on-market for RENTAL listings here right now (not sales)? A rising rental-DOM trend means longer vacancies and softer asking-rent achievability than the comps imply.
- What's the recent tenant-quality profile in this submarket — average credit score on applications, eviction rate, late-payment / NSF rate, and stable-employment percentage? A property-management company in the area should have these aggregated.
- How much new for-sale + rental construction is in the pipeline within 1–3 miles? Heavy new supply typically softens prices + rents 12–24 months out; constrained supply supports both.
Investment metrics
- 1% rule
- 1.57% ✓
- Cap rate
- 10.40%
- Cash-on-cash
- 14.67%
- DSCR
- 1.65
- GRM
- 5.3
CMA / ARV
- ARV (median comp)
- $180,566
- List price
- $100,000
- Delta
- -44.62%
- Verdict
- UNDERPRICED
- Comps
- 20 within 1.0 mi
Show comp detail 5 sales within ~0.75 mi
| Address | Dist | Beds/Ba | Sqft | Sold | Price | $/sf | Match |
|---|---|---|---|---|---|---|---|
| 9 N Front St | 0.43mi | 3/1.0 | 1,439 (-6%) | 15mo | $107,000 | $74 | 57 |
| 733 Eggleston | 0.65mi | 3/1.5 | 1,352 (-12%) | 1mo | $271,000 | $200 | 47 |
| 311 N 9th St | 0.73mi | 4/2.0 (+1) | 1,478 (-4%) | 12mo | $250,000 | $169 | 40 |
| 7226 Grays Ave | 0.68mi | 3/1.5 | 1,650 (+7%) | 24mo | $230,000 | $139 | 34 |
| 142 Bartlett Ave | 0.61mi | 4/2.0 (+1) | 1,762 (+15%) | 11mo | $165,000 | $94 | 29 |
Match score weights: distance 35% · size 25% · config 20% · recency 20%. Top-matched comps best support the ARV.
Projected returns pro-forma
-3.0% appreciation · 8.0% rent growth · sell at horizon
- IRR
- 11.8%
- Equity multiple
- 1.50×
- Total profit
- $14,065
- Equity at exit
- $14,910
- IRR
- 25.1%
- Equity multiple
- 3.81×
- Total profit
- $78,774
- Equity at exit
- $8,646
Cash invested: $28,000 (down + closing). Projections, not guarantees.
Landlord ↔ Tenant lean methodology
- Overall (STATE)
- 62 Landlord-Friendly
- State Pennsylvania
- 62 Landlord-Friendly · EVEN
- County
- — inherits STATE
- City
- — inherits STATE
ZIP-level market 19023
- Rents YoY
- 13.1%
- Active inventory
- 98
- Price-to-rent
- 5.3×
Monthly cashflow live
- Estimated rent
- $1,573 high interval (Pro) →
- Mortgage (P&I)
- −$524
- Tax from tax record
- −$334 /mo · $4,008/yr
- Insurance
- −$42
- HOA
- −$0
- Vacancy / Maint / Mgmt
- −$330
- Net cashflow
- $342
Break-even live
Sensitivity live
| Price | -10% $399 | -5% $371 | +0% $342 | +5% $314 | +10% $286 |
|---|---|---|---|---|---|
| Rent | -10% $218 | -5% $280 | +0% $342 | +5% $404 | +10% $467 |
| Rate | -1.0pp $393 | -0.5pp $368 | base $342 | +0.5pp $316 | +1.0pp $290 |
UW: 25.0% down · 7.5% · 30yr · 1.5% tax · 5.0% vac · 8.0% maint · 8.0% mgmt
Financing live
Cash to close
- Down payment
- $25,000
- Closing costs
- $3,000
- Reserves months
- —
- Total cash needed
- —
Loan-product check · same deal, 3 products live
Conventional
25% down · 7.5% · 30yr
- Down + closing
- —
- Monthly P&I
- —
- Monthly cashflow
- —
- DSCR
- —
- Eligible?
- —
Personal DTI + credit; lowest rate.
DSCR
20% down · 8.5% · 30yr
- Down + closing
- —
- Monthly P&I
- —
- Monthly cashflow
- —
- DSCR
- —
- Eligible?
- —
No personal income docs; deal must DSCR.
Hard money
10% down · 12.0% · 12mo
- Down + closing
- —
- Monthly P&I
- —
- Monthly cashflow
- —
- DSCR
- —
- Eligible?
- —
Short-term bridge; refi at stabilization.
Rent comps 20 comps
| Address | Beds | Baths | Sqft | Rent | $/sqft | DOM | Units | Dist |
|---|---|---|---|---|---|---|---|---|
| 412 S 2nd St Darby, PA | 3.0 | 1.0 | 1190 | $1,100 | $0.92 | 6d | 1 | 0.08mi |
| 417 S 2nd St Darby, PA | 3.0 | 1.0 | 1190 | $1,020 | $0.86 | 6d | 1 | 0.11mi |
| 304 S 3rd St Darby, PA | 3.0 | 1.0 | 1602 | $1,695 | $1.06 | 44d | 1 | 0.12mi |
| 304 S 3rd St Darby, PA | 3.0 | 1.0 | 1602 | $1,595 | $1.00 | 21d | 1 | 0.12mi |
| 700 Pine St Unit 2F Darby, PA | 2.0 | 1.0 | 1100 | $1,250 | $1.14 | 19d | 1 | 0.27mi |
| 94 S 6th St Darby, PA | 3.0 | 1.5 | 1666 | $2,000 | $1.20 | 25d | 1 | 0.35mi |
| 69 S 7th St Darby, PA | 3.0 | 2.0 | 1446 | $1,700 | $1.18 | 44d | 1 | 0.43mi |
| 106 N 6th St Darby, PA | 2.0 | 1.0 | 1200 | $1,550 | $1.29 | 44d | 1 | 0.51mi |
| 209 Hamilton Ave Darby, PA | 4.0 | 1.0 | 1400 | $1,595 | $1.14 | 15d | 1 | 0.51mi |
| 924 Maple Ter Darby, PA | 3.0 | 1.5 | 1190 | $2,000 | $1.68 | 6d | 1 | 0.73mi |
| 935 Maple Ter Darby, PA | 3.0 | 1.0 | 1266 | $1,585 | $1.25 | 6d | 1 | 0.75mi |
| 935 Maple Ter Darby, PA | 3.0 | 1.0 | 1266 | $1,585 | $1.25 | 11d | 1 | 0.75mi |
| 2 Winthrop Rd Darby, PA | 3.0 | 1.5 | 1224 | $1,900 | $1.55 | 22d | 1 | 0.99mi |
| 526 Macdade Blvd Darby, PA | 2.0 | 1.0 | 2148 | $1,250 | $0.58 | 17d | 1 | 1.08mi |
| 526 Macdade Blvd Darby, PA | 2.0 | 1.0 | 2148 | $1,250 | $0.58 | 44d | 1 | 1.08mi |
| 118 Felton Ave Darby, PA | 3.0 | 1.0 | 1152 | $1,750 | $1.52 | 22d | 1 | 1.10mi |
| 37 Concord Rd Darby, PA | 3.0 | 1.0 | 1120 | $1,795 | $1.60 | 44d | 1 | 1.19mi |
| 820 Greenhill Rd Sharon Hill, PA | 4.0 | 2.0 | 1184 | $2,600 | $2.20 | 6d | 1 | 1.36mi |
| 1519 Roosevelt Dr Sharon Hill, PA | 3.0 | 1.5 | 1260 | $2,295 | $1.82 | 44d | 1 | 1.47mi |
| 66 Folcroft Ave Folcroft, PA | 3.0 | 1.0 | 1224 | $1,895 | $1.55 | 4d | 1 | 1.48mi |
Listing history 23 events
-
2026-06-10pricestatus $100,000 Pending 47 DOM
-
2026-06-09days on market $120,000 Active 47 DOM
-
2026-06-08pricedays on market $120,000 Active 46 DOM
-
2026-06-08price $125,000 Active 45 DOM
-
2026-06-07pricedays on market $130,000 Active 45 DOM
-
2026-06-04days on market $140,000 Active 42 DOM
-
2026-06-03pricedays on market $140,000 Active 41 DOM
-
2026-06-02pricedays on market $150,000 Active 40 DOM
-
2026-06-01days on market $160,000 Active 39 DOM
-
2026-06-01price $160,000 Active 38 DOM
-
2026-05-31days on market $167,500 Active 38 DOM
-
2026-05-18price $180,000
-
2026-05-13price $190,000
-
2026-05-09price $195,000
-
2026-05-07price $200,000
-
2026-05-05price $210,000
-
2026-05-01price $212,500
-
2026-04-28price $215,000
-
2026-04-24$220,000 Active
-
2026-04-20price $220,000
-
2026-04-18price $250,000
-
2026-04-18historical $200,000
-
1985-12-17soldstatus $37,000
ⓘ Source: listings_history table (triggers on properties + properties_extension) + one-shot
backfill from property_details.listing_events for pre-trigger history.
Tax reassessment forecast PA · Partial reset (capped growth)
- Current annual tax
- $4,008 · $334/mo
- Projected year-2 tax
- $4,008 · $334/mo
- Expected delta
- $0/yr ($0/mo · 0.0%)
ⓘ Screening estimate from a state-policy table — verify with the county assessor before closing.
Climate risk First Street
- Flood 1/10 Low FEMA zone X (unshaded) · 0% chance over 30 yrs
- Wildfire 1/10 Low
- Heat 7/10 Severe 7 d/yr ≥103°F today · 15 d/yr by 30 yrs out
- Wind 6/10 Major 27% chance of damaging wind over 30 yrs
- Air quality 4/10 Moderate 3 unhealthy d/yr today · 6 by 30 yrs out
Nearby sold comps map
Loading sold comps map…
Walkable amenities ~0.75 mi
Loading nearby amenities…
Taxation est. · year 1
- Rental income
- $18,873
- − Mortgage interest
- −$5,602
- − Property taxes
- −$4,008
- − Insurance
- −$500
- − Repairs & maintenance
- −$1,510
- − Management
- −$1,510
- − Depreciation
- −$2,909
- Taxable income
- $2,834
- Est. tax owed @ 24.0%
- −$680
- After-tax cash flow
- $3,428/yr
For passive investors: Depreciation is non-cash, so a rental often shows a tax loss while cash-flowing — sheltering income. Rental losses are passive: they offset passive income freely, and up to $25,000/yr can offset ordinary (W-2) income if you actively participate and your MAGI is under $100k (phasing out to $0 by $150k); unused losses carry forward. On sale, claimed depreciation is recaptured at up to 25%, and gains may owe capital-gains tax (a 1031 exchange can defer both). Figures are a year-1 estimate at your 24.0% rate — not tax advice; consult a CPA.
Schools (NCES district)
- District
- William Penn SD
- NCES district ID
- 4226390
- Math proficiency
- 11% ▼ -3.00%
- Reading proficiency
- 28% ▼ -7.00%
- Median HH income
- $48,543
- Composite
- 17.29/100
- National rank
- #9086
- State rank
- #491 of 539 in PA
Livability — Colwyn
- Score
- 83/100
- State rank
- #119
- US rank
- #943
Category grades
Schools grade is shown separately in the Schools card above.
Census & demographics
- Census place
- Colwyn, PA
- County
- Delaware County · 399,863 people
- Metro
- Philadelphia-Camden-Wilmington, PA-NJ-DE-MD
- Population (ZIP)
- 22,247
- Household income
- $46,463
- Rent vs Own
- Severe rent burden
- 1468.0
Population outlook (Delaware County) Hauer SSP2
- Today (2025)
- 577,490 people
- By 2030
- 581,243 · +0.6%
- By 2040
- 584,700 · +1.2%
- By 2050
- 586,581 · +1.6%
- By 2075
- 598,706 · +3.7%
- By 2100
- 590,823 · +2.3%
Race, ethnicity, and origin ACS 2023
- Neighborhood character
- Predominantly Black (76%)
- Race & ethnicity
- Black 76% White 15% Two or more races 5% Hispanic / Latino 3% Asian 2%
- Common ancestry
- Swiss 5% Hispanic 1% Romanian 1%
- Foreign-born
- 18% · Canada
- Languages at home
- 84% English-only · French/Haitian/Cajun 4% Spanish 3% Other Asian/Pacific 1%
Political lean MEDSL · Delaware
- 2024 margin
- Strong D (+23.7) · D 61.4% · R 37.6% · Other 1.0%
- 2008→2024 swing
- +2.3pp toward D · 2008: 21.4pp · 2024: 23.7pp
- All cycles
- 2024: D+23.7 2020: D+26.7 2016: D+22.0 2012: D+21.8 2008: D+21.4
Not yet ingested
- Civics
- —
Market trends
- HPI YoY
- ▼ -190.50%
- Current HPI
- 277.7034
- Rent YoY
- ▲ 13.10%
- Metro
- Philadelphia-Camden-Wilmington, PA-NJ-DE-MD
- State GDP YoY
- ▲ 1.68%
- F500 in state
- 34
Industry mix (Fortune 500 HQ in PA)
| Industry | F500 HQs | Revenue |
|---|---|---|
| Healthcare | 2 | $309B |
|
||
| Insurance | 2 | $27B |
|
||
| Telecommunications / Media | 1 | $124B |
|
||
| Industrial Distribution | 1 | $22B |
|
||
| Financial Services | 1 | $20B |
|
||
| Chemicals / Materials | 1 | $18B |
|
||
Price history
+386.5% since first listed12 events — show timeline
- 2026-05-18 Price Changed $180,000 BRIGHT MLS
- 2026-05-13 Price Changed $190,000 BRIGHT MLS
- 2026-05-09 Price Changed $195,000 BRIGHT MLS
- 2026-05-07 Price Changed $200,000 BRIGHT MLS
- 2026-05-05 Price Changed $210,000 BRIGHT MLS
- 2026-05-01 Price Changed $212,500 BRIGHT MLS
- 2026-04-28 Price Changed $215,000 BRIGHT MLS
- 2026-04-24 Listed $220,000 BRIGHT MLS
- 2026-04-20 Price Changed $220,000 BRIGHT MLS
- 2026-04-18 Price Changed $250,000 BRIGHT MLS
- 2026-04-18 Coming Soon $200,000 BRIGHT MLS
- 1985-12-17 Sold (Public Records) $37,000 Public Records
Property tax history
+1.9%/yrLatest (2026): $4,008 · +5.4% YoY. Source: county tax records.
Cash-flow waterfall
monthlySold comps — $/sqft
last 12 mo · ≤1 miLoading sold comps…