None · Helena, MT
Flood risk 1/10 · Minimal
- FEMA flood zone
- X (unshaded)
- Chance of flooding over 30 yrs
- 0.0%
- Est. flood insurance / yr
- $507 – $1,088
Fire risk 6/10 · Moderate
- Est. fire insurance / yr
- $918 – $1,706
Heat risk 3/10 · Minor
- Hot days now (above 91°F)
- 7 days/yr
- Hot days in 30 yrs
- 16 days/yr
Wind risk 1/10 · Minimal
- Chance of severe wind over 30 yrs
- —
Air-quality risk 7/10 · Major
- Unhealthy air days now
- 9 days/yr
- Unhealthy air days in 30 yrs
- 20 days/yr
Risk factors via First Street. Map © Google.
Why this score? — see what drove the B grade
The composite is a weighted blend of 9 inputs, each scored 0–100. Each bar is that input's sub-score; the figure is the points it added to the 100-point composite (weight × sub-score).
- Cash flow +30.0/30.0
- 1% rule +10.0/10.0
- DSCR +10.0/10.0
- ARV discount +7.5/15.0
- Livability +4.0/5.0
- Schools +3.8/10.0
- Rent growth +2.5/5.0
- Condition / age +2.2/5.0
- Appreciation +0.0/10.0
$45,000
🖨 Deal sheet 📄 Offer letter ✓ Due diligence
Key facts
- 9,104 sq ft lot
- Built 1994
- Listed 40 days
Property features AI
Finance
- HOA & community: Street lights in the community
Exterior
- Parking: See remarks for parking details
- Security: Smoke detector(s)
- Utilities: Public water; Public sewer; Electricity connected; Other utilities: see remarks
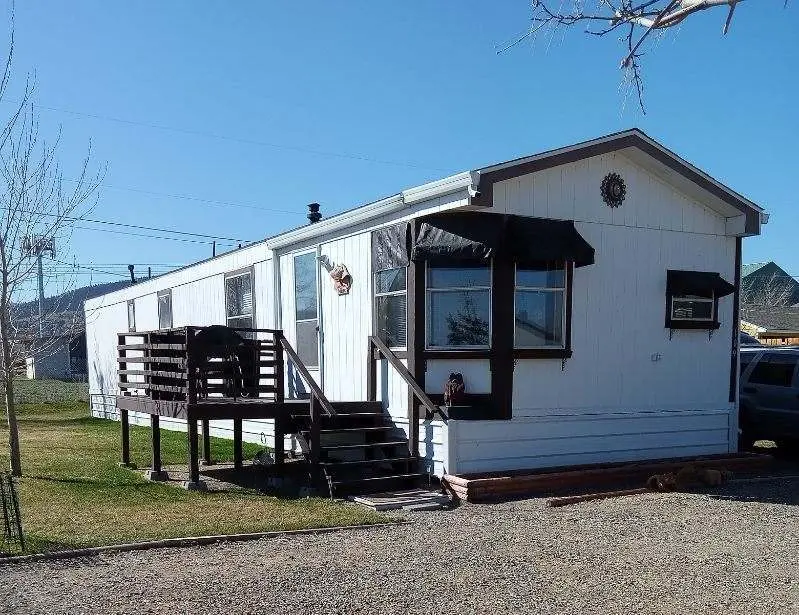
- Home design: Manufactured home (single wide); One level; Residential property, updated/remodeled
- Construction: Masonite exterior; Asphalt roof; Pillar/post/pier foundation
- Exterior features: Rain gutters; Deck; Chain link front-yard fencing; Level, landscaped front yard; Gravel road access
Interior
- Kitchen: Dishwasher; Microwave; Range; Refrigerator
- Bathrooms: 1 full bathroom
- Heating & cooling: Natural gas forced air heating
- Interior features: Dishwasher; Microwave; Range; Refrigerator; Updated/remodeled interior; No basement
Neighborhood map
What this means for you Summary
Snapshot
- This is a 2-bed/1.0-bath manufactured listed at $45k. Condition is rated fair.
Deal economics
- At list price, monthly cash flow is $943 ($11k/yr) — positive.
- The deal already cash-flows at list — no discount required.
- Meets the 1% rule at list price ($2k rent vs $45k).
- Recommended offer: $44k (3.0% below list) — sets the bar for market timing.
- Cap rate 31.4% vs local median 2.6% in Helena — top-decile yield for the area; either an underpriced asset or a hidden risk that comps aren't pricing in. Stress-test before assuming the spread holds.
Location & tenants
- Location reads 81/100 on livability (#6 in MT, #1,389 nationally) — a professional / high-income tenant draw. Strengths: amenities A+, commute A+, housing A+; Watch: crime F.
- Helena H S (town): math 34% / reading 54% proficiency, ranked #42 of 116 in MT (top 36%) — families likely to look elsewhere, expect single-tenant / working-renter base with shorter leases.
- Market conditions: 195 active listings in the ZIP; solid renter incomes; 456 units permitted in Lewis and Clark County in 2024 (207 in 5+ unit buildings).
Forward outlook
- Local home prices are declining (-3.0%/yr); year-one equity from $311 of loan paydown is wiped out by about $1k of value loss. Plan a longer hold.
- Lewis and Clark County population projected at +14% by 2050 — modest demand growth; plan on rents tracking national, not racing it.
- At projected returns (-3.0% appreciation + 3.0% rent growth), your $13k cash investment doubles in ~2 years — after that, you're playing with house money.
Negotiation context
- It's been on market 41 days — a 3% lower offer ($44k) is reasonable based on typical stale-listing flexibility.
Risks & watch-outs
- Climate carrying-cost: major wildfire risk — expect insurance premiums to compound above CPI over the hold.
Questions for the listing agent
- It's been on market 41 days. Have you received any prior offers? Is the seller open to a 3% concession, seller financing, or rate buy-down credit?
- Have any recent inspections been done? Can we get a copy of the seller's disclosures and any deferred-maintenance estimates?
- Is there a deadline driving the sale (1031 exchange, divorce, estate, relocation)? That informs how much negotiation room exists.
- Schools are B-rated — typically a magnet for longer-tenancy family renters. What's the average tenant stay here, and is there a school-zone premium baked into asking?
- Crime grade is F in this area — have there been break-ins, vandalism, or insurance claims at this property in the last 3 years? What carrier currently insures it and at what premium?
- What's the average days-on-market for RENTAL listings here right now (not sales)? A rising rental-DOM trend means longer vacancies and softer asking-rent achievability than the comps imply.
- What's the recent tenant-quality profile in this submarket — average credit score on applications, eviction rate, late-payment / NSF rate, and stable-employment percentage? A property-management company in the area should have these aggregated.
- How much new for-sale + rental construction is in the pipeline within 1–3 miles? Heavy new supply typically softens prices + rents 12–24 months out; constrained supply supports both.
Investment metrics
- 1% rule
- 3.53% ✓
- Cap rate
- 31.44%
- Cash-on-cash
- 89.82%
- DSCR
- 5.00
- GRM
- 2.4
CMA / ARV
No comps found within radius.
Projected returns pro-forma
-3.0% appreciation · 3.0% rent growth · sell at horizon
- IRR
- 90.5%
- Equity multiple
- 5.19×
- Total profit
- $52,802
- Equity at exit
- $6,710
- IRR
- 93.4%
- Equity multiple
- 10.80×
- Total profit
- $123,426
- Equity at exit
- $3,891
Cash invested: $12,600 (down + closing). Projections, not guarantees.
Landlord ↔ Tenant lean methodology
- Overall (STATE)
- 82 Strongly Landlord-Friendly
- State Montana
- 82 Strongly Landlord-Friendly · R+11
- County
- — inherits STATE
- City
- — inherits STATE
ZIP-level market 59602
- Active inventory
- 195
- Price-to-rent
- 2.4×
Monthly cashflow live
- Estimated rent
- $1,588 medium interval (Pro) →
- Mortgage (P&I)
- −$236
- Tax est. 1.5%
- −$56 /mo · $675/yr
- Insurance
- −$19
- HOA
- −$0
- Vacancy / Maint / Mgmt
- −$333
- Net cashflow
- $943
Break-even live
UW: 25.0% down · 7.5% · 30yr · 1.5% tax · 5.0% vac · 8.0% maint · 8.0% mgmt
Financing live
Cash to close
- Down payment
- $11,250
- Closing costs
- $1,350
- Reserves months
- —
- Total cash needed
- —
Loan-product check · same deal, 3 products live
Conventional
25% down · 7.5% · 30yr
- Down + closing
- —
- Monthly P&I
- —
- Monthly cashflow
- —
- DSCR
- —
- Eligible?
- —
Personal DTI + credit; lowest rate.
DSCR
20% down · 8.5% · 30yr
- Down + closing
- —
- Monthly P&I
- —
- Monthly cashflow
- —
- DSCR
- —
- Eligible?
- —
No personal income docs; deal must DSCR.
Hard money
10% down · 12.0% · 12mo
- Down + closing
- —
- Monthly P&I
- —
- Monthly cashflow
- —
- DSCR
- —
- Eligible?
- —
Short-term bridge; refi at stabilization.
Listing history 19 events
-
2026-06-19days on market $45,000 Active 41 DOM
-
2026-06-18days on market $45,000 Active 40 DOM
-
2026-06-17days on market $45,000 Active 39 DOM
-
2026-06-16days on market $45,000 Active 38 DOM
-
2026-06-15days on market $45,000 Active 37 DOM
-
2026-06-14days on market $45,000 Active 35 DOM
-
2026-06-13days on market $45,000 Active 34 DOM
-
2026-06-10days on market $45,000 Active 32 DOM
-
2026-06-09days on market $45,000 Active 31 DOM
-
2026-06-08days on market $45,000 Active 30 DOM
-
2026-06-07days on market $45,000 Active 29 DOM
-
2026-06-05days on market $45,000 Active 26 DOM
-
2026-06-03days on market $45,000 Active 25 DOM
-
2026-06-02days on market $45,000 Active 24 DOM
-
2026-06-01days on market $45,000 Active 23 DOM
-
2026-05-31days on market $45,000 Active 22 DOM
-
2026-05-30days on market $45,000 Active 21 DOM
-
2026-05-21price $45,000
-
2026-05-09$53,500 Active
ⓘ Source: listings_history table (triggers on properties + properties_extension) + one-shot
backfill from property_details.listing_events for pre-trigger history.
Climate risk First Street
- Flood 1/10 Low FEMA zone X (unshaded) · 0% chance over 30 yrs
- Wildfire 6/10 Major
- Heat 3/10 Moderate 7 d/yr ≥91°F today · 16 d/yr by 30 yrs out
- Wind 1/10 Low
- Air quality 7/10 Severe 9 unhealthy d/yr today · 20 by 30 yrs out
Nearby sold comps map
Loading sold comps map…
Walkable amenities ~0.75 mi
Loading nearby amenities…
Taxation est. · year 1
- Rental income
- $19,050
- − Mortgage interest
- −$2,521
- − Property taxes
- −$675
- − Insurance
- −$225
- − Repairs & maintenance
- −$1,524
- − Management
- −$1,524
- − Depreciation
- −$1,309
- Taxable income
- $11,272
- Est. tax owed @ 24.0%
- −$2,705
- After-tax cash flow
- $8,612/yr
For passive investors: Depreciation is non-cash, so a rental often shows a tax loss while cash-flowing — sheltering income. Rental losses are passive: they offset passive income freely, and up to $25,000/yr can offset ordinary (W-2) income if you actively participate and your MAGI is under $100k (phasing out to $0 by $150k); unused losses carry forward. On sale, claimed depreciation is recaptured at up to 25%, and gains may owe capital-gains tax (a 1031 exchange can defer both). Figures are a year-1 estimate at your 24.0% rate — not tax advice; consult a CPA.
Condition & rehab AI · 11 photos
This manufactured home requires significant repairs and maintenance to improve its condition and increase its value.
Repairs flagged
- Major exterior siding — Significant wear and tear
- Major interior walls — Worn wallpaper and paint
- Major flooring — Worn carpet and flooring
- Major landscaping — Overgrown lawn and lack of landscaping
Value-add opportunities
- Both Paint interior walls — Enhances curb appeal and interior aesthetics
- Both Replace carpet and flooring — Improves comfort and reduces maintenance
- Both Landscaping and yard work — Enhances curb appeal and property value
Renovation cost estimate screening
| Repair item | Severity | Est. cost |
|---|---|---|
| exterior siding · Significant wear and tear | Major | $15,000–50,000 |
| interior walls · Worn wallpaper and paint | Major | $15,000–50,000 |
| flooring · Worn carpet and flooring | Major | $15,000–50,000 |
| landscaping · Overgrown lawn and lack of landscaping | Major | $15,000–50,000 |
| Total estimated repair cost · 4 items | $60,000–200,000 |
Value-add ROI direction
- Both Paint interior walls — Enhances curb appeal and interior aesthetics ↑
- Both Replace carpet and flooring — Improves comfort and reduces maintenance ↑
- Both Landscaping and yard work — Enhances curb appeal and property value ↑
ⓘ Cost ranges are severity-bucket heuristics (US national rule-of-thumb). Get contractor quotes + a written scope before underwriting a rehab budget.
Schools (NCES district)
- District
- Helena H S
- NCES district ID
- 3013830
- Math proficiency
- 34% ▼ -6.00%
- Reading proficiency
- 54% ▼ -3.00%
- Median HH income
- $55,565
- Composite
- 38.26/100
- National rank
- #4238
- State rank
- #42 of 116 in MT
Livability — Helena
- Score
- 81/100
- State rank
- #6
- US rank
- #1389
Category grades
Schools grade is shown separately in the Schools card above.
Census & demographics
- Census place
- Helena, MT
- County
- Lewis and Clark County · 62,482 people
- City population
- 62,482
- Metro
- Helena, MT
- Population (ZIP)
- 30,754
- Household income
- $92,985
- Rent vs Own
- Severe rent burden
- 105.0
Population outlook (Lewis and Clark County) Hauer SSP2
- Today (2025)
- 72,720 people
- By 2030
- 75,403 · +3.7%
- By 2040
- 79,496 · +9.3%
- By 2050
- 82,741 · +13.8%
- By 2075
- 90,296 · +24.2%
- By 2100
- 93,425 · +28.5%
Race, ethnicity, and origin ACS 2023
- Neighborhood character
- Predominantly White (89%)
- Race & ethnicity
- White 89% Two or more races 6% Hispanic / Latino 4%
- Common ancestry
- Portuguese 6% Lithuanian 3% Italian 3%
- Foreign-born
- 2% · Canada
- Languages at home
- 97% English-only · Spanish 1% German/W. Germanic 1%
Political lean MEDSL · Lewis and Clark
- 2024 margin
- Lean R (+5.7) · D 45.4% · R 51.1% · Other 3.5%
- 2008→2024 swing
- -12.2pp toward R · 2008: 6.5pp · 2024: -5.7pp
- All cycles
- 2024: R+5.7 2020: R+3.9 2016: R+6.9 2012: R+3.6 2008: D+6.5
Not yet ingested
- Civics
- —
Market trends
- HPI YoY
- ▼ -178.02%
- Current HPI
- 243.543
- Rent YoY
- —
- Metro
- Helena, MT
- State GDP YoY
- ▲ 3.41%
- F500 in state
- 2
Industry mix (Fortune 500 HQ in MT)
| Industry | F500 HQs | Revenue |
|---|---|---|
| Technology / Analytics | 1 | $2B |
|
||
Price history
-15.9% since first listed2 events — show timeline
- 2026-05-21 Price Changed $45,000 MRMLS
- 2026-05-09 Listed $53,500 MRMLS
Cash-flow waterfall
monthlySold comps — $/sqft
last 12 mo · ≤1 miLoading sold comps…