3856 Hertland Dr · Kettering, OH
Flood risk 1/10 · Minimal
- FEMA flood zone
- X (unshaded)
- Chance of flooding over 30 yrs
- 0.0%
- Est. flood insurance / yr
- $507 – $1,088
Fire risk 1/10 · Minimal
- Est. fire insurance / yr
- $713 – $1,323
Heat risk 4/10 · Minor
- Hot days now (above 101°F)
- 7 days/yr
- Hot days in 30 yrs
- 19 days/yr
Wind risk 2/10 · Minimal
- Chance of severe wind over 30 yrs
- 0.0%
Air-quality risk 3/10 · Minor
- Unhealthy air days now
- 3 days/yr
- Unhealthy air days in 30 yrs
- 5 days/yr
Risk factors via First Street. Map © Google.
Why this score? — see what drove the D+ grade
The composite is a weighted blend of 9 inputs, each scored 0–100. Each bar is that input's sub-score; the figure is the points it added to the 100-point composite (weight × sub-score).
- Cash flow +12.8/30.0
- ARV discount +10.4/15.0
- Schools +5.2/10.0
- Livability +4.2/5.0
- 1% rule +3.9/10.0
- DSCR +3.8/10.0
- Rent growth +2.5/5.0
- Condition / age +2.5/5.0
- Appreciation +0.0/10.0
$175,000
🖨 Deal sheet (PDF) 📄 Offer letter ✓ Due diligence
Listing remarks
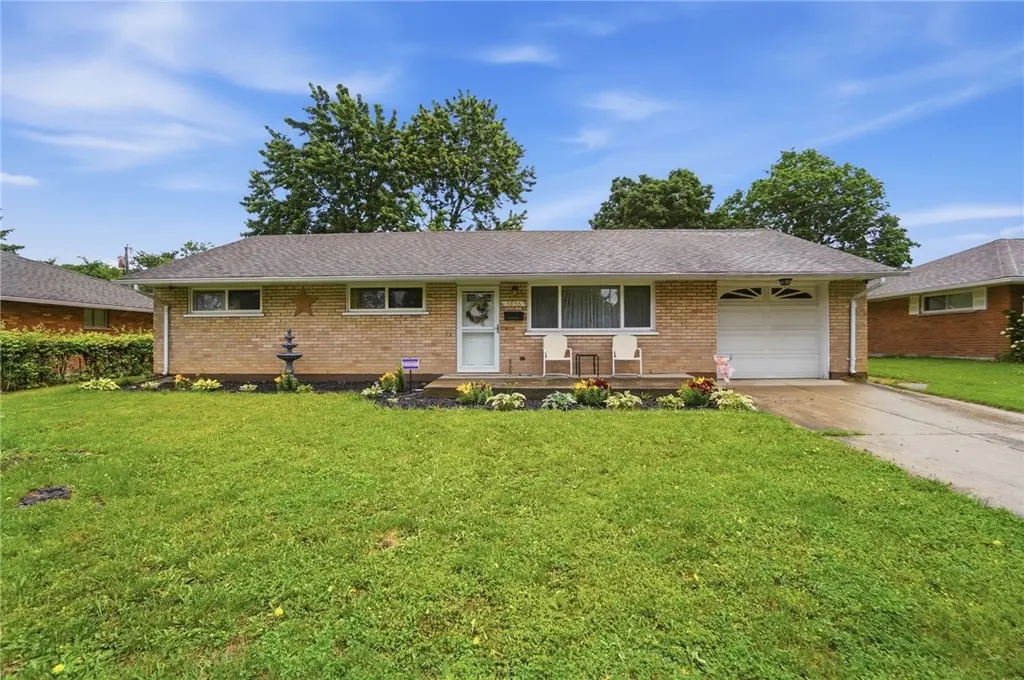
Welcome home to this charming 1,040 sq. ft. ranch in the heart of Kettering! This well-maintained home features a spacious living area with a cozy fireplace, perfect for relaxing or entertaining year-round. Step outside to enjoy the covered back porch overlooking the fully fenced backyard — ideal for pets, gatherings, or quiet evenings outdoors. Need extra storage or workspace? The oversized storage shed with a garage door offers endless possibilities for tools, hobbies, or outdoor equipment. Conveniently located near shopping, dining, and parks, this home combines comfort, functionality, and value all in one! * Room sizes approximate.
Key facts
- Covered back porch
- 7,841 sq ft lot
- Garage
Tags
Property features AI
Finance
- Financial info: Offered for sale
Exterior
- Parking: One-car garage
- Utilities: Natural gas available
- Home design: Single-story home
- Construction: Brick construction; Slab foundation
- Exterior features: Residential zoning
Interior
- Kitchen: Kitchen on main level (10 x 9)
- Bedrooms: Two bedrooms on main level (9 x 9 and 10 x 10)
- Bathrooms: One full bathroom on main level
- Heating & cooling: Natural gas heating; Central air conditioning
- Interior features: Total of 4 rooms; Living room on main level (30 x 15)
Neighborhood map
What this means for you Summary
Snapshot
- This is a 3-bed/1.0-bath single-family listed at $175k.
Deal economics
- At list price, monthly cash flow is $-17 ($-200/yr) — negative.
- To cash-flow at today's rent, offer at most $172k (1.7% below list).
- To meet the 1% rule (rent ≥ 1% of price), the offer needs to be $155k (11.4% below list).
- Recommended offer: $155k (11.4% below list) — sets the bar for 1% rule.
- Cap rate 6.2% vs local median 4.4% in Kettering — top-decile yield for the area; either an underpriced asset or a hidden risk that comps aren't pricing in. Stress-test before assuming the spread holds.
Location & tenants
- Location reads 83/100 on livability (#61 in OH, #922 nationally) — a professional / high-income tenant draw. Strengths: crime A+, cost of living A+, housing A+; Watch: commute F.
- Kettering City School District (suburban): math 54% / reading 68% proficiency, ranked #277 of 656 in OH (top 42%) — acceptable for families but not a draw, mixed tenant base, ~2y average lease.
- Zoned schools: Kettering Fairmont High School (math 49% / reading 75%, grade B-, #202 of 781 statewide, top 29%, 2,486 students, 32% FRL) — zoned schools at 32% FRL track the district average.
- Market conditions: 38 active listings in the ZIP; 13 comparable units currently listed for rent nearby; rentals at typical pace (median 21d on market — plan ~3-4 weeks tenant-placement turnaround); 907 units permitted in Montgomery County in 2024 (416 in 5+ unit buildings).
- This rent runs 36% of the median local income ($52k/yr) — at the standard rent-burdened threshold; future hikes will face affordability resistance.
Forward outlook
- Local home prices are declining (-3.0%/yr); year-one equity from $1k of loan paydown is wiped out by about $5k of value loss. Plan a longer hold.
- Montgomery County population projected at -10% by 2050 — secular population decline; favor cash flow + early exit over multi-decade hold.
Negotiation context
- Only 1 days on market — expect competitive offers; lowballing is unlikely to land.
- Current owner paid $111k; list at $175k implies a 58% gain — meaningful room to come down on a strong offer.
Risks & watch-outs
- Watch-outs: built in 1955 — expect roof / HVAC / electrical / plumbing capex.
Questions for the listing agent
- What do current leases actually rent for vs. the listed asking? Can we see a recent rent roll and the last 12 months of T-12 income?
- Built in 1955 — when were the roof, HVAC, electrical panel, plumbing, and water heater last replaced?
- Is there a deadline driving the sale (1031 exchange, divorce, estate, relocation)? That informs how much negotiation room exists.
- Schools are A-rated — typically a magnet for longer-tenancy family renters. What's the average tenant stay here, and is there a school-zone premium baked into asking?
- The area grade is low — what's the realistic commute time and amenity access for the typical tenant pool here? Any planned neighborhood developments (good or bad) we should know about?
- What's the average days-on-market for RENTAL listings here right now (not sales)? A rising rental-DOM trend means longer vacancies and softer asking-rent achievability than the comps imply.
- What's the recent tenant-quality profile in this submarket — average credit score on applications, eviction rate, late-payment / NSF rate, and stable-employment percentage? A property-management company in the area should have these aggregated.
- How much new for-sale + rental construction is in the pipeline within 1–3 miles? Heavy new supply typically softens prices + rents 12–24 months out; constrained supply supports both.
Investment metrics
- 1% rule
- 0.89% ✗
- Cap rate
- 6.18%
- Cash-on-cash
- -0.41%
- DSCR
- 0.98
- GRM
- 9.4
CMA / ARV
- ARV (on-the-fly)
- $187,200
- Comps found
- 12
Show comp detail 12 sales within ~0.75 mi
| Address | Dist | Beds/Ba | Sqft | Sold | Price | $/sf | Match |
|---|---|---|---|---|---|---|---|
| 1681 Hillwood Dr | 0.15mi | 3/1.0 | 1,040 (0%) | 2mo | $205,000 | $197 | 91 |
| 3690 Endover Rd | 0.18mi | 3/1.0 | 1,040 (0%) | 1mo | $180,000 | $173 | 91 |
| 3785 Endover Rd | 0.20mi | 3/1.0 | 1,040 (0%) | 0mo | $187,500 | $180 | 90 |
| 3890 Endover Rd | 0.22mi | 3/1.0 | 1,040 (0%) | 2mo | $180,000 | $173 | 89 |
| 1770 Big Hill Rd | 0.36mi | 3/1.0 | 1,040 (0%) | 1mo | $200,000 | $192 | 83 |
| 3913 Elmira Dr | 0.35mi | 3/1.0 | 1,040 (0%) | 2mo | $212,900 | $205 | 82 |
| 3743 Cordell Dr | 0.15mi | 2/1.0 (-1) | 936 (-10%) | 1mo | $155,000 | $166 | 70 |
| 2169 Finland Dr | 0.50mi | 3/1.0 | 1,080 (+4%) | 1mo | $213,000 | $197 | 70 |
| 3565 Lodi Pl | 0.30mi | 3/1.0 | 936 (-10%) | 0mo | $197,000 | $210 | 69 |
| 2218 Finland Dr | 0.55mi | 3/1.0 | 1,080 (+4%) | 2mo | $189,000 | $175 | 67 |
| 2190 Renshaw Ave | 0.69mi | 3/1.0 | 1,080 (+4%) | 1mo | $194,080 | $180 | 61 |
| 4476 Hannaford St | 0.71mi | 3/1.0 | 1,080 (+4%) | 1mo | $190,000 | $176 | 60 |
Match score weights: distance 35% · size 25% · config 20% · recency 20%. Top-matched comps best support the ARV.
Projected returns pro-forma
-3.0% appreciation · 3.0% rent growth · sell at horizon
- IRR
- -16.9%
- Equity multiple
- 0.40×
- Total profit
- $-29,377
- Equity at exit
- $26,093
- IRR
- -8.8%
- Equity multiple
- 0.45×
- Total profit
- $-26,774
- Equity at exit
- $15,131
Cash invested: $49,000 (down + closing). Projections, not guarantees.
Landlord ↔ Tenant lean methodology
- Overall (STATE)
- 73 Landlord-Friendly
- State Ohio
- 73 Landlord-Friendly · R+6
- County
- — inherits STATE
- City
- — inherits STATE
ZIP-level market 45439
- Home prices YoY
- -34.5%
- Active inventory
- 38
- Price-to-rent
- 9.4×
Monthly cashflow live
- Estimated rent
- $1,550 high interval (Pro) →
- Mortgage (P&I)
- −$918
- Tax from tax record
- −$251 /mo · $3,008/yr
- Insurance
- −$73
- HOA
- −$0
- Vacancy / Maint / Mgmt
- −$326
- Net cashflow
- $-17
Break-even live
Sensitivity live
| Price | -10% $82 | -5% $33 | +0% $-17 | +5% $-66 | +10% $-116 |
|---|---|---|---|---|---|
| Rent | -10% $-139 | -5% $-78 | +0% $-17 | +5% $45 | +10% $106 |
| Rate | -1.0pp $71 | -0.5pp $28 | base $-17 | +0.5pp $-62 | +1.0pp $-108 |
UW: 25.0% down · 7.5% · 30yr · 1.5% tax · 5.0% vac · 8.0% maint · 8.0% mgmt
Financing live
Cash to close
- Down payment
- $43,750
- Closing costs
- $5,250
- Reserves months
- —
- Total cash needed
- —
Loan-product check · same deal, 3 products live
Conventional
25% down · 7.5% · 30yr
- Down + closing
- —
- Monthly P&I
- —
- Monthly cashflow
- —
- DSCR
- —
- Eligible?
- —
Personal DTI + credit; lowest rate.
DSCR
20% down · 8.5% · 30yr
- Down + closing
- —
- Monthly P&I
- —
- Monthly cashflow
- —
- DSCR
- —
- Eligible?
- —
No personal income docs; deal must DSCR.
Hard money
10% down · 12.0% · 12mo
- Down + closing
- —
- Monthly P&I
- —
- Monthly cashflow
- —
- DSCR
- —
- Eligible?
- —
Short-term bridge; refi at stabilization.
Rent comps 13 comps
| Address | Beds | Baths | Sqft | Rent | $/sqft | DOM | Units | Dist |
|---|---|---|---|---|---|---|---|---|
| 1643 Archdeacon Ct Dayton, OH | 2.0 | 1.0 | 1040 | $1,450 | $1.39 | 23d | 1 | 0.07mi |
| 3781 Keswick Ln Dayton, OH | 3.0 | 1.0 | 1040 | $1,750 | $1.68 | 4d | 1 | 0.09mi |
| 3657 Elmira Dr Dayton, OH | 2.0 | 1.0 | 936 | $1,450 | $1.55 | 45d | 1 | 0.25mi |
| 3928 Elmira Dr Dayton, OH | 3.0 | 1.0 | 1041 | $1,550 | $1.49 | 4d | 1 | 0.35mi |
| 3401 Southdale Dr #5 Dayton, OH | 2.0 | 2.0 | 1400 | $1,450 | $1.04 | 23d | 1 | 0.45mi |
| 3924 Fulton Ave Moraine, OH | 3.0 | 1.0 | 813 | $1,800 | $2.21 | 4d | 1 | 0.54mi |
| 3929 Fulton Ave Moraine, OH | 2.0 | 1.0 | 788 | $750 | $0.95 | 21d | 1 | 0.57mi |
| 4042 Ellery Ave Moraine, OH | 3.0 | 1.0 | 720 | $1,195 | $1.66 | 45d | 1 | 0.62mi |
| 4217 Fulton Ave Moraine, OH | 2.0 | 1.0 | 800 | $1,325 | $1.66 | 45d | 1 | 0.83mi |
| 2621 Nyack Ln Dayton, OH | 3.0 | 1.0 | 1080 | $1,500 | $1.39 | 16d | 1 | 1.05mi |
| 1333 Central Park Ave Dayton, OH | 2.0 | 1.0 | 846 | $1,350 | $1.60 | 16d | 1 | 1.08mi |
| 5237 Belle Isle Dr Unit 5237 Dayton, OH | 2.0 | 1.0 | 960 | $1,025 | $1.07 | 45d | 1 | 1.47mi |
| 2800 Cadillac St Moraine, OH | 3.0 | 1.0 | 748 | $1,295 | $1.73 | 4d | 1 | 1.50mi |
Listing history 4 events
-
2026-05-31status $175,000 Pending 1 DOM
-
2026-05-28$175,000 Active
-
2023-02-06soldstatus $111,000
-
1996-10-01soldstatus $79,900
ⓘ Source: listings_history table (triggers on properties + properties_extension) + one-shot
backfill from property_details.listing_events for pre-trigger history.
Tax reassessment forecast OH · Partial reset (capped growth)
- Current annual tax
- $3,008 · $251/mo
- Projected year-2 tax
- $3,008 · $251/mo
- Expected delta
- $0/yr ($0/mo · 0.0%)
ⓘ Screening estimate from a state-policy table — verify with the county assessor before closing.
Climate risk First Street
- Flood 1/10 Low FEMA zone X (unshaded) · 0% chance over 30 yrs
- Wildfire 1/10 Low
- Heat 4/10 Moderate 7 d/yr ≥101°F today · 19 d/yr by 30 yrs out
- Wind 2/10 Low 0% chance of damaging wind over 30 yrs
- Air quality 3/10 Moderate 3 unhealthy d/yr today · 5 by 30 yrs out
Nearby sold comps map
Loading sold comps map…
Walkable amenities ~0.75 mi
Loading nearby amenities…
Taxation est. · year 1
- Rental income
- $18,602
- − Mortgage interest
- −$9,803
- − Property taxes
- −$3,008
- − Insurance
- −$875
- − Repairs & maintenance
- −$1,488
- − Management
- −$1,488
- − Depreciation
- −$5,091
- Taxable loss
- −$3,151
- Est. tax savings @ 24.0%
- +$756
- After-tax cash flow
- $556/yr
For passive investors: Depreciation is non-cash, so a rental often shows a tax loss while cash-flowing — sheltering income. Rental losses are passive: they offset passive income freely, and up to $25,000/yr can offset ordinary (W-2) income if you actively participate and your MAGI is under $100k (phasing out to $0 by $150k); unused losses carry forward. On sale, claimed depreciation is recaptured at up to 25%, and gains may owe capital-gains tax (a 1031 exchange can defer both). Figures are a year-1 estimate at your 24.0% rate — not tax advice; consult a CPA.
Schools (NCES district)
- District
- Kettering City School District
- NCES district ID
- 3904418
- Math proficiency
- 54% ▼ -21.00%
- Reading proficiency
- 68% ▼ -9.00%
- Median HH income
- $50,353
- Composite
- 51.89/100
- National rank
- #1653
- State rank
- #277 of 656 in OH
Livability — Kettering
- Score
- 83/100
- State rank
- #61
- US rank
- #922
Category grades
Schools grade is shown separately in the Schools card above.
Census & demographics
- Census place
- Kettering, OH
- County
- Montgomery County · 459,541 people
- City population
- 73,116
- Metro
- Dayton-Kettering, OH
- Population (ZIP)
- 11,914
- Household income
- $52,035
- Rent vs Own
- Severe rent burden
- 381.0
Population outlook (Montgomery County) Hauer SSP2
- Today (2025)
- 523,241 people
- By 2030
- 514,948 · -1.6%
- By 2040
- 493,378 · -5.7%
- By 2050
- 469,639 · -10.2%
- By 2075
- 418,360 · -20.0%
- By 2100
- 353,315 · -32.5%
Race, ethnicity, and origin ACS 2023
- Neighborhood character
- Predominantly White (71%)
- Race & ethnicity
- White 71% Black 15% Two or more races 10% Hispanic / Latino 9% Asian 2%
- Hispanic origin (detail)
- Mexican 3% Puerto Rican 1%
- Common ancestry
- Italian 2% Iranian 1% Slovak 1%
- Foreign-born
- 4% · Canada, China, Vietnam
- Languages at home
- 93% English-only · Spanish 5% Chinese 1%
Political lean MEDSL · Montgomery
- 2024 margin
- Toss-up / Even · D 49.8% · R 49.3%
- 2008→2024 swing
- -5.8pp toward R · 2008: 6.2pp · 2024: 0.5pp
- All cycles
- 2024: D+0.5 2020: D+2.2 2016: R+1.2 2012: D+3.1 2008: D+6.2
Not yet ingested
- Civics
- —
Market trends
- HPI YoY
- ▼ -151.06%
- Current HPI
- 287.2064
- Rent YoY
- —
- Metro
- Dayton-Kettering, OH
- State GDP YoY
- ▲ 1.98%
- F500 in state
- 48
Industry mix (Fortune 500 HQ in OH)
| Industry | F500 HQs | Revenue |
|---|---|---|
| Insurance | 3 | $145B |
|
||
| Industrial Machinery | 3 | $49B |
|
||
| Financial Services | 3 | $24B |
|
||
| Consumer Goods | 2 | $93B |
|
||
| Aerospace / Defense | 2 | $47B |
|
||
| Utilities | 2 | $33B |
|
||
Price history
+119.0% since first listed3 events — show timeline
- 2026-05-28 Listed $175,000 Dayton MLS
- 2023-02-06 Sold (Public Records) $111,000 Public Records
- 1996-10-01 Sold (Public Records) $79,900 Public Records
Property tax history
+5.6%/yrLatest (2025): $3,008 · -0.2% YoY. Source: county tax records.
Cash-flow waterfall
monthlySold comps — $/sqft
last 12 mo · ≤1 miLoading sold comps…