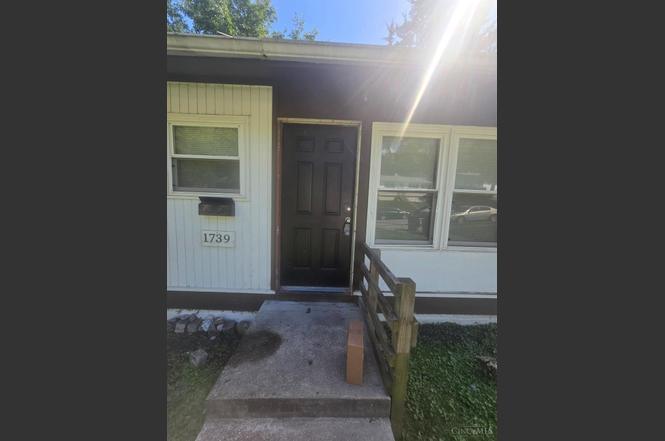
1739 Monterey Ct · Cincinnati, OH
Flood risk 1/10 · Minimal
- FEMA flood zone
- X (unshaded)
- Chance of flooding over 30 yrs
- 0.0%
- Est. flood insurance / yr
- $507 – $1,088
Fire risk 1/10 · Minimal
- Est. fire insurance / yr
- $713 – $1,323
Heat risk 4/10 · Minor
- Hot days now (above 103°F)
- 7 days/yr
- Hot days in 30 yrs
- 20 days/yr
Wind risk 2/10 · Minimal
- Chance of severe wind over 30 yrs
- 1.0%
Air-quality risk 3/10 · Minor
- Unhealthy air days now
- 2 days/yr
- Unhealthy air days in 30 yrs
- 3 days/yr
Risk factors via First Street. Map © Google.
Why this score? — see what drove the C grade
The composite is a weighted blend of 9 inputs, each scored 0–100. Each bar is that input's sub-score; the figure is the points it added to the 100-point composite (weight × sub-score).
- Cash flow +18.9/30.0
- ARV discount +15.0/15.0
- DSCR +6.0/10.0
- 1% rule +5.0/10.0
- Rent growth +5.0/5.0
- Livability +4.0/5.0
- Schools +2.5/10.0
- Condition / age +2.5/5.0
- Appreciation +0.0/10.0
$139,900
🖨 Deal sheet 📄 Offer letter ✓ Due diligence
Listing remarks MLS
Ranch home in Northside! Great starter home or investment opportunity. Currently set up as 2 bedrooms but can easily be converted back to 3 bedrooms. Needs some TLC. Sold as is. Priced to sell. Close to highways, downtown, University and Hospital.
Key facts
- 6,273 sq ft lot
- Built 1955
Property features AI
Finance
- Other: Lease not considered
- HOA & community: No homeowners association
Exterior
- Parking: Off-street parking; Driveway
- Utilities: Public water; Public sewer; Natural gas
- Home design: Traditional single-family home; One story; Slab foundation
- Construction: Aluminum siding; Vinyl siding; Shingle roof; Slab foundation
- Exterior features: Shingle roof; Vinyl windows; Aluminum and vinyl siding; Residential zoning; Lot roughly 52 x 120 (0.144 acres)
Interior
- Kitchen: 13 x 11 kitchen; Oven/Range; Refrigerator
- Bedrooms: Three bedrooms, all on the main level
- Bathrooms: One full bathroom on the main level
- Heating & cooling: Forced air heating (gas); Window air conditioning units; Gas water heater
- Interior features: Five total rooms; Crawl basement
Neighborhood map
What this means for you Summary
Snapshot
- This is a 3-bed/1.0-bath single-family listed at $140k.
Deal economics
- At list price, monthly cash flow is $144 ($2k/yr) — positive.
- The deal already cash-flows at list — no discount required.
- To meet the 1% rule (rent ≥ 1% of price), the offer needs to be $139k (0.5% below list).
- Recommended offer: $139k (0.5% below list) — sets the bar for 1% rule.
- Cap rate 7.5% vs local median 3.9% in Cincinnati — top-decile yield for the area; either an underpriced asset or a hidden risk that comps aren't pricing in. Stress-test before assuming the spread holds.
Location & tenants
- Location reads 80/100 on livability (#130 in OH, #1,856 nationally) — a professional / high-income tenant draw. Strengths: amenities A+, commute A+, cost of living A+; Watch: employment D, crime F.
- Cincinnati Public Schools (urban): math 25% / reading 36% proficiency, ranked #581 of 656 in OH (top 89%) — families likely to look elsewhere, expect single-tenant / working-renter base with shorter leases; 70% free/reduced lunch — lower-income household profile, screen leases tightly.
- Market conditions: Rents rising fast (+16.7%/yr); 46 active listings in the ZIP; 26 comparable units currently listed for rent nearby; rentals at typical pace (median 17d on market — plan ~3-4 weeks tenant-placement turnaround); 801 units permitted in Hamilton County in 2024 (190 in 5+ unit buildings).
- This rent runs 34% of the median local income ($49k/yr) — at the standard rent-burdened threshold; future hikes will face affordability resistance.
Forward outlook
- Local home prices are declining (-3.0%/yr); year-one equity from $967 of loan paydown is wiped out by about $4k of value loss. Plan a longer hold.
- At projected returns (-3.0% appreciation + 8.0% rent growth), your $39k cash investment doubles in ~10 years — after that, you're playing with house money.
Negotiation context
- Only 1 days on market — expect competitive offers; lowballing is unlikely to land.
- 2 sale attempts since 4y ago with the ask held roughly flat each time — persistent listings suggest the price (not the market) is what's stuck; bring a comps-based counter.
- Current owner paid $88k; list at $140k implies a 59% gain — meaningful room to come down on a strong offer.
Risks & watch-outs
- Watch-outs: built in 1955 — expect roof / HVAC / electrical / plumbing capex.
Questions for the listing agent
- Built in 1955 — when were the roof, HVAC, electrical panel, plumbing, and water heater last replaced?
- Is there a deadline driving the sale (1031 exchange, divorce, estate, relocation)? That informs how much negotiation room exists.
- Schools are B-rated — typically a magnet for longer-tenancy family renters. What's the average tenant stay here, and is there a school-zone premium baked into asking?
- Crime grade is F in this area — have there been break-ins, vandalism, or insurance claims at this property in the last 3 years? What carrier currently insures it and at what premium?
- What's the average days-on-market for RENTAL listings here right now (not sales)? A rising rental-DOM trend means longer vacancies and softer asking-rent achievability than the comps imply.
- What's the recent tenant-quality profile in this submarket — average credit score on applications, eviction rate, late-payment / NSF rate, and stable-employment percentage? A property-management company in the area should have these aggregated.
- How much new for-sale + rental construction is in the pipeline within 1–3 miles? Heavy new supply typically softens prices + rents 12–24 months out; constrained supply supports both.
Investment metrics
- 1% rule
- 1.00% ✗
- Cap rate
- 7.53%
- Cash-on-cash
- 4.41%
- DSCR
- 1.20
- GRM
- 8.4
CMA / ARV
- ARV (on-the-fly)
- $176,675
- Comps found
- 12
Show comp detail 12 sales within ~0.75 mi
| Address | Dist | Beds/Ba | Sqft | Sold | Price | $/sf | Match |
|---|---|---|---|---|---|---|---|
| 4650 Kirby Ave | 0.07mi | 3/1.0 | 875 (-5%) | 6mo | $176,000 | $201 | 83 |
| 4688 Kirby Ave | 0.06mi | 3/1.0 | 875 (-5%) | 8mo | $157,000 | $179 | 81 |
| 2637 Firtree Ct | 0.17mi | 2/1.0 (-1) | 875 (-5%) | 2mo | $120,000 | $137 | 77 |
| 2706 Firtree Ct | 0.19mi | 3/1.0 | 875 (-5%) | 6mo | $162,000 | $185 | 77 |
| 4676 Kirby Ave | 0.03mi | 3/1.0 | 875 (-5%) | 15mo | $92,500 | $106 | 77 |
| 4704 Kirby Ave | 0.13mi | 3/1.0 | 875 (-5%) | 15mo | $167,000 | $191 | 73 |
| 4682 Kirby Ave | 0.04mi | 3/2.0 | 875 (-5%) | 15mo | $215,000 | $246 | 72 |
| 4692 Kirby Ave | 0.08mi | 3/1.0 | 875 (-5%) | 19mo | $167,275 | $191 | 71 |
| 4575 Innes Ave | 0.31mi | 2/1.0 (-1) | 960 (+4%) | 6mo | $237,500 | $247 | 69 |
| 1561 Spring Lawn Ave | 0.41mi | 2/1.0 (-1) | 966 (+4%) | 6mo | $225,000 | $233 | 63 |
| 1971 Kentucky Ave | 0.57mi | 3/1.0 | 998 (+8%) | 6mo | $45,000 | $45 | 55 |
| 1493 Spring Lawn Ave | 0.58mi | 3/1.0 | 1,056 (+14%) | 3mo | $198,500 | $188 | 47 |
Match score weights: distance 35% · size 25% · config 20% · recency 20%. Top-matched comps best support the ARV.
Projected returns pro-forma
-3.0% appreciation · 8.0% rent growth · sell at horizon
- IRR
- -4.0%
- Equity multiple
- 0.84×
- Total profit
- $-6,127
- Equity at exit
- $20,860
- IRR
- 10.7%
- Equity multiple
- 2.02×
- Total profit
- $40,017
- Equity at exit
- $12,096
Cash invested: $39,172 (down + closing). Projections, not guarantees.
Landlord ↔ Tenant lean methodology
- Overall (STATE)
- 73 Landlord-Friendly
- State Ohio
- 73 Landlord-Friendly · R+6
- County
- — inherits STATE
- City
- — inherits STATE
ZIP-level market 45223
- Rents YoY
- 16.7%
- Active inventory
- 46
- Price-to-rent
- 8.4×
Monthly cashflow live
- Estimated rent
- $1,392 high interval (Pro) →
- Mortgage (P&I)
- −$734
- Tax from tax record
- −$164 /mo · $1,965/yr
- Insurance
- −$58
- HOA
- −$0
- Vacancy / Maint / Mgmt
- −$292
- Net cashflow
- $144
Break-even live
UW: 25.0% down · 7.5% · 30yr · 1.5% tax · 5.0% vac · 8.0% maint · 8.0% mgmt
Financing live
Cash to close
- Down payment
- $34,975
- Closing costs
- $4,197
- Reserves months
- —
- Total cash needed
- —
Loan-product check · same deal, 3 products live
Conventional
25% down · 7.5% · 30yr
- Down + closing
- —
- Monthly P&I
- —
- Monthly cashflow
- —
- DSCR
- —
- Eligible?
- —
Personal DTI + credit; lowest rate.
DSCR
20% down · 8.5% · 30yr
- Down + closing
- —
- Monthly P&I
- —
- Monthly cashflow
- —
- DSCR
- —
- Eligible?
- —
No personal income docs; deal must DSCR.
Hard money
10% down · 12.0% · 12mo
- Down + closing
- —
- Monthly P&I
- —
- Monthly cashflow
- —
- DSCR
- —
- Eligible?
- —
Short-term bridge; refi at stabilization.
Rent comps 26 comps
| Address | Beds | Baths | Sqft | Rent | $/sqft | DOM | Units | Dist |
|---|---|---|---|---|---|---|---|---|
| 1759 Monterey Ct Cincinnati, OH | 3.0 | 1.0 | 920 | $1,750 | $1.90 | 4d | 1 | 0.05mi |
| 4652 Ashtree Dr Cincinnati, OH | 3.0 | 1.0 | 925 | $1,350 | $1.46 | 21d | 1 | 0.12mi |
| 1932-1978 Kentucky Ave Cincinnati, OH | 2.0 | 1.0 | 728 | $1,098 | $1.51 | 16d | 1 | 0.46mi |
| 1942 Kentucky Ave Unit 10 Cincinnati, OH | 2.0 | 1.0 | 728 | $1,098 | $1.51 | 3d | 1 | 0.47mi |
| 1942 Kentucky Ave Unit 8 Cincinnati, OH | 2.0 | 1.0 | 728 | $1,098 | $1.51 | 23d | 1 | 0.47mi |
| 1978 Kentucky Ave Unit 7 Cincinnati, OH | 2.0 | 1.0 | 728 | $1,098 | $1.51 | 23d | 1 | 0.49mi |
| 1974 Kentucky Ave Cincinnati, OH | 2.0 | 1.0 | 728 | $1,098 | $1.51 | 4d | 1 | 0.49mi |
| 1932 Kentucky Ave Cincinnati, OH | 1.0–2.0 | 1.0 | 668 | $1,098 | $1.64 | 2d | 4 | 0.52mi |
| 1948 Kentucky Ave Apt 2 Cincinnati, OH | 2.0 | 1.0 | 728 | $1,098 | $1.51 | 23d | 1 | 0.54mi |
| 1590 Glen Parker Ave Unit 8 Cincinnati, OH | 2.0 | 1.0 | 794 | $995 | $1.25 | 14d | 1 | 0.59mi |
| 1710 Bruce Ave Cincinnati, OH | 2.0 | 1.0 | 974 | $1,495 | $1.53 | 23d | 1 | 0.60mi |
| 2992 High Forest Ln Cincinnati, OH | 1.0–2.0 | 1.0–1.5 | 748 | $1,100 | $1.47 | 2d | 9 | 0.66mi |
| 4479 Colerain Ave Cincinnati, OH | 1.0–2.0 | 1.0 | 762 | $1,075 | $1.41 | 23d | 1 | 0.71mi |
| 4308 Hamilton Ave Unit 9 Cincinnati, OH | 2.0 | 1.0 | 650 | $925 | $1.42 | 23d | 1 | 0.82mi |
| 5101 Hawaiian Ter Apt 7 Cincinnati, OH | 2.0 | 1.0 | 850 | $1,150 | $1.35 | 2d | 1 | 0.93mi |
| 5219 Colerain Ave Cincinnati, OH | 2.0 | 1.0 | 1007 | $1,550 | $1.54 | 23d | 1 | 1.21mi |
| 1580 Blue Rock St Cincinnati, OH | 2.0 | 1.0–2.0 | 730 | $1,970 | $2.70 | 1d | 5 | 1.22mi |
| 4101 Spring Grove Ave Cincinnati, OH | 2.0 | 1.0–2.0 | 2586 | $2,130 | $0.82 | 1d | 8 | 1.24mi |
| 5674 Folchi Dr Unit 4-5674 Cincinnati, OH | 2.0 | 1.0 | 721 | $1,200 | $1.66 | 23d | 1 | 1.33mi |
| 5680 Folchi Dr Cincinnati, OH | 2.0 | 1.0 | 721 | $1,200 | $1.66 | 16d | 1 | 1.34mi |
| 5680 Folchi Dr Apt 4 Cincinnati, OH | 2.0 | 1.0 | 721 | $1,200 | $1.66 | 23d | 1 | 1.34mi |
| 1628 Linden Dr Unit 937 Cincinnati, OH | 2.0 | 1.0 | 950 | $1,163 | $1.22 | 23d | 1 | 1.38mi |
| 1905 Elmore St Cincinnati, OH | 3.0 | 1.0 | 925 | $1,560 | $1.69 | 13d | 3 | 1.40mi |
| 5469 Kirby Ave Cincinnati, OH | 1.0–2.0 | 1.0 | 720 | $1,095 | $1.52 | 3d | 33 | 1.44mi |
| 5465 Kirby Ave Unit 5465-21 Cincinnati, OH | 2.0 | 1.0 | 820 | $1,095 | $1.34 | 23d | 1 | 1.45mi |
| 5465 Kirby Ave Unit 5465-8 Cincinnati, OH | 2.0 | 1.0 | 820 | $1,095 | $1.34 | 10d | 1 | 1.45mi |
Listing history 2 events
-
2026-06-19remarks 367-char remark
-
2026-06-19$139,900 Active 1 DOM
ⓘ Source: listings_history table (triggers on properties + properties_extension) + one-shot
backfill from property_details.listing_events for pre-trigger history.
Tax reassessment forecast OH · Partial reset (capped growth)
- Current annual tax
- $1,965 · $164/mo
- Projected year-2 tax
- $2,074 · $173/mo
- Expected delta
- +$109/yr (+$9/mo · 5.5%)
ⓘ Screening estimate from a state-policy table — verify with the county assessor before closing.
Climate risk First Street
- Flood 1/10 Low FEMA zone X (unshaded) · 0% chance over 30 yrs
- Wildfire 1/10 Low
- Heat 4/10 Moderate 7 d/yr ≥103°F today · 20 d/yr by 30 yrs out
- Wind 2/10 Low 100% chance of damaging wind over 30 yrs
- Air quality 3/10 Moderate 2 unhealthy d/yr today · 3 by 30 yrs out
Nearby sold comps map
Loading sold comps map…
Walkable amenities ~0.75 mi
Loading nearby amenities…
Taxation est. · year 1
- Rental income
- $16,705
- − Mortgage interest
- −$7,837
- − Property taxes
- −$1,965
- − Insurance
- −$700
- − Repairs & maintenance
- −$1,336
- − Management
- −$1,336
- − Depreciation
- −$4,070
- Taxable loss
- −$539
- Est. tax savings @ 24.0%
- +$129
- After-tax cash flow
- $1,858/yr
For passive investors: Depreciation is non-cash, so a rental often shows a tax loss while cash-flowing — sheltering income. Rental losses are passive: they offset passive income freely, and up to $25,000/yr can offset ordinary (W-2) income if you actively participate and your MAGI is under $100k (phasing out to $0 by $150k); unused losses carry forward. On sale, claimed depreciation is recaptured at up to 25%, and gains may owe capital-gains tax (a 1031 exchange can defer both). Figures are a year-1 estimate at your 24.0% rate — not tax advice; consult a CPA.
Schools (NCES district)
- District
- Cincinnati Public Schools
- NCES district ID
- 3904375
- Math proficiency
- 25% ▼ -19.00%
- Reading proficiency
- 36% ▼ -14.00%
- Median HH income
- $35,743
- Composite
- 25.21/100
- National rank
- #7508
- State rank
- #581 of 656 in OH
Livability — Cincinnati
- Score
- 80/100
- State rank
- #130
- US rank
- #1856
Category grades
Schools grade is shown separately in the Schools card above.
Census & demographics
- Census place
- Cincinnati, OH
- County
- Hamilton County · 701,295 people
- City population
- 505,555
- Metro
- Cincinnati, OH-KY-IN
- Population (ZIP)
- 14,182
- Household income
- $49,312
- Rent vs Own
- Severe rent burden
- 943.0
Population outlook (Hamilton County) Hauer SSP2
- Today (2025)
- 826,054 people
- By 2030
- 830,947 · +0.6%
- By 2040
- 832,319 · +0.8%
- By 2050
- 822,428 · -0.4%
- By 2075
- 788,688 · -4.5%
- By 2100
- 710,674 · -14.0%
Race, ethnicity, and origin ACS 2023
- Neighborhood character
- Diverse neighborhood (Simpson 0.61)
- Race & ethnicity
- White 53% Black 33% Two or more races 11% Hispanic / Latino 6% Asian 1%
- Hispanic origin (detail)
- Common ancestry
- Slovak 3% Romanian 2% Italian 1%
- Foreign-born
- 6% · Canada, Guatemala
- Languages at home
- 93% English-only · Spanish 4% German/W. Germanic 1%
Political lean MEDSL · Hamilton
- 2024 margin
- D (+14.9) · D 57.0% · R 42.1%
- 2008→2024 swing
- +7.9pp toward D · 2008: 7.0pp · 2024: 14.9pp
- All cycles
- 2024: D+14.9 2020: D+15.9 2016: D+9.5 2012: D+4.9 2008: D+7.0
Not yet ingested
- Civics
- —
Market trends
- HPI YoY
- ▼ -171.27%
- Current HPI
- 239.5488
- Rent YoY
- ▲ 16.66%
- Metro
- Cincinnati, OH-KY-IN
- State GDP YoY
- ▲ 1.98%
- F500 in state
- 48
Industry mix (Fortune 500 HQ in OH)
| Industry | F500 HQs | Revenue |
|---|---|---|
| Insurance | 3 | $145B |
|
||
| Industrial Machinery | 3 | $49B |
|
||
| Financial Services | 3 | $24B |
|
||
| Consumer Goods | 2 | $93B |
|
||
| Aerospace / Defense | 2 | $47B |
|
||
| Utilities | 2 | $33B |
|
||
Price history
+64.6% since first listed4 events — show timeline
- 2026-06-18 Listed $139,900 Cincy MLS
- 2022-03-08 Sold (MLS) $88,001 Cincy MLS
- 2022-02-22 Contingent — Cincy MLS
- 2022-02-16 Listed $85,000 Cincy MLS
Property tax history
+5.5%/yrLatest (2025): $1,965 · +0.1% YoY. Source: county tax records.
Cash-flow waterfall
monthlySold comps — $/sqft
last 12 mo · ≤1 miLoading sold comps…