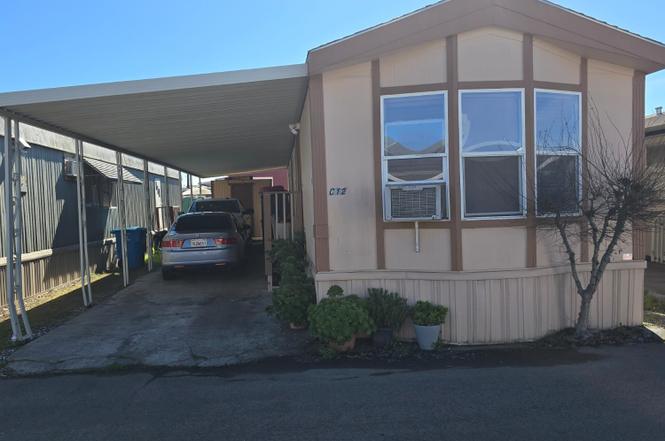
2963 Santa Rosa Ave Unit C-12 · Santa Rosa, CA
Flood risk 3/10 · Minor
- FEMA flood zone
- X (unshaded)
- Chance of flooding over 30 yrs
- 0.2%
- Est. flood insurance / yr
- $507 – $1,088
Fire risk 6/10 · Moderate
- Est. fire insurance / yr
- $659 – $1,223
Heat risk 4/10 · Minor
- Hot days now (above 92°F)
- 7 days/yr
- Hot days in 30 yrs
- 16 days/yr
Wind risk 1/10 · Minimal
- Chance of severe wind over 30 yrs
- —
Air-quality risk 8/10 · Major
- Unhealthy air days now
- 15 days/yr
- Unhealthy air days in 30 yrs
- 17 days/yr
Risk factors via First Street. Map © Google.
Why this score? — see what drove the B- grade
The composite is a weighted blend of 9 inputs, each scored 0–100. Each bar is that input's sub-score; the figure is the points it added to the 100-point composite (weight × sub-score).
- Cash flow +30.0/30.0
- 1% rule +10.0/10.0
- DSCR +10.0/10.0
- Livability +3.8/5.0
- Schools +3.7/10.0
- Rent growth +3.2/5.0
- ARV discount +2.5/15.0
- Condition / age +2.5/5.0
- Appreciation +0.0/10.0
$130,000
🖨 Deal sheet 📄 Offer letter ✓ Due diligence
Listing remarks
Cute home in an all age park, ready for some fresh paint to make it your own. Priced to sell. 2 bedroom 1 bathroom (custom tiled shower). Great carport parking for 3 cars, and a custom shed at the end of the carport. A small room added into the living room that can be taken out if you need more living room area. This home also offers cement siding for the added security of never worrying about dry rot. Ant to top it off a brand new heater put in last year.
Key facts
- Cement siding
- Carport parking
- Custom shed
Tags
Property features AI
Finance
- Financial info: Monthly land lease amount: $945
- HOA & community: No association; Not a senior community
Exterior
- Parking: Covered parking; 3 parking spaces
- Utilities: Natural gas connected; Public sewer
- Home design: Manufactured in park; Single wide; Original condition
- Construction: Manufactured home by Fleetwood; Make: Westfield
- Exterior features: Composition roof; Vinyl skirting; Located in a park (Sunset Park); Land lease in effect
Interior
- Kitchen: Free-standing gas oven; Hood over range; Laminate countertops; Free-standing refrigerator
- Bedrooms: 2 bedrooms
- Flooring: Tile
- Bathrooms: 1 full bathroom with shower stall
- Heating & cooling: Central heating; Ceiling fan(s); Room air conditioning
- Interior features: Cathedral ceiling
- Laundry & utility: Washer included; Dryer included; Gas water heater
Neighborhood map
What this means for you Summary
Snapshot
- This is a 2-bed/1.0-bath manufactured listed at $130k.
Deal economics
- At list price, monthly cash flow is $1k ($14k/yr) — positive.
- The deal already cash-flows at list — no discount required.
- Meets the 1% rule at list price ($2k rent vs $130k).
- Recommended offer: $118k (9.0% below list) — sets the bar for market timing.
- Cap rate 16.7% vs local median 2.5% in Santa Rosa — top-decile yield for the area; either an underpriced asset or a hidden risk that comps aren't pricing in. Stress-test before assuming the spread holds.
Location & tenants
- Location reads 75/100 on livability (#112 in CA, #3,940 nationally) — a middle-class / working-renter tenant base. Strengths: amenities A+, commute A+, employment A+; Watch: schools C-, cost of living F.
- Santa Rosa High (urban): math 31% / reading 47% proficiency, ranked #703 of 1,400 in CA (top 50%) — families likely to look elsewhere, expect single-tenant / working-renter base with shorter leases.
- Market conditions: Rents rising (+2.9%/yr); 120 active listings in the ZIP; 16 comparable units currently listed for rent nearby; rentals leasing fast (median 14d on market — plan ~1-2 weeks tenant-placement turnaround); solid renter incomes; 1,039 units permitted in Sonoma County in 2024 (185 in 5+ unit buildings).
- This rent runs 35% of the median local income ($83k/yr) — at the standard rent-burdened threshold; future hikes will face affordability resistance.
Forward outlook
- Local home prices are declining (-3.0%/yr); year-one equity from $899 of loan paydown is wiped out by about $4k of value loss. Plan a longer hold.
- Sonoma County population projected at +8% by 2050 — modest demand growth; plan on rents tracking national, not racing it.
- At projected returns (-3.0% appreciation + 2.9% rent growth), your $36k cash investment doubles in ~4 years — after that, you're playing with house money.
Negotiation context
- It's been on market 91 days — a 9% lower offer ($118k) is reasonable based on typical stale-listing flexibility.
Risks & watch-outs
- Climate carrying-cost: major wildfire risk — expect insurance premiums to compound above CPI over the hold.
Questions for the listing agent
- It's been on market 91 days. Have you received any prior offers? Is the seller open to a 9% concession, seller financing, or rate buy-down credit?
- Why hasn't it sold? Are there any deal-killer items the seller is aware of (foundation, flood, title, zoning, code violations)?
- Is there a deadline driving the sale (1031 exchange, divorce, estate, relocation)? That informs how much negotiation room exists.
- What's the average days-on-market for RENTAL listings here right now (not sales)? A rising rental-DOM trend means longer vacancies and softer asking-rent achievability than the comps imply.
- What's the recent tenant-quality profile in this submarket — average credit score on applications, eviction rate, late-payment / NSF rate, and stable-employment percentage? A property-management company in the area should have these aggregated.
- How much new for-sale + rental construction is in the pipeline within 1–3 miles? Heavy new supply typically softens prices + rents 12–24 months out; constrained supply supports both.
Investment metrics
- 1% rule
- 1.84% ✓
- Cap rate
- 16.71%
- Cash-on-cash
- 37.19%
- DSCR
- 2.65
- GRM
- 4.5
CMA / ARV
- ARV (on-the-fly)
- $117,000
- Comps found
- 10
Show comp detail 10 sales within ~0.75 mi
| Address | Dist | Beds/Ba | Sqft | Sold | Price | $/sf | Match |
|---|---|---|---|---|---|---|---|
| 2963 Santa Rosa Ave Unit C-12 | 0.00mi | 2/1.0 | 750 (0%) | 0mo | $117,000 | $156 | 100 |
| 252 Pear Ln | 0.31mi | 2/1.0 | 743 (-1%) | 1mo | $35,000 | $47 | 84 |
| 280 Aileen Way | 0.27mi | 2/1.0 | 720 (-4%) | 10mo | $102,000 | $142 | 72 |
| 255 Apple Ln | 0.32mi | 2/1.0 | 784 (+4%) | 12mo | $70,000 | $89 | 68 |
| 3309 Santa Rosa Ave #17 | 0.56mi | 2/2.0 | 800 (+7%) | 9mo | $140,000 | $175 | 51 |
| 29 Wayside Dr | 0.74mi | 2/1.0 | 784 (+4%) | 12mo | $119,000 | $152 | 48 |
| 115 Coachman Ln #19 | 0.75mi | 2/1.0 | 672 (-10%) | 8mo | $120,000 | $179 | 41 |
| 131 El Crystal Dr | 0.56mi | 2/1.0 | 640 (-15%) | 13mo | $122,500 | $191 | 39 |
| 319 Apple Ln | 0.37mi | 3/2.0 (+1) | 850 (+13%) | 17mo | $111,000 | $131 | 38 |
| 157 Plaza Dr | 0.69mi | 2/1.0 | 640 (-15%) | 15mo | $134,000 | $209 | 30 |
Match score weights: distance 35% · size 25% · config 20% · recency 20%. Top-matched comps best support the ARV.
Projected returns pro-forma
-3.0% appreciation · 2.93% rent growth · sell at horizon
- IRR
- 33.0%
- Equity multiple
- 2.39×
- Total profit
- $50,572
- Equity at exit
- $19,383
- IRR
- 39.9%
- Equity multiple
- 4.73×
- Total profit
- $135,677
- Equity at exit
- $11,240
Cash invested: $36,400 (down + closing). Projections, not guarantees.
Landlord ↔ Tenant lean methodology
- Overall (STATE)
- 18 Strongly Tenant-Friendly
- State California
- 18 Strongly Tenant-Friendly · D+13
- County
- — inherits STATE
- City
- — inherits STATE
ZIP-level market 95407
- Rents YoY
- 2.9%
- Active inventory
- 120
- Price-to-rent
- 4.5×
Monthly cashflow live
- Estimated rent
- $2,393 high interval (Pro) →
- Mortgage (P&I)
- −$682
- Tax from tax record
- −$26 /mo · $317/yr
- Insurance
- −$54
- HOA
- −$0
- Vacancy / Maint / Mgmt
- −$503
- Net cashflow
- $1,128
Break-even live
UW: 25.0% down · 7.5% · 30yr · 1.5% tax · 5.0% vac · 8.0% maint · 8.0% mgmt
Financing live
Cash to close
- Down payment
- $32,500
- Closing costs
- $3,900
- Reserves months
- —
- Total cash needed
- —
Loan-product check · same deal, 3 products live
Conventional
25% down · 7.5% · 30yr
- Down + closing
- —
- Monthly P&I
- —
- Monthly cashflow
- —
- DSCR
- —
- Eligible?
- —
Personal DTI + credit; lowest rate.
DSCR
20% down · 8.5% · 30yr
- Down + closing
- —
- Monthly P&I
- —
- Monthly cashflow
- —
- DSCR
- —
- Eligible?
- —
No personal income docs; deal must DSCR.
Hard money
10% down · 12.0% · 12mo
- Down + closing
- —
- Monthly P&I
- —
- Monthly cashflow
- —
- DSCR
- —
- Eligible?
- —
Short-term bridge; refi at stabilization.
Rent comps 16 comps
| Address | Beds | Baths | Sqft | Rent | $/sqft | DOM | Units | Dist |
|---|---|---|---|---|---|---|---|---|
| 1018 Bellevue Ave Santa Rosa, CA | 1.0–4.0 | 1.0–2.0 | 1010 | $1,874 | $1.86 | 13d | 1 | 0.32mi |
| 240 Burt St Santa Rosa, CA | 1.0–2.0 | 1.0–2.0 | 742 | $2,563 | $3.45 | 13d | 10 | 0.47mi |
| 2327 Summercreek Dr Santa Rosa, CA | 1.0–2.0 | 1.0–2.0 | 1083 | $2,920 | $2.69 | 13d | 6 | 0.49mi |
| 325 Yolanda Ave Santa Rosa, CA | 1.0–3.0 | 1.0–2.0 | 1144 | $2,852 | $2.49 | 13d | 15 | 0.63mi |
| 2585 Kenton Ct Unit B Santa Rosa, CA | 2.0 | 1.0 | 789 | $2,150 | $2.72 | 13d | 1 | 0.72mi |
| 1501 Patty Pl Unit 1591 Santa Rosa, CA | 2.0 | 2.0 | 747 | $2,500 | $3.35 | 13d | 1 | 0.81mi |
| 1501 Patty Pl Unit 1555 Santa Rosa, CA | 2.0 | 2.0 | 747 | $1,995 | $2.67 | 13d | 1 | 0.81mi |
| 1501 Patty Pl Unit 3075 Santa Rosa, CA | 3.0 | 2.0 | 1047 | $2,850 | $2.72 | 13d | 1 | 0.81mi |
| 2350 Corby Ave Santa Rosa, CA | 2.0 | 1.0 | 903 | $2,185 | $2.42 | 13d | 1 | 0.85mi |
| 2146 Bedford St Unit 2134-211 Santa Rosa, CA | 1.0 | 1.0 | 720 | $2,075 | $2.88 | 13d | 1 | 0.98mi |
| 2146 Bedford St Unit 2130-101 Santa Rosa, CA | 2.0 | 2.0 | 920 | $2,450 | $2.66 | 13d | 1 | 0.98mi |
| 1020 Kawana Springs Rd Santa Rosa, CA | 1.0–3.0 | 1.0–2.0 | 890 | $2,860 | $3.21 | 13d | 27 | 0.98mi |
| 2146 Bedford St Santa Rosa, CA | 1.0 | 1.0 | 720 | $1,900 | $2.64 | 13d | 1 | 1.00mi |
| 2111 Kawana Springs Rd Santa Rosa, CA | 1.0–3.0 | 1.0–2.0 | 936 | $2,892 | $3.09 | 13d | 8 | 1.07mi |
| 147 Colgan Ave Santa Rosa, CA | 1.0–2.0 | 1.0 | 623 | $1,941 | $3.12 | 13d | 3 | 1.21mi |
| 777 Aston Ave Santa Rosa, CA | 1.0 | 1.0 | 635 | $1,749 | $2.75 | 13d | 1 | 1.45mi |
Listing history 9 events
-
2026-06-03statusdays on market $130,000 Pending 91 DOM
-
2026-06-02days on market $130,000 Contingent (Show) 90 DOM
-
2026-06-01days on market $130,000 Contingent (Show) 89 DOM
-
2026-05-31days on market $130,000 Contingent (Show) 88 DOM
-
2026-05-30days on market $130,000 Contingent (Show) 87 DOM
-
2026-05-06historical Contingent (Show)
-
2026-04-06price $130,000
-
2026-03-22price $135,000
-
2026-03-04$149,000 Active
ⓘ Source: listings_history table (triggers on properties + properties_extension) + one-shot
backfill from property_details.listing_events for pre-trigger history.
Tax reassessment forecast CA · Resets to sale price
- Current annual tax
- $317 · $26/mo
- Projected year-2 tax
- $988 · $82/mo
- Expected delta
- +$671/yr (+$56/mo · 211.8%)
ⓘ Screening estimate from a state-policy table — verify with the county assessor before closing.
Climate risk First Street
- Flood 3/10 Moderate FEMA zone X (unshaded) · 20% chance over 30 yrs
- Wildfire 6/10 Major
- Heat 4/10 Moderate 7 d/yr ≥92°F today · 16 d/yr by 30 yrs out
- Wind 1/10 Low
- Air quality 8/10 Severe 15 unhealthy d/yr today · 17 by 30 yrs out
Nearby sold comps map
Loading sold comps map…
Walkable amenities ~0.75 mi
Loading nearby amenities…
Taxation est. · year 1
- Rental income
- $28,716
- − Mortgage interest
- −$7,282
- − Property taxes
- −$317
- − Insurance
- −$650
- − Repairs & maintenance
- −$2,297
- − Management
- −$2,297
- − Depreciation
- −$3,782
- Taxable income
- $12,091
- Est. tax owed @ 24.0%
- −$2,902
- After-tax cash flow
- $10,636/yr
For passive investors: Depreciation is non-cash, so a rental often shows a tax loss while cash-flowing — sheltering income. Rental losses are passive: they offset passive income freely, and up to $25,000/yr can offset ordinary (W-2) income if you actively participate and your MAGI is under $100k (phasing out to $0 by $150k); unused losses carry forward. On sale, claimed depreciation is recaptured at up to 25%, and gains may owe capital-gains tax (a 1031 exchange can defer both). Figures are a year-1 estimate at your 24.0% rate — not tax advice; consult a CPA.
Schools (NCES district)
- District
- Santa Rosa High
- NCES district ID
- 0635830
- Math proficiency
- 31% —
- Reading proficiency
- 47% —
- Median HH income
- $62,000
- Composite
- 37.25/100
- National rank
- #8972
- State rank
- #703 of 1400 in CA
Livability — Santa Rosa
- Score
- 75/100
- State rank
- #112
- US rank
- #3940
Category grades
Schools grade is shown separately in the Schools card above.
Census & demographics
- Census place
- Santa Rosa, CA
- County
- Sonoma County · 449,805 people
- City population
- 210,074
- Metro
- Santa Rosa-Petaluma, CA
- Population (ZIP)
- 42,036
- Household income
- $82,863
- Rent vs Own
- Severe rent burden
- 1943.0
Population outlook (Sonoma County) Hauer SSP2
- Today (2025)
- 539,935 people
- By 2030
- 554,870 · +2.8%
- By 2040
- 573,262 · +6.2%
- By 2050
- 580,715 · +7.6%
- By 2075
- 579,229 · +7.3%
- By 2100
- 547,835 · +1.5%
Race, ethnicity, and origin ACS 2023
- Neighborhood character
- Diverse neighborhood (Simpson 0.56)
- Race & ethnicity
- Hispanic / Latino 59% White 29% Two or more races 13% Asian 7% Black 2% Native American 1%
- Hispanic origin (detail)
- Mexican 50% Puerto Rican 1%
- Common ancestry
- Lithuanian 1% Romanian 1% Italian 1%
- Foreign-born
- 32% · Canada, Vietnam, China
- Languages at home
- 42% English-only · Spanish 50% Other Indo-European 2% Other Asian/Pacific 1%
Political lean MEDSL · Sonoma
- 2024 margin
- Solid D (+46.2) · D 71.4% · R 25.2% · Other 3.3%
- 2008→2024 swing
- -3.4pp toward R · 2008: 49.6pp · 2024: 46.2pp
- All cycles
- 2024: D+46.2 2020: D+51.5 2016: D+47.9 2012: D+44.9 2008: D+49.6
Not yet ingested
- Civics
- —
Market trends
- HPI YoY
- ▼ -852.74%
- Current HPI
- 256.4307
- Rent YoY
- ▲ 2.93%
- Metro
- Santa Rosa-Petaluma, CA
- State GDP YoY
- ▲ 3.21%
- F500 in state
- 116
Industry mix (Fortune 500 HQ in CA)
| Industry | F500 HQs | Revenue |
|---|---|---|
| Technology | 27 | $1,492B |
|
||
| Financial Services | 3 | $174B |
|
||
| Retail | 3 | $44B |
|
||
| Insurance | 3 | $26B |
|
||
| Media / Entertainment | 2 | $115B |
|
||
| Pharmaceuticals / Biotech | 2 | $62B |
|
||
Price history
-12.8% since first listed4 events — show timeline
- 2026-05-06 Contingent — BAREIS
- 2026-04-06 Price Changed $130,000 BAREIS
- 2026-03-22 Price Changed $135,000 BAREIS
- 2026-03-04 Listed $149,000 BAREIS
Property tax history
-3.8%/yrLatest (2025): $317 · -0.8% YoY. Source: county tax records.
Cash-flow waterfall
monthlySold comps — $/sqft
last 12 mo · ≤1 miLoading sold comps…