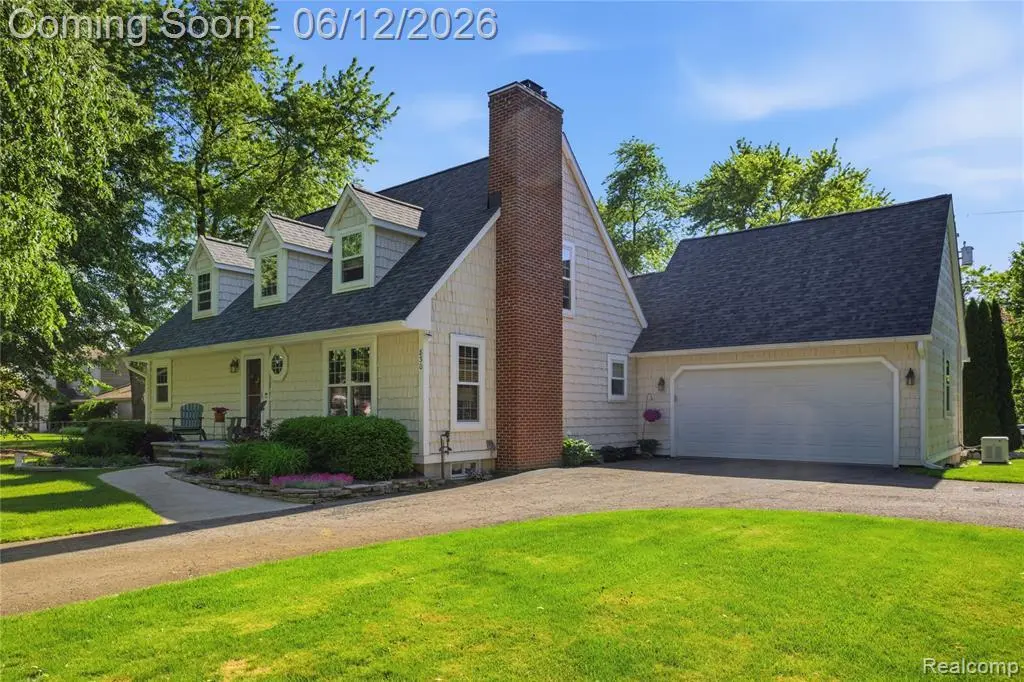
830 Hemingway Rd · Orion, MI
Flood risk 1/10 · Minimal
- FEMA flood zone
- X (unshaded)
- Chance of flooding over 30 yrs
- 0.0%
- Est. flood insurance / yr
- $473 – $860
Fire risk 1/10 · Minimal
- Est. fire insurance / yr
- $784 – $1,456
Heat risk 2/10 · Minimal
- Hot days now (above 96°F)
- 7 days/yr
- Hot days in 30 yrs
- 15 days/yr
Wind risk 2/10 · Minimal
- Chance of severe wind over 30 yrs
- —
Air-quality risk 3/10 · Minor
- Unhealthy air days now
- 2 days/yr
- Unhealthy air days in 30 yrs
- 4 days/yr
Risk factors via First Street. Map © Google.
Why this score? — see what drove the C grade
The composite is a weighted blend of 9 inputs, each scored 0–100. Each bar is that input's sub-score; the figure is the points it added to the 100-point composite (weight × sub-score).
- Cash flow +19.6/30.0
- ARV discount +15.0/15.0
- DSCR +6.2/10.0
- Schools +5.1/10.0
- 1% rule +4.6/10.0
- Rent growth +2.5/5.0
- Livability +2.5/5.0
- Condition / age +2.5/5.0
- Appreciation +0.0/10.0
$559,900
🖨 Deal sheet 📄 Offer letter ✓ Due diligence
Listing remarks
Welcome to 830 Hemingway! A beautifully maintained Cape Cod-style home in Orion Township offering exceptional privacy just minutes from downtown Lake Orion. This home offers outstanding outdoor living with a private backyard oasis featuring mature trees, extensive hardscape paver patios, and a tranquil pond. Garden area has been prepared and ready for planting. In addition to the attached garage, you'll find heated detached garage/workshop with additional storage above. Fully finished shed provides more flexible space for hobbies, work, or relaxation (separate entry). Inside, the unique floor plan offers a family room highlighted by a stone fireplace and mantle (gas). The kitchen is equippe
Key facts
- 0.63 acre lot
- 4 garage spots
- Built 1998
Property features AI
Finance
- Other: Property on approximately 0.63 acres (frontage ~118')
Exterior
- Parking: Attached garage with 4 parking spaces; Electric in garage, garage door opener, heated garage, side-loading; Workshop area in garage; Direct interior access to the home
- Utilities: Public water; Natural gas service; Public sewer (implied); Electric service (implied)
- Home design: Residential 2-story home; Built in 1998; Basement (finished)
- Construction: Vinyl siding construction; Basement foundation
- Exterior features: Vinyl siding; Fenced yard; Lawn sprinkler system; Patio; Porch; Pond on property; Paved street access
Interior
- Kitchen: Kitchen on entry level (approx. 11 x 12) with wood flooring; Appliances included: Dishwasher, Range/Oven, Microwave, Refrigerator
- Bedrooms: Primary bedroom on entry level (14 x 18) with carpet; Second bedroom on second level (17 x 29) with carpet; Third bedroom on second level (width 30) with carpet
- Flooring: Carpet in bedrooms and family room; Wood flooring in kitchen and dining room; Ceramic flooring in bathrooms
- Bathrooms: Four total baths/lavatories (3 full, 1 lavatory); Main/entry-level bath: ceramic floors, approx. 7 x 12; Second-level bath: ceramic floors, approx. 8 x 9; Basement bath: ceramic floors
- Heating & cooling: Forced air heating (natural gas); Central A/C; Gas water heater
- Interior features: Fireplace (family room, gas); Spa / jetted tub; Sound system; Finished basement; 12 total rooms
- Laundry & utility: Laundry room on entry level (approx. 11 x 10); Washer and Dryer included
Neighborhood map
What this means for you Summary
Snapshot
- This is a 3-bed/3.5-bath single-family listed at $560k.
Deal economics
- At list price, monthly cash flow is $649 ($8k/yr) — positive.
- The deal already cash-flows at list — no discount required.
- To meet the 1% rule (rent ≥ 1% of price), the offer needs to be $535k (4.4% below list).
- Recommended offer: $535k (4.4% below list) — sets the bar for 1% rule.
Location & tenants
- Location reads: area grade C — affects rentability + tenant quality, not the cash-flow math above.
- Lake Orion Community Schools (suburban): math 49% / reading 64% proficiency, ranked #45 of 540 in MI (top 8%) — acceptable for families but not a draw, mixed tenant base, ~2y average lease; only 16% free/reduced lunch — higher-income household profile.
- Market conditions: 88 active listings in the ZIP; 1 comparable units currently listed for rent nearby; 2,614 units permitted in Oakland County in 2024 (721 in 5+ unit buildings).
Forward outlook
- Local home prices are declining (-3.0%/yr); year-one equity from $4k of loan paydown is wiped out by about $17k of value loss. Plan a longer hold.
- Oakland County population projected at +10% by 2050 — modest demand growth; plan on rents tracking national, not racing it.
Negotiation context
- Only 7 days on market — expect competitive offers; lowballing is unlikely to land.
Questions for the listing agent
- Is there a deadline driving the sale (1031 exchange, divorce, estate, relocation)? That informs how much negotiation room exists.
- What's the average days-on-market for RENTAL listings here right now (not sales)? A rising rental-DOM trend means longer vacancies and softer asking-rent achievability than the comps imply.
- What's the recent tenant-quality profile in this submarket — average credit score on applications, eviction rate, late-payment / NSF rate, and stable-employment percentage? A property-management company in the area should have these aggregated.
- How much new for-sale + rental construction is in the pipeline within 1–3 miles? Heavy new supply typically softens prices + rents 12–24 months out; constrained supply supports both.
Investment metrics
- 1% rule
- 0.96% ✗
- Cap rate
- 7.68%
- Cash-on-cash
- 4.97%
- DSCR
- 1.22
- GRM
- 8.7
CMA / ARV
- ARV (on-the-fly)
- $731,666
- Comps found
- 6
Show comp detail 6 sales within ~0.75 mi
| Address | Dist | Beds/Ba | Sqft | Sold | Price | $/sf | Match |
|---|---|---|---|---|---|---|---|
| 1062 Key West Ct | 0.57mi | 4/3.5 (+1) | 3,458 (+1%) | 4mo | $520,000 | $150 | 63 |
| 1133 Walloon Way | 0.50mi | 4/2.5 (+1) | 3,126 (-9%) | 1mo | $396,000 | $127 | 53 |
| 924 Pine Ave | 0.42mi | 4/3.5 (+1) | 3,098 (-9%) | 13mo | $780,000 | $252 | 49 |
| 655 Ferndale Ave | 0.40mi | 4/2.0 (+1) | 3,279 (-4%) | 18mo | $334,650 | $102 | 49 |
| 1162 Heights Rd | 0.55mi | 4/3.5 (+1) | 3,921 (+15%) | 12mo | $837,900 | $214 | 35 |
| 1157 Arbroak Ct | 0.70mi | 4/3.5 (+1) | 3,929 (+15%) | 12mo | $1,237,000 | $315 | 27 |
Match score weights: distance 35% · size 25% · config 20% · recency 20%. Top-matched comps best support the ARV.
Projected returns pro-forma
-3.0% appreciation · 3.0% rent growth · sell at horizon
- IRR
- -8.6%
- Equity multiple
- 0.68×
- Total profit
- $-49,513
- Equity at exit
- $83,483
- IRR
- 0.9%
- Equity multiple
- 1.06×
- Total profit
- $9,682
- Equity at exit
- $48,410
Cash invested: $156,772 (down + closing). Projections, not guarantees.
Landlord ↔ Tenant lean methodology
- Overall (STATE)
- 62 Landlord-Friendly
- State Michigan
- 62 Landlord-Friendly · EVEN
- County
- — inherits STATE
- City
- — inherits STATE
ZIP-level market 48362
- Active inventory
- 88
- Price-to-rent
- 8.7×
Monthly cashflow live
- Estimated rent
- $5,350 medium interval (Pro) →
- Mortgage (P&I)
- −$2,936
- Tax from tax record
- −$408 /mo · $4,901/yr
- Insurance
- −$233
- HOA
- −$0
- Vacancy / Maint / Mgmt
- −$1,124
- Net cashflow
- $649
Break-even live
UW: 25.0% down · 7.5% · 30yr · 1.5% tax · 5.0% vac · 8.0% maint · 8.0% mgmt
Financing live
Cash to close
- Down payment
- $139,975
- Closing costs
- $16,797
- Reserves months
- —
- Total cash needed
- —
Loan-product check · same deal, 3 products live
Conventional
25% down · 7.5% · 30yr
- Down + closing
- —
- Monthly P&I
- —
- Monthly cashflow
- —
- DSCR
- —
- Eligible?
- —
Personal DTI + credit; lowest rate.
DSCR
20% down · 8.5% · 30yr
- Down + closing
- —
- Monthly P&I
- —
- Monthly cashflow
- —
- DSCR
- —
- Eligible?
- —
No personal income docs; deal must DSCR.
Hard money
10% down · 12.0% · 12mo
- Down + closing
- —
- Monthly P&I
- —
- Monthly cashflow
- —
- DSCR
- —
- Eligible?
- —
Short-term bridge; refi at stabilization.
Rent comps 1 comps
| Address | Beds | Baths | Sqft | Rent | $/sqft | DOM | Units | Dist |
|---|---|---|---|---|---|---|---|---|
| 442 Mystic Cove Ln Lake Orion, MI | 2.0–4.0 | 2.0–3.0 | 1989 | $5,350 | $2.69 | 1d | 4 | 1.14mi |
Listing history 7 events
-
2026-06-18days on market $559,900 Active 7 DOM
-
2026-06-17days on market $559,900 Active 6 DOM
-
2026-06-16days on market $559,900 Active 5 DOM
-
2026-06-15days on market $559,900 Active 4 DOM
-
2026-06-13statusdays on market $559,900 Active 2 DOM
-
2026-06-08remarks 699-char remark
-
2026-06-08$559,900 Coming Soon 1 DOM
ⓘ Source: listings_history table (triggers on properties + properties_extension) + one-shot
backfill from property_details.listing_events for pre-trigger history.
Tax reassessment forecast MI · Partial reset (capped growth)
- Current annual tax
- $4,901 · $408/mo
- Projected year-2 tax
- $6,762 · $563/mo
- Expected delta
- +$1,861/yr (+$155/mo · 38.0%)
ⓘ Screening estimate from a state-policy table — verify with the county assessor before closing.
Climate risk First Street
- Flood 1/10 Low FEMA zone X (unshaded) · 0% chance over 30 yrs
- Wildfire 1/10 Low
- Heat 2/10 Low 7 d/yr ≥96°F today · 15 d/yr by 30 yrs out
- Wind 2/10 Low
- Air quality 3/10 Moderate 2 unhealthy d/yr today · 4 by 30 yrs out
Nearby sold comps map
Loading sold comps map…
Walkable amenities ~0.75 mi
Loading nearby amenities…
Taxation est. · year 1
- Rental income
- $64,200
- − Mortgage interest
- −$31,363
- − Property taxes
- −$4,901
- − Insurance
- −$2,800
- − Repairs & maintenance
- −$5,136
- − Management
- −$5,136
- − Depreciation
- −$16,288
- Taxable loss
- −$1,423
- Est. tax savings @ 24.0%
- +$342
- After-tax cash flow
- $8,125/yr
For passive investors: Depreciation is non-cash, so a rental often shows a tax loss while cash-flowing — sheltering income. Rental losses are passive: they offset passive income freely, and up to $25,000/yr can offset ordinary (W-2) income if you actively participate and your MAGI is under $100k (phasing out to $0 by $150k); unused losses carry forward. On sale, claimed depreciation is recaptured at up to 25%, and gains may owe capital-gains tax (a 1031 exchange can defer both). Figures are a year-1 estimate at your 24.0% rate — not tax advice; consult a CPA.
Schools (NCES district)
- District
- Lake Orion Community Schools
- NCES district ID
- 2620730
- Math proficiency
- 49% ▼ -10.00%
- Reading proficiency
- 64% ▼ -10.00%
- Median HH income
- $82,396
- Composite
- 51.21/100
- National rank
- #1755
- State rank
- #45 of 540 in MI
Livability — Orion
No livability data for this city. (Only ~50 U.S. cities are tracked.)
Census & demographics
- City population
- 10,401
- Population (ZIP)
- 14,746
Population outlook (Oakland County) Hauer SSP2
- Today (2025)
- 1,335,747 people
- By 2030
- 1,375,100 · +2.9%
- By 2040
- 1,435,385 · +7.5%
- By 2050
- 1,469,250 · +10.0%
- By 2075
- 1,531,946 · +14.7%
- By 2100
- 1,450,485 · +8.6%
Race, ethnicity, and origin ACS 2023
- Neighborhood character
- Predominantly White (88%)
- Race & ethnicity
- White 88% Two or more races 5% Hispanic / Latino 4% Black 2% Asian 2%
- Common ancestry
- Romanian 11% Lithuanian 5% Slovak 3%
- Foreign-born
- 6% · Canada, China, Dominican Republic
- Languages at home
- 95% English-only · Spanish 1% Chinese 1% German/W. Germanic 1%
Political lean MEDSL · Oakland
- 2024 margin
- D (+10.6) · D 54.4% · R 43.8% · Other 1.9%
- 2008→2024 swing
- -3.9pp toward R · 2008: 14.5pp · 2024: 10.6pp
- All cycles
- 2024: D+10.6 2020: D+14.1 2016: D+8.1 2012: D+8.1 2008: D+14.5
Not yet ingested
- Civics
- —
Market trends
- HPI YoY
- ▼ -307.96%
- Current HPI
- 182.3653
- Rent YoY
- —
- Metro
- —
- State GDP YoY
- ▲ 1.37%
- F500 in state
- 28
Industry mix (Fortune 500 HQ in MI)
| Industry | F500 HQs | Revenue |
|---|---|---|
| Automotive Parts | 3 | $48B |
|
||
| Automotive | 2 | $372B |
|
||
| Chemicals | 1 | $45B |
|
||
| Automotive Retail | 1 | $29B |
|
||
| Healthcare / Medical Devices | 1 | $23B |
|
||
| Automotive Technology | 1 | $20B |
|
||
Price history
1 event — show timeline
- 2026-06-08 Coming Soon $559,900 MiRealSource-MiMLS
Property tax history
+3.9%/yrLatest (2025): $4,901 · +2.7% YoY. Source: county tax records.
Cash-flow waterfall
monthlySold comps — $/sqft
last 12 mo · ≤1 miLoading sold comps…