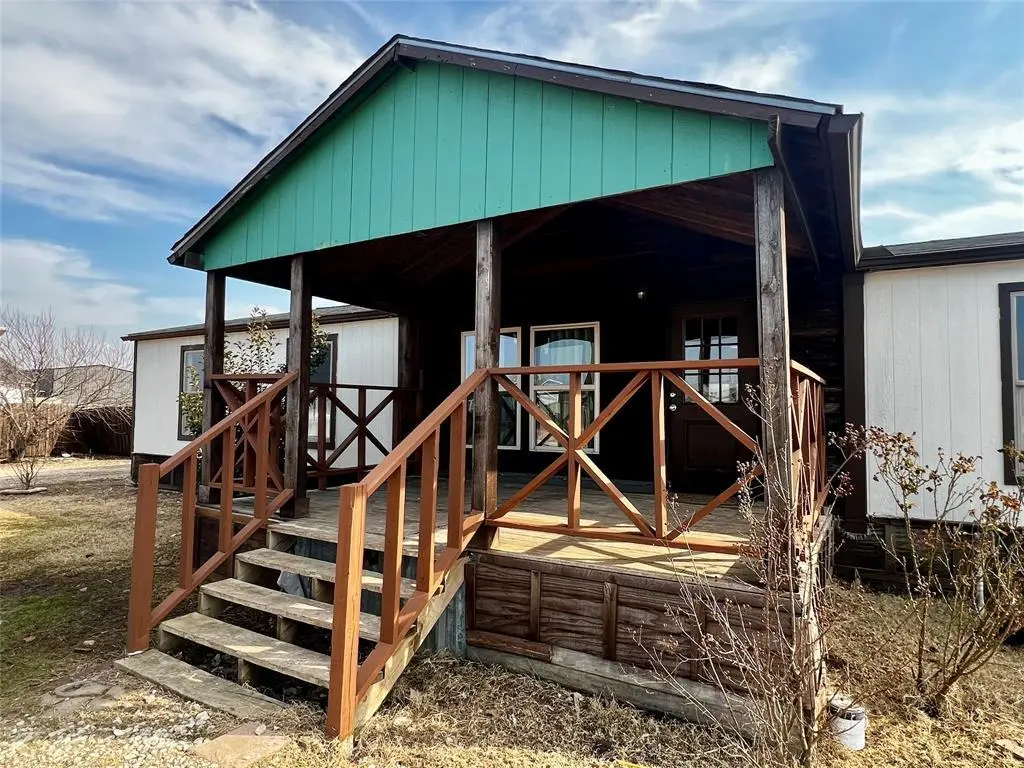
312 Choice Dr · Red Oak, TX
Flood risk 1/10 · Minimal
- FEMA flood zone
- X (unshaded)
- Chance of flooding over 30 yrs
- 0.0%
- Est. flood insurance / yr
- $507 – $1,088
Fire risk 2/10 · Minimal
- Est. fire insurance / yr
- $1,222 – $2,270
Heat risk 7/10 · Major
- Hot days now (above 110°F)
- 7 days/yr
- Hot days in 30 yrs
- 25 days/yr
Wind risk 6/10 · Moderate
- Chance of severe wind over 30 yrs
- 27.0%
Air-quality risk 2/10 · Minimal
- Unhealthy air days now
- 1 days/yr
- Unhealthy air days in 30 yrs
- 1 days/yr
Risk factors via First Street. Map © Google.
Why this score? — see what drove the C grade
The composite is a weighted blend of 9 inputs, each scored 0–100. Each bar is that input's sub-score; the figure is the points it added to the 100-point composite (weight × sub-score).
- Cash flow +16.3/30.0
- ARV discount +15.0/15.0
- DSCR +5.0/10.0
- Appreciation +4.4/10.0
- Livability +3.5/5.0
- 1% rule +3.4/10.0
- Rent growth +2.5/5.0
- Schools +2.5/10.0
- Condition / age +2.5/5.0
$264,000
🖨 Deal sheet (PDF) 📄 Offer letter ✓ Due diligence
Listing remarks MLS
Spacious double-wide manufactured home with plenty of room for parking and gatherings. This 2017 home is full of life and a must-see if you’re looking for space on a fenced property—perfect for entertaining, vehicles, and more. Casa con mucho espacio para estacionamiento y reuniones. Esta propiedad del 2017 con 4 recámaras está llena de vida y es una excelente opción si busca espacio en un terreno cercado, ideal para sus camionetas, reuniones y sus animales.
Key facts
- Fenced property
- Room for parking
- Space for gatherings
Tags
Neighborhood map
What this means for you Summary
Snapshot
- This is a 4-bed/2.0-bath manufactured listed at $264k.
Deal economics
- At list price, monthly cash flow is $145 ($2k/yr) — positive.
- The deal already cash-flows at list — no discount required.
- To meet the 1% rule (rent ≥ 1% of price), the offer needs to be $222k (15.9% below list).
- Recommended offer: $222k (15.9% below list) — sets the bar for 1% rule.
- Cap rate 7.0% vs local median 3.9% in Red Oak — top-decile yield for the area; either an underpriced asset or a hidden risk that comps aren't pricing in. Stress-test before assuming the spread holds.
Location & tenants
- Location reads 69/100 on livability (#435 in TX) — a middle-class / working-renter tenant base. Strengths: employment A+, housing A+, cost of living A; Watch: schools D, amenities F, commute F.
- Ferris ISD (rural): math 28% / reading 29% proficiency, ranked #634 of 826 in TX (top 77%) — low school quality limits family demand, transient renter base, plan for 1-2y turnover; 67% free/reduced lunch — lower-income household profile, screen leases tightly.
- Market conditions: 61 active listings in the ZIP; 3,016 units permitted in Ellis County in 2024 (20 in 5+ unit buildings).
Forward outlook
- Local home prices are declining (-1.2%/yr); year-one equity from $2k of loan paydown is wiped out by about $3k of value loss. Plan a longer hold.
- Ellis County population projected at +36% by 2050 — long-run rental-demand tailwind backs the buy-and-hold thesis.
Negotiation context
- It's been on market 135 days — a 12% lower offer ($232k) is reasonable based on typical stale-listing flexibility.
Risks & watch-outs
- Climate carrying-cost: major wind risk, 27% chance of damaging wind over 30y; extreme-heat days projected 7→25/yr by 2055 (HVAC capex compounding) — expect insurance premiums to compound above CPI over the hold.
Questions for the listing agent
- It's been on market 135 days. Have you received any prior offers? Is the seller open to a 16% concession, seller financing, or rate buy-down credit?
- Why hasn't it sold? Are there any deal-killer items the seller is aware of (foundation, flood, title, zoning, code violations)?
- Is there a deadline driving the sale (1031 exchange, divorce, estate, relocation)? That informs how much negotiation room exists.
- Schools are D-rated, which usually means shorter tenancies and higher turnover. Who's the typical renter profile here, and what's been the actual vacancy rate?
- What's the average days-on-market for RENTAL listings here right now (not sales)? A rising rental-DOM trend means longer vacancies and softer asking-rent achievability than the comps imply.
- What's the recent tenant-quality profile in this submarket — average credit score on applications, eviction rate, late-payment / NSF rate, and stable-employment percentage? A property-management company in the area should have these aggregated.
- How much new for-sale + rental construction is in the pipeline within 1–3 miles? Heavy new supply typically softens prices + rents 12–24 months out; constrained supply supports both.
Investment metrics
- 1% rule
- 0.84% ✗
- Cap rate
- 6.95%
- Cash-on-cash
- 2.35%
- DSCR
- 1.10
- GRM
- 9.9
CMA / ARV
- ARV (median comp)
- $353,190
- List price
- $264,000
- Delta
- -25.25%
- Verdict
- UNDERPRICED
- Comps
- 14 within 1.0 mi
Show comp detail 1 sale within ~0.75 mi
| Address | Dist | Beds/Ba | Sqft | Sold | Price | $/sf | Match |
|---|---|---|---|---|---|---|---|
| 122 Golden Coast Cir | 0.16mi | 3/2.0 (-1) | 1,664 (0%) | 6mo | $149,999 | $90 | 82 |
Match score weights: distance 35% · size 25% · config 20% · recency 20%. Top-matched comps best support the ARV.
Projected returns pro-forma
-1.23% appreciation · 3.0% rent growth · sell at horizon
- IRR
- -4.3%
- Equity multiple
- 0.82×
- Total profit
- $-13,486
- Equity at exit
- $60,816
- IRR
- 2.7%
- Equity multiple
- 1.25×
- Total profit
- $18,449
- Equity at exit
- $61,414
Cash invested: $73,920 (down + closing). Projections, not guarantees.
Landlord ↔ Tenant lean methodology
- Overall (STATE)
- 87 Strongly Landlord-Friendly
- State Texas
- 87 Strongly Landlord-Friendly · R+5
- County
- — inherits STATE
- City
- — inherits STATE
ZIP-level market 75152
- Home prices YoY
- -0.3%
- Active inventory
- 61
- Price-to-rent
- 9.9×
Monthly cashflow live
- Estimated rent
- $2,220 medium interval (Pro) →
- Mortgage (P&I)
- −$1,384
- Tax from tax record
- −$114 /mo · $1,372/yr
- Insurance
- −$110
- HOA
- −$0
- Vacancy / Maint / Mgmt
- −$466
- Net cashflow
- $145
Break-even live
Sensitivity live
| Price | -10% $294 | -5% $220 | +0% $145 | +5% $70 | +10% $-5 |
|---|---|---|---|---|---|
| Rent | -10% $-30 | -5% $57 | +0% $145 | +5% $233 | +10% $320 |
| Rate | -1.0pp $278 | -0.5pp $212 | base $145 | +0.5pp $76 | +1.0pp $7 |
UW: 25.0% down · 7.5% · 30yr · 1.5% tax · 5.0% vac · 8.0% maint · 8.0% mgmt
Financing live
Cash to close
- Down payment
- $66,000
- Closing costs
- $7,920
- Reserves months
- —
- Total cash needed
- —
Loan-product check · same deal, 3 products live
Conventional
25% down · 7.5% · 30yr
- Down + closing
- —
- Monthly P&I
- —
- Monthly cashflow
- —
- DSCR
- —
- Eligible?
- —
Personal DTI + credit; lowest rate.
DSCR
20% down · 8.5% · 30yr
- Down + closing
- —
- Monthly P&I
- —
- Monthly cashflow
- —
- DSCR
- —
- Eligible?
- —
No personal income docs; deal must DSCR.
Hard money
10% down · 12.0% · 12mo
- Down + closing
- —
- Monthly P&I
- —
- Monthly cashflow
- —
- DSCR
- —
- Eligible?
- —
Short-term bridge; refi at stabilization.
Listing history 17 events
-
2026-06-21days on market $264,000 Active 135 DOM
-
2026-06-18days on market $264,000 Active 132 DOM
-
2026-06-17days on market $264,000 Active 131 DOM
-
2026-06-16pricedays on market $264,000 Active 130 DOM
-
2026-06-15days on market $265,000 Active 129 DOM
-
2026-06-13days on market $265,000 Active 127 DOM
-
2026-06-09days on market $265,000 Active 123 DOM
-
2026-06-08days on market $265,000 Active 122 DOM
-
2026-06-07days on market $265,000 Active 121 DOM
-
2026-06-04days on market $265,000 Active 118 DOM
-
2026-06-03days on market $265,000 Active 117 DOM
-
2026-06-02days on market $265,000 Active 116 DOM
-
2026-06-01days on market $265,000 Active 115 DOM
-
2026-05-31days on market $265,000 Active 114 DOM
-
2026-04-20price $265,000 495-char remark
Show marketing remark (495 chars)
Spacious double-wide manufactured home with plenty of room for parking and gatherings. This 2017 home is full of life and a must-see if you’re looking for space on a fenced property—perfect for entertaining, vehicles, and more. Casa con mucho espacio para estacionamiento y reuniones. Esta propiedad del 2017 con 4 recámaras está llena de vida y es una excelente opción si busca espacio en un terreno cercado, ideal para sus camionetas, reuniones y sus animales.
-
2026-04-03price $275,000 495-char remark
Show marketing remark (495 chars)
Spacious double-wide manufactured home with plenty of room for parking and gatherings. This 2017 home is full of life and a must-see if you’re looking for space on a fenced property—perfect for entertaining, vehicles, and more. Casa con mucho espacio para estacionamiento y reuniones. Esta propiedad del 2017 con 4 recámaras está llena de vida y es una excelente opción si busca espacio en un terreno cercado, ideal para sus camionetas, reuniones y sus animales.
-
2026-02-02$290,000 Active 495-char remark
Show marketing remark (495 chars)
Spacious double-wide manufactured home with plenty of room for parking and gatherings. This 2017 home is full of life and a must-see if you’re looking for space on a fenced property—perfect for entertaining, vehicles, and more. Casa con mucho espacio para estacionamiento y reuniones. Esta propiedad del 2017 con 4 recámaras está llena de vida y es una excelente opción si busca espacio en un terreno cercado, ideal para sus camionetas, reuniones y sus animales.
ⓘ Source: listings_history table (triggers on properties + properties_extension) + one-shot
backfill from property_details.listing_events for pre-trigger history.
Tax reassessment forecast TX · Resets to sale price
- Current annual tax
- $1,372 · $114/mo
- Projected year-2 tax
- $4,831 · $403/mo
- Expected delta
- +$3,459/yr (+$288/mo · 252.2%)
ⓘ Screening estimate from a state-policy table — verify with the county assessor before closing.
Climate risk First Street
- Flood 1/10 Low FEMA zone X (unshaded) · 0% chance over 30 yrs
- Wildfire 2/10 Low
- Heat 7/10 Severe 7 d/yr ≥110°F today · 25 d/yr by 30 yrs out
- Wind 6/10 Major 27% chance of damaging wind over 30 yrs
- Air quality 2/10 Low 1 unhealthy d/yr today · 1 by 30 yrs out
Nearby sold comps map
Loading sold comps map…
Walkable amenities ~0.75 mi
Loading nearby amenities…
Taxation est. · year 1
- Rental income
- $26,638
- − Mortgage interest
- −$14,788
- − Property taxes
- −$1,372
- − Insurance
- −$1,320
- − Repairs & maintenance
- −$2,131
- − Management
- −$2,131
- − Depreciation
- −$7,680
- Taxable loss
- −$2,784
- Est. tax savings @ 24.0%
- +$668
- After-tax cash flow
- $2,407/yr
For passive investors: Depreciation is non-cash, so a rental often shows a tax loss while cash-flowing — sheltering income. Rental losses are passive: they offset passive income freely, and up to $25,000/yr can offset ordinary (W-2) income if you actively participate and your MAGI is under $100k (phasing out to $0 by $150k); unused losses carry forward. On sale, claimed depreciation is recaptured at up to 25%, and gains may owe capital-gains tax (a 1031 exchange can defer both). Figures are a year-1 estimate at your 24.0% rate — not tax advice; consult a CPA.
Schools (NCES district)
- District
- Ferris ISD
- NCES district ID
- 4819170
- Math proficiency
- 28% ▼ -9.00%
- Reading proficiency
- 29% ▼ -3.00%
- Median HH income
- $53,468
- Composite
- 25.3/100
- National rank
- #7486
- State rank
- #634 of 826 in TX
Livability — Red Oak
- Score
- 69/100
- State rank
- #435
- US rank
- #8931
Category grades
Schools grade is shown separately in the Schools card above.
Census & demographics
- City population
- 52,516
- Population (ZIP)
- 5,563
Population outlook (Ellis County) Hauer SSP2
- Today (2025)
- 194,556 people
- By 2030
- 209,679 · +7.8%
- By 2040
- 238,837 · +22.8%
- By 2050
- 265,451 · +36.4%
- By 2075
- 326,571 · +67.9%
- By 2100
- 362,156 · +86.1%
Race, ethnicity, and origin ACS 2023
- Neighborhood character
- Majority White (61%)
- Race & ethnicity
- White 61% Hispanic / Latino 35% Two or more races 6%
- Hispanic origin (detail)
- Mexican 30%
- Common ancestry
- Slovak 2% Hungarian 2% Italian 2%
- Foreign-born
- 7% · Canada, Jamaica
- Languages at home
- 76% English-only · Spanish 24%
Political lean MEDSL · Ellis
- 2024 margin
- Solid R (+31.1) · D 34.0% · R 65.1%
- 2008→2024 swing
- +11.2pp toward D · 2008: -42.2pp · 2024: -31.1pp
- All cycles
- 2024: R+31.1 2020: R+34.1 2016: R+45.4 2012: R+47.5 2008: R+42.2
Not yet ingested
- Civics
- —
Market trends
- HPI YoY
- ▼ -1.23%
- Current HPI
- 360.16
- Rent YoY
- —
- Metro
- —
- State GDP YoY
- ▲ 3.95%
- F500 in state
- 110
Industry mix (Fortune 500 HQ in TX)
| Industry | F500 HQs | Revenue |
|---|---|---|
| Energy | 16 | $1,198B |
|
||
| Technology | 5 | $198B |
|
||
| Engineering / Construction | 4 | $72B |
|
||
| Energy Services | 3 | $60B |
|
||
| Utilities | 3 | $41B |
|
||
| Healthcare | 2 | $330B |
|
||
Price history
-8.6% since first listed3 events — show timeline
- 2026-04-20 Price Changed $265,000 NTREIS
- 2026-04-03 Price Changed $275,000 NTREIS
- 2026-02-02 Listed $290,000 NTREIS
Property tax history
+5.5%/yrLatest (2025): $1,372 · -24.5% YoY. Source: county tax records.
Cash-flow waterfall
monthlySold comps — $/sqft
last 12 mo · ≤1 miLoading sold comps…