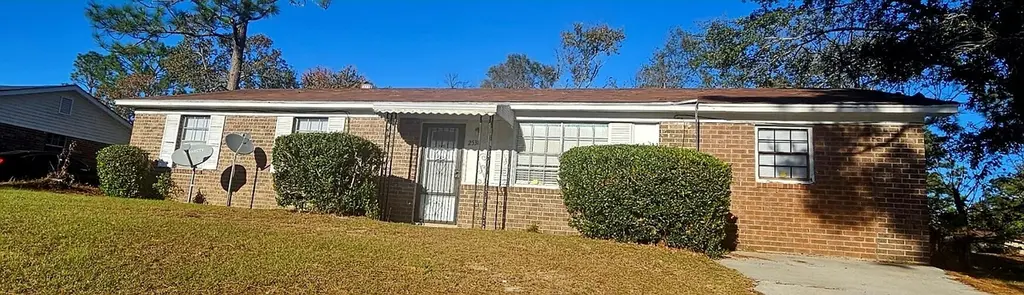
2538 W Kensington Dr · Augusta-Richmond County consolidated government (balance), GA
Flood risk 1/10 · Minimal
- FEMA flood zone
- X (unshaded)
- Chance of flooding over 30 yrs
- 0.0%
- Est. flood insurance / yr
- $507 – $1,088
Fire risk 4/10 · Minor
- Est. fire insurance / yr
- $963 – $1,789
Heat risk 7/10 · Major
- Hot days now (above 106°F)
- 7 days/yr
- Hot days in 30 yrs
- 17 days/yr
Wind risk 6/10 · Moderate
- Chance of severe wind over 30 yrs
- 66.0%
Air-quality risk 3/10 · Minor
- Unhealthy air days now
- 3 days/yr
- Unhealthy air days in 30 yrs
- 3 days/yr
Risk factors via First Street. Map © Google.
Why this score? — see what drove the B- grade
The composite is a weighted blend of 9 inputs, each scored 0–100. Each bar is that input's sub-score; the figure is the points it added to the 100-point composite (weight × sub-score).
- Cash flow +27.9/30.0
- ARV discount +15.0/15.0
- DSCR +9.9/10.0
- 1% rule +6.7/10.0
- Livability +2.5/5.0
- Condition / age +2.5/5.0
- Rent growth +2.4/5.0
- Schools +1.3/10.0
- Appreciation +0.0/10.0
$130,000
🖨 Deal sheet (PDF) 📄 Offer letter ✓ Due diligence
Listing remarks
Come tour this well-kept home and discover its great features and fantastic location.
Key facts
- 0.26 acre lot
- Built 1971
Neighborhood map
What this means for you Summary
Snapshot
- This is a 3-bed/1.5-bath single-family listed at $130k.
Deal economics
- At list price, monthly cash flow is $399 ($5k/yr) — positive.
- The deal already cash-flows at list — no discount required.
- Meets the 1% rule at list price ($2k rent vs $130k).
- Cap rate 10.0% vs local median 5.3% in Augusta-Richmond County consolidated government (balance) — top-decile yield for the area; either an underpriced asset or a hidden risk that comps aren't pricing in. Stress-test before assuming the spread holds.
Location & tenants
- Location reads: area grade B — affects rentability + tenant quality, not the cash-flow math above.
- Richmond County (urban): math 12% / reading 20% proficiency, ranked #154 of 174 in GA (top 88%) — low school quality limits family demand, transient renter base, plan for 1-2y turnover; 72% free/reduced lunch — lower-income household profile, screen leases tightly.
- Zoned schools: Glenn Hills Elementary School (math 2% / reading 8%, grade F, #1,160 of 1,228 statewide, top 98%, 393 students, 98% FRL); Glenn Hills Middle School (math 2% / reading 6%, grade F, #467 of 470 statewide, top 99%, 762 students, 98% FRL); Glenn Hills High School (math 2% / reading 2%, grade F, #421 of 424 statewide, top 100%, 883 students, 98% FRL) — zoned schools average 98% FRL vs 72% district-wide (26 pts higher); higher-poverty schools than district average — tighter screening recommended.
- Zoned-school proficiency averages 4% at this address vs 16% district-wide (-12 pts) — the specific schools serving this property underperform the Richmond County average; the district grade overstates school quality for this exact location.
- Market conditions: Rents soft (-0.2%/yr); 364 active listings in the ZIP; 20 comparable units currently listed for rent nearby; rentals at typical pace (median 24d on market — plan ~3-4 weeks tenant-placement turnaround); 45% of comp listings sitting > 30 days — soft ceiling on asking rent; 561 units permitted in Richmond County in 2024 (0 in 5+ unit buildings).
- This rent runs 40% of the median local income ($46k/yr) — at the standard rent-burdened threshold; future hikes will face affordability resistance.
Forward outlook
- Local home prices are declining (-3.0%/yr); year-one equity from $899 of loan paydown is wiped out by about $4k of value loss. Plan a longer hold.
- Richmond County population projected to shrink 5% by 2050 — rents likely to lag national; underwrite the cash flow, not the appreciation.
Negotiation context
- Only 0 days on market — expect competitive offers; lowballing is unlikely to land.
- 2 sale attempts with the ask held roughly flat each time — persistent listings suggest the price (not the market) is what's stuck; bring a comps-based counter.
Risks & watch-outs
- Climate carrying-cost: major wind risk, 66% chance of damaging wind over 30y; extreme-heat days projected 7→17/yr by 2055 (HVAC capex compounding) — expect insurance premiums to compound above CPI over the hold.
Questions for the listing agent
- Built in 1971 — when were the roof, HVAC, electrical panel, plumbing, and water heater last replaced?
- Is there a deadline driving the sale (1031 exchange, divorce, estate, relocation)? That informs how much negotiation room exists.
- What's the average days-on-market for RENTAL listings here right now (not sales)? A rising rental-DOM trend means longer vacancies and softer asking-rent achievability than the comps imply.
- What's the recent tenant-quality profile in this submarket — average credit score on applications, eviction rate, late-payment / NSF rate, and stable-employment percentage? A property-management company in the area should have these aggregated.
- How much new for-sale + rental construction is in the pipeline within 1–3 miles? Heavy new supply typically softens prices + rents 12–24 months out; constrained supply supports both.
Investment metrics
- 1% rule
- 1.17% ✓
- Cap rate
- 9.98%
- Cash-on-cash
- 13.17%
- DSCR
- 1.59
- GRM
- 7.1
CMA / ARV
- ARV (on-the-fly)
- $164,754
- Comps found
- 12
Show comp detail 12 sales within ~0.75 mi
| Address | Dist | Beds/Ba | Sqft | Sold | Price | $/sf | Match |
|---|---|---|---|---|---|---|---|
| 2538 E Kensington Dr | 0.00mi | 3/1.5 | 1,456 (-0%) | 8mo | $210,500 | $145 | 93 |
| 3411 Webster Rd | 0.16mi | 3/2.0 | 1,352 (-7%) | 7mo | $141,400 | $105 | 73 |
| 3426 S Kensington Dr | 0.28mi | 3/1.5 | 1,326 (-9%) | 2mo | $89,000 | $67 | 70 |
| 2528 Georgetown Dr | 0.21mi | 3/1.5 | 1,325 (-9%) | 6mo | $150,000 | $113 | 70 |
| 3308 Blanchard Rd | 0.32mi | 3/2.0 | 1,290 (-12%) | 1mo | $171,900 | $133 | 63 |
| 3606 Rolling Meadows Dr | 0.70mi | 3/1.5 | 1,456 (-0%) | 14mo | $158,500 | $109 | 56 |
| 2505 Blackstone St | 0.30mi | 3/1.5 | 1,250 (-14%) | 8mo | $140,000 | $112 | 55 |
| 3204 Hillis Road Rd | 0.44mi | 4/1.5 (+1) | 1,335 (-8%) | 8mo | $162,900 | $122 | 54 |
| 3602 Rolling Meadows Dr | 0.64mi | 4/1.5 (+1) | 1,479 (+1%) | 14mo | $165,000 | $112 | 51 |
| 2963 Meadowbrook Dr | 0.64mi | 4/2.0 (+1) | 1,641 (+13%) | 6mo | $155,000 | $94 | 37 |
| 3007 Meadowbrook Dr | 0.66mi | 4/2.0 (+1) | 1,672 (+15%) | 3mo | $218,000 | $130 | 35 |
| 3609 Cameron Dr | 0.73mi | 3/2.0 | 1,631 (+12%) | 12mo | $206,000 | $126 | 34 |
Match score weights: distance 35% · size 25% · config 20% · recency 20%. Top-matched comps best support the ARV.
Projected returns pro-forma
-3.0% appreciation · 0.0% rent growth · sell at horizon
- IRR
- -0.1%
- Equity multiple
- 1.00×
- Total profit
- $-105
- Equity at exit
- $19,383
- IRR
- 6.5%
- Equity multiple
- 1.42×
- Total profit
- $15,347
- Equity at exit
- $11,240
Cash invested: $36,400 (down + closing). Projections, not guarantees.
Landlord ↔ Tenant lean methodology
- Overall (STATE)
- 90 Strongly Landlord-Friendly
- State Georgia
- 90 Strongly Landlord-Friendly · R+3
- County
- — inherits STATE
- City
- — inherits STATE
ZIP-level market 30906
- Home prices YoY
- -21.6%
- Rents YoY
- -0.2%
- Active inventory
- 364
- Price-to-rent
- 7.1×
Monthly cashflow live
- Estimated rent
- $1,515 high interval (Pro) →
- Mortgage (P&I)
- −$682
- Tax from tax record
- −$62 /mo · $741/yr
- Insurance
- −$54
- HOA
- −$0
- Vacancy / Maint / Mgmt
- −$318
- Net cashflow
- $399
Break-even live
Sensitivity live
| Price | -10% $473 | -5% $436 | +0% $399 | +5% $363 | +10% $326 |
|---|---|---|---|---|---|
| Rent | -10% $280 | -5% $340 | +0% $399 | +5% $459 | +10% $519 |
| Rate | -1.0pp $465 | -0.5pp $433 | base $399 | +0.5pp $366 | +1.0pp $331 |
UW: 25.0% down · 7.5% · 30yr · 1.5% tax · 5.0% vac · 8.0% maint · 8.0% mgmt
Financing live
Cash to close
- Down payment
- $32,500
- Closing costs
- $3,900
- Reserves months
- —
- Total cash needed
- —
Loan-product check · same deal, 3 products live
Conventional
25% down · 7.5% · 30yr
- Down + closing
- —
- Monthly P&I
- —
- Monthly cashflow
- —
- DSCR
- —
- Eligible?
- —
Personal DTI + credit; lowest rate.
DSCR
20% down · 8.5% · 30yr
- Down + closing
- —
- Monthly P&I
- —
- Monthly cashflow
- —
- DSCR
- —
- Eligible?
- —
No personal income docs; deal must DSCR.
Hard money
10% down · 12.0% · 12mo
- Down + closing
- —
- Monthly P&I
- —
- Monthly cashflow
- —
- DSCR
- —
- Eligible?
- —
Short-term bridge; refi at stabilization.
Rent comps 20 comps
| Address | Beds | Baths | Sqft | Rent | $/sqft | DOM | Units | Dist |
|---|---|---|---|---|---|---|---|---|
| 3412 Kensington Dr N Augusta, GA | 3.0 | 2.0 | 1225 | $1,350 | $1.10 | 24d | 1 | 0.22mi |
| 3320 Hillis Rd Augusta, GA | 4.0 | 3.0 | 1788 | $1,850 | $1.03 | 14d | 1 | 0.26mi |
| 3200 Deans Bridge Rd Augusta, GA | 1.0–4.0 | 1.0–1.5 | 1075 | $970 | $0.90 | 24d | 6 | 0.42mi |
| 2941 Rollingwood Dr Augusta, GA | 3.0 | 2.0 | 1297 | $1,750 | $1.35 | 24d | 1 | 0.46mi |
| 3519 Evangeline Dr Augusta, GA | 4.0 | 1.5 | 1800 | $1,595 | $0.89 | 44d | 1 | 0.47mi |
| 2914 Cumberland Dr Augusta, GA | 4.0 | 1.5 | 1650 | $1,400 | $0.85 | 21d | 1 | 0.50mi |
| 3504 Osage Ct Augusta, GA | 4.0 | 1.5 | 1425 | $1,556 | $1.09 | 14d | 1 | 0.70mi |
| 2707 Gardenbrook Ct Augusta, GA | 3.0 | 2.0 | 1728 | $1,606 | $0.93 | 44d | 1 | 0.84mi |
| 2612 Lumpkin Rd Augusta, GA | 3.0 | 1.5 | 1614 | $1,450 | $0.90 | 44d | 1 | 0.91mi |
| 3001 Alene Ct Augusta, GA | 4.0 | 2.0 | 1288 | $1,631 | $1.27 | 24d | 1 | 0.93mi |
| 2808 Nighthawk Dr Augusta, GA | 3.0 | 2.0 | 1314 | $1,450 | $1.10 | 44d | 1 | 0.95mi |
| 3613 Alene Cir Augusta, GA | 3.0 | 2.0 | 1260 | $1,325 | $1.05 | 14d | 1 | 0.96mi |
| 2708 Blossom Dr Unit B Augusta, GA | 2.0 | 1.5 | 896 | $950 | $1.06 | 44d | 1 | 1.06mi |
| 2830 Lumpkin Rd Unit A Augusta, GA | 3.0 | 1.5 | 1000 | $900 | $0.90 | 24d | 1 | 1.07mi |
| 3517 Byron Pl Augusta, GA | 3.0 | 2.0 | 1300 | $1,350 | $1.04 | 44d | 1 | 1.19mi |
| 2813 Leawood Ct Hephzibah, GA | 3.0 | 2.0 | 1377 | $1,250 | $0.91 | 44d | 1 | 1.25mi |
| 2544 Dover St Unit 2544 Augusta, GA | 3.0 | 1.0 | 888 | $900 | $1.01 | 44d | 1 | 1.30mi |
| 2631 Drayton Dr Augusta, GA | 3.0 | 2.0 | 1404 | $1,430 | $1.02 | 14d | 1 | 1.42mi |
| 2524 Drayton Dr Augusta, GA | 3.0 | 2.0 | 1404 | $1,700 | $1.21 | 44d | 1 | 1.46mi |
| 2609 Dublin Dr Augusta, GA | 3.0 | 2.0 | 1400 | $1,395 | $1.00 | 14d | 1 | 1.49mi |
Listing history 6 events
-
2026-02-26soldstatus $130,000
-
2026-01-20historical
-
2026-01-20status Pending
-
2025-12-20historical
-
2025-11-19$130,000
-
2025-11-19$130,000 Active
ⓘ Source: listings_history table (triggers on properties + properties_extension) + one-shot
backfill from property_details.listing_events for pre-trigger history.
Tax reassessment forecast GA · Resets to sale price
- Current annual tax
- $741 · $62/mo
- Projected year-2 tax
- $1,196 · $100/mo
- Expected delta
- +$455/yr (+$38/mo · 61.4%)
ⓘ Screening estimate from a state-policy table — verify with the county assessor before closing.
Climate risk First Street
- Flood 1/10 Low FEMA zone X (unshaded) · 0% chance over 30 yrs
- Wildfire 4/10 Moderate
- Heat 7/10 Severe 7 d/yr ≥106°F today · 17 d/yr by 30 yrs out
- Wind 6/10 Major 66% chance of damaging wind over 30 yrs
- Air quality 3/10 Moderate 3 unhealthy d/yr today · 3 by 30 yrs out
Nearby sold comps map
Loading sold comps map…
Walkable amenities ~0.75 mi
Loading nearby amenities…
Taxation est. · year 1
- Rental income
- $18,184
- − Mortgage interest
- −$7,282
- − Property taxes
- −$741
- − Insurance
- −$650
- − Repairs & maintenance
- −$1,455
- − Management
- −$1,455
- − Depreciation
- −$3,782
- Taxable income
- $2,819
- Est. tax owed @ 24.0%
- −$677
- After-tax cash flow
- $4,117/yr
For passive investors: Depreciation is non-cash, so a rental often shows a tax loss while cash-flowing — sheltering income. Rental losses are passive: they offset passive income freely, and up to $25,000/yr can offset ordinary (W-2) income if you actively participate and your MAGI is under $100k (phasing out to $0 by $150k); unused losses carry forward. On sale, claimed depreciation is recaptured at up to 25%, and gains may owe capital-gains tax (a 1031 exchange can defer both). Figures are a year-1 estimate at your 24.0% rate — not tax advice; consult a CPA.
Schools (NCES district)
- District
- Richmond County
- NCES district ID
- 1304380
- Math proficiency
- 12% ▼ -9.00%
- Reading proficiency
- 20% ▼ -6.00%
- Median HH income
- $38,069
- Composite
- 13.43/100
- National rank
- #9524
- State rank
- #154 of 174 in GA
Livability — Augusta-Richmond County consolidated government (balance)
No livability data for this city. (Only ~50 U.S. cities are tracked.)
Census & demographics
- Census place
- Augusta-Richmond County consolidated government (balance), GA
- County
- Richmond County · 190,917 people
- City population
- 154,035
- Metro
- Augusta-Richmond County, GA-SC
- Population (ZIP)
- 60,423
- Household income
- $45,999
- Rent vs Own
- Severe rent burden
- 3363.0
Population outlook (Richmond County) Hauer SSP2
- Today (2025)
- 200,753 people
- By 2030
- 200,232 · -0.3%
- By 2040
- 196,813 · -2.0%
- By 2050
- 190,347 · -5.2%
- By 2075
- 172,496 · -14.1%
- By 2100
- 146,284 · -27.1%
Race, ethnicity, and origin ACS 2023
- Neighborhood character
- Majority Black (64%)
- Race & ethnicity
- Black 64% White 27% Two or more races 5% Hispanic / Latino 5%
- Common ancestry
- Lithuanian 1%
- Foreign-born
- 2% · Canada
- Languages at home
- 95% English-only · Spanish 3% German/W. Germanic 1%
Political lean MEDSL · Richmond
- 2024 margin
- Solid D (+36.1) · D 67.8% · R 31.7%
- 2008→2024 swing
- +4.3pp toward D · 2008: 31.8pp · 2024: 36.1pp
- All cycles
- 2024: D+36.1 2020: D+37.2 2016: D+32.4 2012: D+33.8 2008: D+31.8
Not yet ingested
- Civics
- —
Market trends
- HPI YoY
- ▼ -58.99%
- Current HPI
- 213.5733
- Rent YoY
- ▼ -0.25%
- Metro
- Augusta-Richmond County, GA-SC
- State GDP YoY
- ▲ 2.66%
- F500 in state
- 28
Industry mix (Fortune 500 HQ in GA)
| Industry | F500 HQs | Revenue |
|---|---|---|
| Paper / Packaging | 2 | $29B |
|
||
| Retail | 1 | $160B |
|
||
| Transportation / Logistics | 1 | $91B |
|
||
| Airlines | 1 | $62B |
|
||
| Consumer Goods | 1 | $47B |
|
||
| Utilities | 1 | $25B |
|
||
Price history
+0.0% since first listed6 events — show timeline
- 2026-02-26 Sold (Public Records) $130,000 Public Records
- 2026-01-20 Listing Removed — Hive MLS
- 2026-01-20 Pending — Hive MLS
- 2025-12-20 Listing Removed — Hive MLS
- 2025-11-19 Listed $130,000 Hive MLS
- 2025-11-19 Listed $130,000 Hive MLS
Property tax history
+3.2%/yrLatest (2025): $741 · +17.9% YoY. Source: county tax records.
Cash-flow waterfall
monthlySold comps — $/sqft
last 12 mo · ≤1 miLoading sold comps…