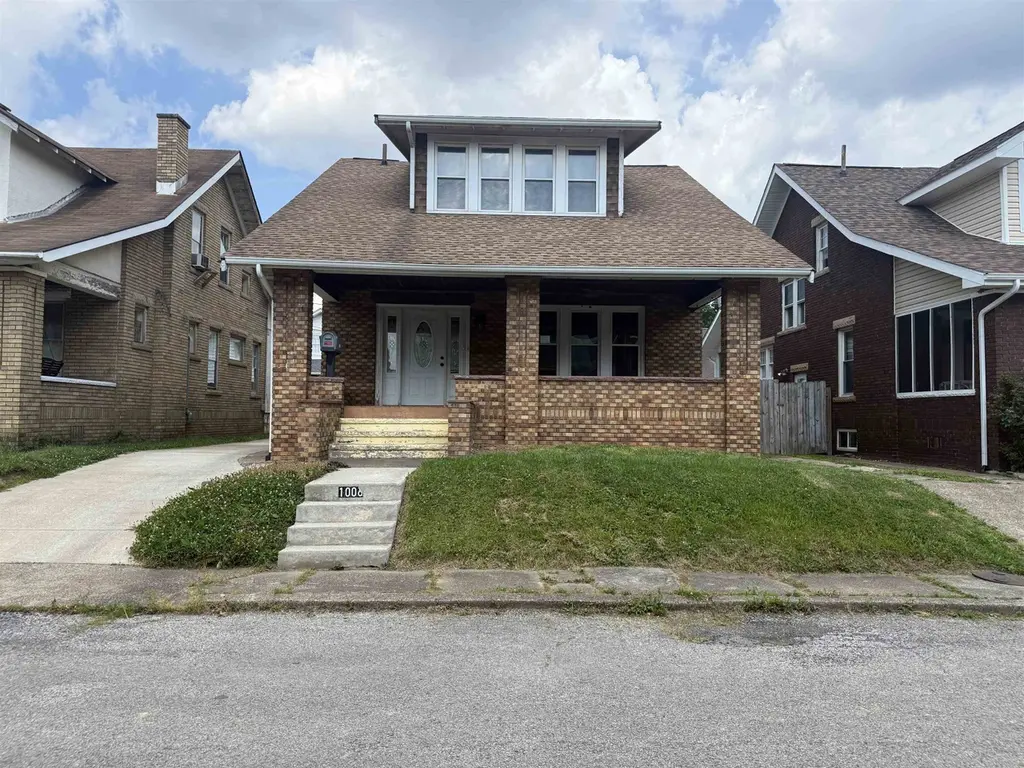
1006 Johns Ct · Huntington, WV
Flood risk 1/10 · Minimal
- FEMA flood zone
- X (unshaded)
- Chance of flooding over 30 yrs
- 0.0%
- Est. flood insurance / yr
- $473 – $860
Fire risk 3/10 · Minor
- Est. fire insurance / yr
- $787 – $1,461
Heat risk 5/10 · Moderate
- Hot days now (above 103°F)
- 7 days/yr
- Hot days in 30 yrs
- 20 days/yr
Wind risk 2/10 · Minimal
- Chance of severe wind over 30 yrs
- 1.0%
Air-quality risk 1/10 · Minimal
- Unhealthy air days now
- 0 days/yr
- Unhealthy air days in 30 yrs
- 0 days/yr
Risk factors via First Street. Map © Google.
Why this score? — see what drove the D grade
The composite is a weighted blend of 9 inputs, each scored 0–100. Each bar is that input's sub-score; the figure is the points it added to the 100-point composite (weight × sub-score).
- Cash flow +13.2/30.0
- ARV discount +7.5/15.0
- Rent growth +5.0/5.0
- DSCR +4.0/10.0
- Livability +4.0/5.0
- Schools +3.0/10.0
- 1% rule +2.8/10.0
- Condition / age +2.5/5.0
- Appreciation +0.0/10.0
$170,000
🖨 Deal sheet 📄 Offer letter ✓ Due diligence
Listing remarks
Well-maintained 3-bedroom, 1.5-bath home in a desirable Southside neighborhood, located on a quiet street just minutes from Ritter Park. This property offers a fenced backyard, a spacious front porch perfect for relaxing, and the potential for beautiful hardwood floors beneath the existing carpet. Recent updates include newer windows, roof, and HVAC system, providing added comfort and peace of mind. The home's convenient location offers easy access to parks, schools, shopping, dining, and other local amenities.
Key facts
- Spacious front porch
- Newer windows
- Fenced backyard
Tags
Property features AI
Exterior
- Parking: On-street parking
- Utilities: Public water; Public sewer
- Home design: Single family residence; 2-story
- Construction: Brick construction; Shingle roof
- Exterior features: Porch; Wood fencing; Level and sloped lot
Interior
- Flooring: Carpet
- Bathrooms: 1 full bathroom; 1 half bathroom
- Heating & cooling: Central air conditioning
- Interior features: Carpet flooring; Full unfinished basement
Neighborhood map
What this means for you Summary
Snapshot
- This is a 3-bed/1.5-bath single-family listed at $170k.
Deal economics
- At list price, monthly cash flow is $-3 ($-34/yr) — negative.
- To cash-flow at today's rent, offer at most $170k (0.3% below list).
- To meet the 1% rule (rent ≥ 1% of price), the offer needs to be $132k (22.1% below list).
- Recommended offer: $132k (22.1% below list) — sets the bar for 1% rule.
Location & tenants
- Location reads 79/100 on livability (#16 in WV, #2,045 nationally) — a middle-class / working-renter tenant base. Strengths: amenities A+, commute A+, cost of living A+; Watch: crime F, employment F.
- Cabell County Schools (urban): math 31% / reading 42% proficiency, ranked #13 of 55 in WV (top 24%) — families likely to look elsewhere, expect single-tenant / working-renter base with shorter leases.
- Zoned schools: Southside Elementary (math 37% / reading 42%, grade F, #108 of 377 statewide, top 33%, 400 students, 0% FRL); Huntington Middle School (math 21% / reading 35%, grade F, #66 of 109 statewide, top 63%, 647 students, 0% FRL); Huntington High School (math 26% / reading 50%, grade F, #31 of 110 statewide, top 28%, 1,704 students, 0% FRL) — zoned schools average 0% FRL vs 47% district-wide (47 pts lower); this property's tenant base skews higher-income than the district average.
- Market conditions: Rents rising fast (+10.6%/yr); 127 active listings in the ZIP; 1 comparable units currently listed for rent nearby; 61 units permitted in Cabell County in 2024 (5 in 5+ unit buildings).
Forward outlook
- Local home prices are declining (-3.0%/yr); year-one equity from $1k of loan paydown is wiped out by about $5k of value loss. Plan a longer hold.
Negotiation context
- Only 3 days on market — expect competitive offers; lowballing is unlikely to land.
- Current owner paid $100k; list at $170k implies a 69% gain — meaningful room to come down on a strong offer.
Risks & watch-outs
- Watch-outs: built in 1940 — expect roof / HVAC / electrical / plumbing capex.
- Climate carrying-cost: extreme-heat days projected 7→20/yr by 2055 (HVAC capex compounding) — expect insurance premiums to compound above CPI over the hold.
Questions for the listing agent
- What do current leases actually rent for vs. the listed asking? Can we see a recent rent roll and the last 12 months of T-12 income?
- Built in 1940 — when were the roof, HVAC, electrical panel, plumbing, and water heater last replaced?
- Is there a deadline driving the sale (1031 exchange, divorce, estate, relocation)? That informs how much negotiation room exists.
- Crime grade is F in this area — have there been break-ins, vandalism, or insurance claims at this property in the last 3 years? What carrier currently insures it and at what premium?
- The area grade is low — what's the realistic commute time and amenity access for the typical tenant pool here? Any planned neighborhood developments (good or bad) we should know about?
- What's the average days-on-market for RENTAL listings here right now (not sales)? A rising rental-DOM trend means longer vacancies and softer asking-rent achievability than the comps imply.
- What's the recent tenant-quality profile in this submarket — average credit score on applications, eviction rate, late-payment / NSF rate, and stable-employment percentage? A property-management company in the area should have these aggregated.
- How much new for-sale + rental construction is in the pipeline within 1–3 miles? Heavy new supply typically softens prices + rents 12–24 months out; constrained supply supports both.
Investment metrics
- 1% rule
- 0.78% ✗
- Cap rate
- 6.27%
- Cash-on-cash
- -0.07%
- DSCR
- 1.00
- GRM
- 10.7
CMA / ARV
- ARV (on-the-fly)
- $111,930
- Comps found
- 12
Show comp detail 12 sales within ~0.75 mi
| Address | Dist | Beds/Ba | Sqft | Sold | Price | $/sf | Match |
|---|---|---|---|---|---|---|---|
| 824 2nd Street St W | 0.26mi | 3/1.5 | 1,346 (-1%) | 16mo | $65,000 | $48 | 72 |
| 317 W 5th Ave | 0.48mi | 3/1.5 | 1,392 (+2%) | 8mo | $22,500 | $16 | 67 |
| 148 S Edgemont Rd | 0.34mi | 3/2.0 | 1,494 (+10%) | 3mo | $83,000 | $56 | 64 |
| 749 3rd St | 0.51mi | 3/2.0 | 1,300 (-5%) | 7mo | $179,000 | $138 | 60 |
| 328 7th Ave. Ave W | 0.35mi | 3/1.5 | 1,505 (+10%) | 10mo | $95,000 | $63 | 58 |
| 618 Madison Ave | 0.44mi | 4/2.0 (+1) | 1,316 (-4%) | 12mo | $160,900 | $122 | 56 |
| 501 South Blvd | 0.73mi | 3/1.5 | 1,275 (-7%) | 4mo | $185,000 | $145 | 52 |
| 215 6th Avenue West Ave | 0.45mi | 3/1.0 | 1,272 (-7%) | 18mo | $20,000 | $16 | 51 |
| 699 W Whitaker Blvd #203 | 0.27mi | 2/2.0 (-1) | 1,517 (+11%) | 16mo | $265,000 | $175 | 49 |
| 413 5th Ave West | 0.47mi | 3/1.5 | 1,560 (+14%) | 13mo | $128,000 | $82 | 43 |
| 2202 Johnstown Rd | 0.64mi | 3/1.0 | 1,200 (-12%) | 10mo | $174,000 | $145 | 40 |
| 522 9th Street West St | 0.72mi | 2/1.0 (-1) | 1,478 (+8%) | 20mo | $16,000 | $11 | 29 |
Match score weights: distance 35% · size 25% · config 20% · recency 20%. Top-matched comps best support the ARV.
Projected returns pro-forma
-3.0% appreciation · 8.0% rent growth · sell at horizon
- IRR
- -11.6%
- Equity multiple
- 0.56×
- Total profit
- $-20,784
- Equity at exit
- $25,348
- IRR
- 3.2%
- Equity multiple
- 1.28×
- Total profit
- $13,297
- Equity at exit
- $14,698
Cash invested: $47,600 (down + closing). Projections, not guarantees.
Landlord ↔ Tenant lean methodology
- Overall (STATE)
- 83 Strongly Landlord-Friendly
- State West Virginia
- 83 Strongly Landlord-Friendly · R+22
- County
- — inherits STATE
- City
- — inherits STATE
ZIP-level market 25701
- Home prices YoY
- -8.7%
- Rents YoY
- 10.6%
- Active inventory
- 127
- Price-to-rent
- 10.7×
Monthly cashflow live
- Estimated rent
- $1,325 medium interval (Pro) →
- Mortgage (P&I)
- −$891
- Tax from tax record
- −$87 /mo · $1,042/yr
- Insurance
- −$71
- HOA
- −$0
- Vacancy / Maint / Mgmt
- −$278
- Net cashflow
- $-3
Break-even live
UW: 25.0% down · 7.5% · 30yr · 1.5% tax · 5.0% vac · 8.0% maint · 8.0% mgmt
Financing live
Cash to close
- Down payment
- $42,500
- Closing costs
- $5,100
- Reserves months
- —
- Total cash needed
- —
Loan-product check · same deal, 3 products live
Conventional
25% down · 7.5% · 30yr
- Down + closing
- —
- Monthly P&I
- —
- Monthly cashflow
- —
- DSCR
- —
- Eligible?
- —
Personal DTI + credit; lowest rate.
DSCR
20% down · 8.5% · 30yr
- Down + closing
- —
- Monthly P&I
- —
- Monthly cashflow
- —
- DSCR
- —
- Eligible?
- —
No personal income docs; deal must DSCR.
Hard money
10% down · 12.0% · 12mo
- Down + closing
- —
- Monthly P&I
- —
- Monthly cashflow
- —
- DSCR
- —
- Eligible?
- —
Short-term bridge; refi at stabilization.
Rent comps 1 comps
| Address | Beds | Baths | Sqft | Rent | $/sqft | DOM | Units | Dist |
|---|---|---|---|---|---|---|---|---|
| 457 Overby Rd Huntington, WV | 3.0 | 1.5 | 1724 | $1,250 | $0.73 | 43d | 1 | 1.09mi |
Listing history 4 events
-
2026-06-13status $170,000 Pending 3 DOM
-
2026-06-12days on market $170,000 Active 3 DOM
-
2026-06-09remarks 516-char remark
-
2026-06-09$170,000 Active 1 DOM
ⓘ Source: listings_history table (triggers on properties + properties_extension) + one-shot
backfill from property_details.listing_events for pre-trigger history.
Tax reassessment forecast WV · Resets to sale price
- Current annual tax
- $1,042 · $87/mo
- Projected year-2 tax
- $1,042 · $87/mo
- Expected delta
- $0/yr ($0/mo · 0.0%)
ⓘ Screening estimate from a state-policy table — verify with the county assessor before closing.
Climate risk First Street
- Flood 1/10 Low FEMA zone X (unshaded) · 0% chance over 30 yrs
- Wildfire 3/10 Moderate
- Heat 5/10 Major 7 d/yr ≥103°F today · 20 d/yr by 30 yrs out
- Wind 2/10 Low 100% chance of damaging wind over 30 yrs
- Air quality 1/10 Low 0 unhealthy d/yr today · 0 by 30 yrs out
Nearby sold comps map
Loading sold comps map…
Walkable amenities ~0.75 mi
Loading nearby amenities…
Taxation est. · year 1
- Rental income
- $15,894
- − Mortgage interest
- −$9,523
- − Property taxes
- −$1,042
- − Insurance
- −$850
- − Repairs & maintenance
- −$1,272
- − Management
- −$1,272
- − Depreciation
- −$4,945
- Taxable loss
- −$3,009
- Est. tax savings @ 24.0%
- +$722
- After-tax cash flow
- $688/yr
For passive investors: Depreciation is non-cash, so a rental often shows a tax loss while cash-flowing — sheltering income. Rental losses are passive: they offset passive income freely, and up to $25,000/yr can offset ordinary (W-2) income if you actively participate and your MAGI is under $100k (phasing out to $0 by $150k); unused losses carry forward. On sale, claimed depreciation is recaptured at up to 25%, and gains may owe capital-gains tax (a 1031 exchange can defer both). Figures are a year-1 estimate at your 24.0% rate — not tax advice; consult a CPA.
Schools (NCES district)
- District
- Cabell County Schools
- NCES district ID
- 5400180
- Math proficiency
- 31% ▼ -7.00%
- Reading proficiency
- 42% ▼ -6.00%
- Median HH income
- $36,426
- Composite
- 30.26/100
- National rank
- #6285
- State rank
- #13 of 55 in WV
Livability — Huntington
- Score
- 79/100
- State rank
- #16
- US rank
- #2045
Category grades
Schools grade is shown separately in the Schools card above.
Census & demographics
- Census place
- Huntington, WV
- County
- Cabell County · 30,893 people
- City population
- 25,795
- Metro
- Huntington-Ashland, WV-KY-OH
- Population (ZIP)
- 21,197
- Household income
- $56,292
- Rent vs Own
- Severe rent burden
- 1186.0
Population outlook (Cabell County) Hauer SSP2
- Today (2025)
- 97,574 people
- By 2030
- 98,060 · +0.5%
- By 2040
- 98,817 · +1.3%
- By 2050
- 100,185 · +2.7%
- By 2075
- 105,895 · +8.5%
- By 2100
- 105,948 · +8.6%
Race, ethnicity, and origin ACS 2023
- Neighborhood character
- Predominantly White (82%)
- Race & ethnicity
- White 82% Black 8% Two or more races 6% Hispanic / Latino 2% Asian 2%
- Common ancestry
- Slovak 4% Italian 2% Serbian 2%
- Foreign-born
- 2% · China
- Languages at home
- 96% English-only · Spanish 2% Other Indo-European 1% Chinese 1%
Political lean MEDSL · Cabell
- 2024 margin
- Strong R (+21.9) · D 38.0% · R 59.9% · Other 2.0%
- 2008→2024 swing
- -11.8pp toward R · 2008: -10.1pp · 2024: -21.9pp
- All cycles
- 2024: R+21.9 2020: R+18.0 2016: R+25.5 2012: R+13.9 2008: R+10.1
Not yet ingested
- Civics
- —
Market trends
- HPI YoY
- ▼ -19.39%
- Current HPI
- 202.9629
- Rent YoY
- ▲ 10.58%
- Metro
- Huntington-Ashland, WV-KY-OH
- State GDP YoY
- —
- F500 in state
- 0
Price history
+69.2% since first listed2 events — show timeline
- 2026-06-09 Listed $170,000 HBRMLS
- 2007-05-02 Sold (Public Records) $100,500 Public Records
Property tax history
+2.8%/yrLatest (2025): $1,042 · +1.4% YoY. Source: county tax records.
Cash-flow waterfall
monthlySold comps — $/sqft
last 12 mo · ≤1 miLoading sold comps…