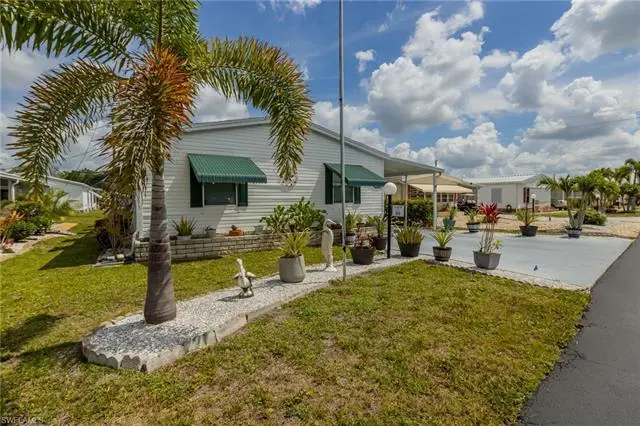
9749 Sugarberry Way · Tice, FL
Flood risk 4/10 · Minor
- FEMA flood zone
- X (unshaded)
- Chance of flooding over 30 yrs
- 0.22%
- Est. flood insurance / yr
- $507 – $1,088
Fire risk 4/10 · Minor
- Est. fire insurance / yr
- $947 – $1,759
Heat risk 10/10 · Severe
- Hot days now (above 107°F)
- 7 days/yr
- Hot days in 30 yrs
- 29 days/yr
Wind risk 10/10 · Severe
- Chance of severe wind over 30 yrs
- 99.0%
Air-quality risk 2/10 · Minimal
- Unhealthy air days now
- 1 days/yr
- Unhealthy air days in 30 yrs
- 1 days/yr
Risk factors via First Street. Map © Google.
Why this score? — see what drove the D grade
The composite is a weighted blend of 9 inputs, each scored 0–100. Each bar is that input's sub-score; the figure is the points it added to the 100-point composite (weight × sub-score).
- Cash flow +14.8/30.0
- ARV discount +8.2/15.0
- DSCR +4.5/10.0
- 1% rule +4.4/10.0
- Schools +4.1/10.0
- Livability +3.4/5.0
- Condition / age +2.5/5.0
- Rent growth +1.8/5.0
- Appreciation +0.0/10.0
$199,900
🖨 Deal sheet (PDF) 📄 Offer letter ✓ Due diligence
Listing remarks MLS
A remarkable 3 bedroom, 2 bath home in the over 55 community. .. .YOU OWN YOUR LAND. .. .This home has over 1500 sq. ft of living area with a split floor plan. Nice quality flooring. .. Carpet only in bedrooms. .. .Newer roof in 2016.. NEW A/C in 2021 (per seller). .. .Newer Hot water heater. .. .. Newer appliances. .. .including washer and dryer . .. .plus new tile in entryway and 2nd bath. .. .Wonderful screened-in lanai to rear of carport with fenced in raised porch for your BBQ's and nice seating area. .. .. Could not be better and not to be passed up. .. Owners take great pride in ownership. .. .. REMEMBER YOU OWN YOUR LAND, a wonderful plus. .. .
Key facts
- 5,488 sq ft lot
- Garage
- Community pool
Property features AI
Finance
- Other: Zoning: MH-1 (mobile/manufactured); Lot restrictions: No commercial, No RV
- HOA & community: Mandatory HOA with professional management; HOA fee $140 per month (total annual recurring fees $1,680); Community amenities include clubhouse, community pool and spa, exercise room, tennis, pickleball, bocce, shuffleboard, basketball, bike storage, billiards, hobby room, extra storage, street lights and street maintenance
Exterior
- Parking: Paved driveway; Detached 2-car carport; Golf cart parking
- Security: Gated community; Manual shutters for storm protection
- Utilities: Central water; Central sewer; Cable available
- Home design: Manufactured residential home; Single-story; Rear exposure faces north; Located in the Crystal Lakes community
- Construction: Built in 1995; Manufactured construction; Metal roof
- Exterior features: Storage; Landscaped area view; Paved road access; Regular lot
Interior
- Kitchen: Pantry; Eat-in kitchen; Dining/living area configuration; Electric cooktop; Dishwasher; Refrigerator
- Bedrooms: 3 bedrooms
- Flooring: Tile; Carpet
- Bathrooms: 2 full bathrooms; Master bathroom with separate tub and shower
- Heating & cooling: Central electric heat; Central electric cooling
- Interior features: Foyer; Pantry; Screened lanai/porch; Workshop; Guest bathroom accessible from common areas; Partially furnished; Split bedroom floor plan
- Laundry & utility: Laundry in residence; Washer; Dryer
Neighborhood map
What this means for you Summary
Snapshot
- This is a 2-bed/2.0-bath manufactured listed at $200k.
Deal economics
- At list price, monthly cash flow is $57 ($680/yr) — positive.
- The deal already cash-flows at list — no discount required.
- To meet the 1% rule (rent ≥ 1% of price), the offer needs to be $188k (5.8% below list).
- Recommended offer: $188k (5.8% below list) — sets the bar for 1% rule.
Location & tenants
- Location reads 67/100 on livability (#552 in FL) — a middle-class / working-renter tenant base. Strengths: cost of living A+, housing A+, health & safety A; Watch: schools F, amenities F, commute F.
- Lee (suburban): math 47% / reading 50% proficiency, ranked #42 of 73 in FL (top 58%) — families likely to look elsewhere, expect single-tenant / working-renter base with shorter leases.
- Market conditions: Rents soft (-3.0%/yr); 763 active listings in the ZIP; 2 comparable units currently listed for rent nearby; 15,411 units permitted in Lee County in 2024 (4,686 in 5+ unit buildings).
- This rent runs 31% of the median local income ($72k/yr) — at the standard rent-burdened threshold; future hikes will face affordability resistance.
Forward outlook
- Local home prices are declining (-3.0%/yr); year-one equity from $1k of loan paydown is wiped out by about $6k of value loss. Plan a longer hold.
- Lee County population projected at +44% by 2050 — long-run rental-demand tailwind backs the buy-and-hold thesis.
Negotiation context
- It's been on market 40 days — a 3% lower offer ($194k) is reasonable based on typical stale-listing flexibility.
- 3 sale attempts since 18y ago with the ask held roughly flat each time — persistent listings suggest the price (not the market) is what's stuck; bring a comps-based counter.
Risks & watch-outs
- Climate carrying-cost: severe wind risk, 99% chance of damaging wind over 30y; extreme-heat days projected 7→29/yr by 2055 (HVAC capex compounding) — expect insurance premiums to compound above CPI over the hold.
Questions for the listing agent
- It's been on market 40 days. Have you received any prior offers? Is the seller open to a 6% concession, seller financing, or rate buy-down credit?
- What does the HOA fee cover, when was the last increase, and are there any pending special assessments or reserve-fund shortfalls?
- Is there a deadline driving the sale (1031 exchange, divorce, estate, relocation)? That informs how much negotiation room exists.
- Schools are F-rated, which usually means shorter tenancies and higher turnover. Who's the typical renter profile here, and what's been the actual vacancy rate?
- The area grade is low — what's the realistic commute time and amenity access for the typical tenant pool here? Any planned neighborhood developments (good or bad) we should know about?
- What's the average days-on-market for RENTAL listings here right now (not sales)? A rising rental-DOM trend means longer vacancies and softer asking-rent achievability than the comps imply.
- What's the recent tenant-quality profile in this submarket — average credit score on applications, eviction rate, late-payment / NSF rate, and stable-employment percentage? A property-management company in the area should have these aggregated.
- How much new for-sale + rental construction is in the pipeline within 1–3 miles? Heavy new supply typically softens prices + rents 12–24 months out; constrained supply supports both.
Investment metrics
- 1% rule
- 0.94% ✗
- Cap rate
- 6.63%
- Cash-on-cash
- 1.21%
- DSCR
- 1.05
- GRM
- 8.8
CMA / ARV
- ARV (on-the-fly)
- $203,040
- Comps found
- 4
Show comp detail 4 sales within ~0.75 mi
| Address | Dist | Beds/Ba | Sqft | Sold | Price | $/sf | Match |
|---|---|---|---|---|---|---|---|
| 5156 Fiddleleaf Dr | 0.06mi | 2/2.0 | 1,512 (+0%) | 2mo | $189,900 | $126 | 95 |
| 5101 Fiddleleaf Dr | 0.05mi | 2/2.0 | 1,356 (-10%) | 2mo | $145,000 | $107 | 80 |
| 9640 Sugarmill Springs Dr | 0.14mi | 3/2.0 (+1) | 1,444 (-4%) | 13mo | $195,000 | $135 | 71 |
| 5375 Countrydale Ct | 0.37mi | 2/2.0 | 1,359 (-10%) | 16mo | $190,000 | $140 | 54 |
Match score weights: distance 35% · size 25% · config 20% · recency 20%. Top-matched comps best support the ARV.
Projected returns pro-forma
-3.0% appreciation · 0.0% rent growth · sell at horizon
- IRR
- -17.9%
- Equity multiple
- 0.39×
- Total profit
- $-34,242
- Equity at exit
- $29,806
- IRR
- -17.5%
- Equity multiple
- 0.17×
- Total profit
- $-46,256
- Equity at exit
- $17,284
Cash invested: $55,972 (down + closing). Projections, not guarantees.
Landlord ↔ Tenant lean methodology
- Overall (STATE)
- 87 Strongly Landlord-Friendly
- State Florida
- 87 Strongly Landlord-Friendly · R+3
- County
- — inherits STATE
- City
- — inherits STATE
ZIP-level market 33905
- Home prices YoY
- -31.4%
- Rents YoY
- -3.0%
- Active inventory
- 763
- Price-to-rent
- 8.8×
Monthly cashflow live
- Estimated rent
- $1,883 medium interval (Pro) →
- Mortgage (P&I)
- −$1,048
- Tax from tax record
- −$159 /mo · $1,911/yr
- Insurance
- −$83
- HOA
- −$140
- Vacancy / Maint / Mgmt
- −$395
- Net cashflow
- $57
Break-even live
Sensitivity live
| Price | -10% $170 | -5% $113 | +0% $57 | +5% $0 | +10% $-56 |
|---|---|---|---|---|---|
| Rent | -10% $-92 | -5% $-18 | +0% $57 | +5% $131 | +10% $205 |
| Rate | -1.0pp $157 | -0.5pp $108 | base $57 | +0.5pp $5 | +1.0pp $-48 |
UW: 25.0% down · 7.5% · 30yr · 1.5% tax · 5.0% vac · 8.0% maint · 8.0% mgmt
Financing live
Cash to close
- Down payment
- $49,975
- Closing costs
- $5,997
- Reserves months
- —
- Total cash needed
- —
Loan-product check · same deal, 3 products live
Conventional
25% down · 7.5% · 30yr
- Down + closing
- —
- Monthly P&I
- —
- Monthly cashflow
- —
- DSCR
- —
- Eligible?
- —
Personal DTI + credit; lowest rate.
DSCR
20% down · 8.5% · 30yr
- Down + closing
- —
- Monthly P&I
- —
- Monthly cashflow
- —
- DSCR
- —
- Eligible?
- —
No personal income docs; deal must DSCR.
Hard money
10% down · 12.0% · 12mo
- Down + closing
- —
- Monthly P&I
- —
- Monthly cashflow
- —
- DSCR
- —
- Eligible?
- —
Short-term bridge; refi at stabilization.
Rent comps 2 comps
| Address | Beds | Baths | Sqft | Rent | $/sqft | DOM | Units | Dist |
|---|---|---|---|---|---|---|---|---|
| 434 Buena Vista Blvd Fort Myers, FL | 3.0 | 2.0 | 1186 | $1,850 | $1.56 | 24d | 1 | 0.86mi |
| 320 Morse Plz Fort Myers, FL | 3.0 | 2.0 | 1196 | $2,000 | $1.67 | 24d | 1 | 1.35mi |
HOA detail
- Monthly dues
- $140 · $1,680/yr
- Likely covers
- water
Listing history 21 events
-
2026-06-17days on market $199,900 Active 40 DOM
-
2026-06-16days on market $199,900 Active 39 DOM
-
2026-06-15days on market $199,900 Active 38 DOM
-
2026-06-13days on market $199,900 Active 36 DOM
-
2026-06-10days on market $199,900 Active 33 DOM
-
2026-06-09days on market $199,900 Active 32 DOM
-
2026-06-08days on market $199,900 Active 31 DOM
-
2026-06-07days on market $199,900 Active 30 DOM
-
2026-06-03days on market $199,900 Active 26 DOM
-
2026-06-02days on market $199,900 Active 25 DOM
-
2026-06-01days on market $199,900 Active 24 DOM
-
2026-05-31days on market $199,900 Active 23 DOM
-
2026-05-08$199,900 Active
-
2022-05-17soldstatus $203,000
-
2022-05-13soldstatus $203,000 Closed 660-char remark
Show marketing remark (660 chars)
A remarkable 3 bedroom, 2 bath home in the over 55 community. .. .YOU OWN YOUR LAND. .. .This home has over 1500 sq. ft of living area with a split floor plan. Nice quality flooring. .. Carpet only in bedrooms. .. .Newer roof in 2016.. NEW A/C in 2021 (per seller). .. .Newer Hot water heater. .. .. Newer appliances. .. .including washer and dryer . .. .plus new tile in entryway and 2nd bath. .. .Wonderful screened-in lanai to rear of carport with fenced in raised porch for your BBQ's and nice seating area. .. .. Could not be better and not to be passed up. .. Owners take great pride in ownership. .. .. REMEMBER YOU OWN YOUR LAND, a wonderful plus. .. .
-
2022-03-28status Pending 660-char remark
Show marketing remark (660 chars)
A remarkable 3 bedroom, 2 bath home in the over 55 community. .. .YOU OWN YOUR LAND. .. .This home has over 1500 sq. ft of living area with a split floor plan. Nice quality flooring. .. Carpet only in bedrooms. .. .Newer roof in 2016.. NEW A/C in 2021 (per seller). .. .Newer Hot water heater. .. .. Newer appliances. .. .including washer and dryer . .. .plus new tile in entryway and 2nd bath. .. .Wonderful screened-in lanai to rear of carport with fenced in raised porch for your BBQ's and nice seating area. .. .. Could not be better and not to be passed up. .. Owners take great pride in ownership. .. .. REMEMBER YOU OWN YOUR LAND, a wonderful plus. .. .
-
2022-03-22$194,900 Active 660-char remark
Show marketing remark (660 chars)
A remarkable 3 bedroom, 2 bath home in the over 55 community. .. .YOU OWN YOUR LAND. .. .This home has over 1500 sq. ft of living area with a split floor plan. Nice quality flooring. .. Carpet only in bedrooms. .. .Newer roof in 2016.. NEW A/C in 2021 (per seller). .. .Newer Hot water heater. .. .. Newer appliances. .. .including washer and dryer . .. .plus new tile in entryway and 2nd bath. .. .Wonderful screened-in lanai to rear of carport with fenced in raised porch for your BBQ's and nice seating area. .. .. Could not be better and not to be passed up. .. Owners take great pride in ownership. .. .. REMEMBER YOU OWN YOUR LAND, a wonderful plus. .. .
-
2009-11-18historical
-
2008-11-24$155,900
-
1998-10-07soldstatus $2,866,000
-
1995-04-14soldstatus $1,400,000
ⓘ Source: listings_history table (triggers on properties + properties_extension) + one-shot
backfill from property_details.listing_events for pre-trigger history.
Tax reassessment forecast FL · Resets to sale price
- Current annual tax
- $1,911 · $159/mo
- Projected year-2 tax
- $1,911 · $159/mo
- Expected delta
- $0/yr ($0/mo · 0.0%)
ⓘ Screening estimate from a state-policy table — verify with the county assessor before closing.
Climate risk First Street
- Flood 4/10 Moderate FEMA zone X (unshaded) · 22% chance over 30 yrs
- Wildfire 4/10 Moderate
- Heat 10/10 Extreme 7 d/yr ≥107°F today · 29 d/yr by 30 yrs out
- Wind 10/10 Extreme 99% chance of damaging wind over 30 yrs
- Air quality 2/10 Low 1 unhealthy d/yr today · 1 by 30 yrs out
Nearby sold comps map
Loading sold comps map…
Walkable amenities ~0.75 mi
Loading nearby amenities…
Taxation est. · year 1
- Rental income
- $22,595
- − Mortgage interest
- −$11,198
- − Property taxes
- −$1,911
- − Insurance
- −$1,000
- − Repairs & maintenance
- −$1,808
- − Management
- −$1,808
- − HOA
- −$1,680
- − Depreciation
- −$5,815
- Taxable loss
- −$2,623
- Est. tax savings @ 24.0%
- +$630
- After-tax cash flow
- $1,310/yr
For passive investors: Depreciation is non-cash, so a rental often shows a tax loss while cash-flowing — sheltering income. Rental losses are passive: they offset passive income freely, and up to $25,000/yr can offset ordinary (W-2) income if you actively participate and your MAGI is under $100k (phasing out to $0 by $150k); unused losses carry forward. On sale, claimed depreciation is recaptured at up to 25%, and gains may owe capital-gains tax (a 1031 exchange can defer both). Figures are a year-1 estimate at your 24.0% rate — not tax advice; consult a CPA.
Schools (NCES district)
- District
- Lee
- NCES district ID
- 1201080
- Math proficiency
- 47% ▼ -11.00%
- Reading proficiency
- 50% ▼ -4.00%
- Median HH income
- $49,518
- Composite
- 41.49/100
- National rank
- #3458
- State rank
- #42 of 73 in FL
Livability — Tice
- Score
- 67/100
- State rank
- #552
- US rank
- #10424
Category grades
Schools grade is shown separately in the Schools card above.
Census & demographics
- County
- Lee County · 788,662 people
- Metro
- Cape Coral-Fort Myers, FL
- Population (ZIP)
- 41,381
- Household income
- $71,987
- Rent vs Own
- Severe rent burden
- 1358.0
Population outlook (Lee County) Hauer SSP2
- Today (2025)
- 871,946 people
- By 2030
- 955,468 · +9.6%
- By 2040
- 1,113,587 · +27.7%
- By 2050
- 1,256,891 · +44.1%
- By 2075
- 1,560,270 · +78.9%
- By 2100
- 1,726,848 · +98.0%
Race, ethnicity, and origin ACS 2023
- Neighborhood character
- Diverse neighborhood (Simpson 0.59)
- Race & ethnicity
- White 53% Hispanic / Latino 34% Two or more races 17% Black 9% Native American 4% Asian 2%
- Hispanic origin (detail)
- Mexican 11% Puerto Rican 5% Cuban 2%
- Common ancestry
- Romanian 2% Slovak 2% Lithuanian 2%
- Foreign-born
- 20% · Canada, Jamaica
- Languages at home
- 68% English-only · Spanish 29% Other Indo-European 1% German/W. Germanic 1%
Political lean MEDSL · Lee
- 2024 margin
- Strong R (+28.4) · D 35.5% · R 63.9%
- 2008→2024 swing
- -18.0pp toward R · 2008: -10.4pp · 2024: -28.4pp
- All cycles
- 2024: R+28.4 2020: R+19.2 2016: R+20.4 2012: R+16.6 2008: R+10.4
Not yet ingested
- Civics
- —
Market trends
- HPI YoY
- ▼ -122.89%
- Current HPI
- 268.4598
- Rent YoY
- ▼ -2.97%
- Metro
- Cape Coral-Fort Myers, FL
- State GDP YoY
- ▲ 3.28%
- F500 in state
- 36
Industry mix (Fortune 500 HQ in FL)
| Industry | F500 HQs | Revenue |
|---|---|---|
| Industrial Technology | 2 | $29B |
|
||
| Insurance | 2 | $17B |
|
||
| Retail | 1 | $60B |
|
||
| Technology Distribution | 1 | $58B |
|
||
| Homebuilding | 1 | $35B |
|
||
| Technology Manufacturing | 1 | $35B |
|
||
Price history
-85.7% since first listed9 events — show timeline
- 2026-05-08 Listed $199,900 NAPLESMLS
- 2022-05-17 Sold (Public Records) $203,000 Public Records
- 2022-05-13 Sold (MLS) $203,000 FORTMLS
- 2022-03-28 Pending — FORTMLS
- 2022-03-22 Listed $194,900 FORTMLS
- 2009-11-18 Listing Removed — NAPLESMLS
- 2008-11-24 Listed $155,900 NAPLESMLS
- 1998-10-07 Sold (Public Records) $2,866,000 Public Records
- 1995-04-14 Sold (Public Records) $1,400,000 Public Records
Property tax history
+8.9%/yrLatest (2025): $1,911 · -10.9% YoY. Source: county tax records.
Cash-flow waterfall
monthlySold comps — $/sqft
last 12 mo · ≤1 miLoading sold comps…