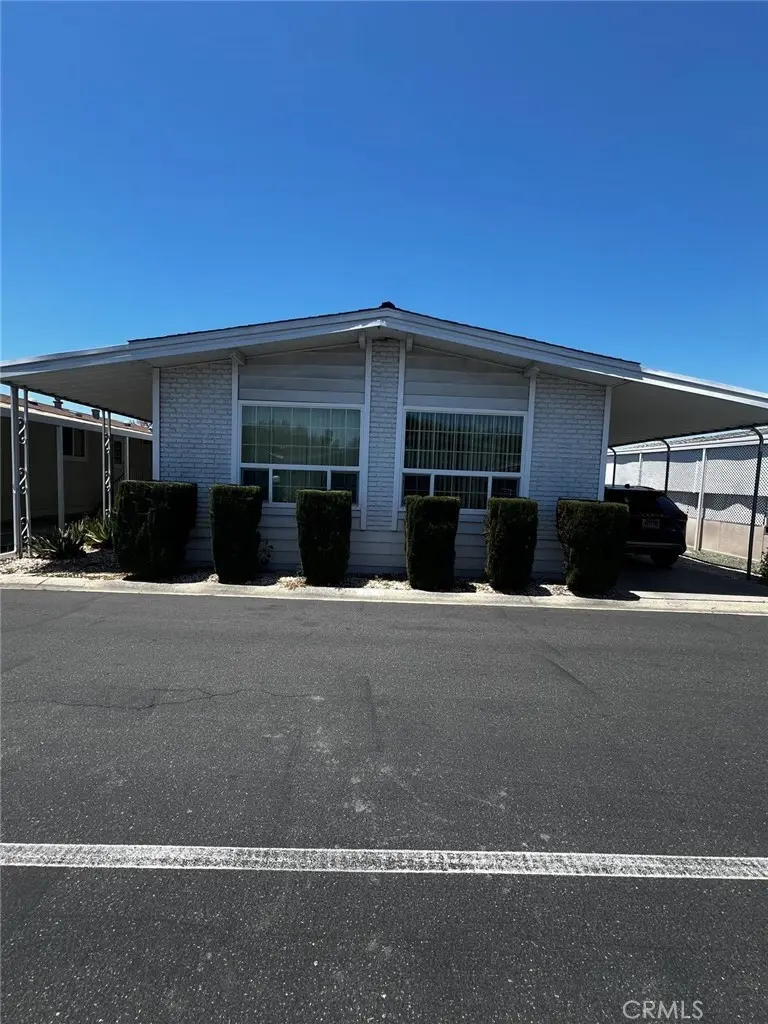
10770 Katella #19 · Garden Grove, CA
Flood risk 1/10 · Minimal
- FEMA flood zone
- X (shaded)
- Chance of flooding over 30 yrs
- 0.0%
- Est. flood insurance / yr
- $507 – $1,088
Fire risk 1/10 · Minimal
- Est. fire insurance / yr
- $659 – $1,223
Heat risk 5/10 · Moderate
- Hot days now (above 90°F)
- 7 days/yr
- Hot days in 30 yrs
- 23 days/yr
Wind risk 1/10 · Minimal
- Chance of severe wind over 30 yrs
- —
Air-quality risk 6/10 · Moderate
- Unhealthy air days now
- 12 days/yr
- Unhealthy air days in 30 yrs
- 13 days/yr
Risk factors via First Street. Map © Google.
Why this score? — see what drove the D grade
The composite is a weighted blend of 9 inputs, each scored 0–100. Each bar is that input's sub-score; the figure is the points it added to the 100-point composite (weight × sub-score).
- Cash flow +18.3/30.0
- DSCR +5.7/10.0
- 1% rule +4.9/10.0
- Schools +4.5/10.0
- Livability +3.3/5.0
- Rent growth +2.6/5.0
- Condition / age +2.5/5.0
- ARV discount +0.0/15.0
- Appreciation +0.0/10.0
$329,900
🖨 Deal sheet 📄 Offer letter ✓ Due diligence
Listing remarks
3 Bedroom, 2 Bathroom mobile home located in Gold Crest Mobile Home Park. New roof, New Windows, Laminate floors, and has Central AC. The Park amenities include a swimming pool, a clubhouse. Walking distance to restaurants and shopping centers.
Key facts
- Central ac
- Laminate floors
- Clubhouse
Tags
Property features AI
Finance
- Other: Living area reported by seller; Lot size source: assessor's data; Park name: Gold Crest Mobile Home Park; Directions: Katella Avenue to Dino Circle
- HOA & community: Land lease in park (land lease amount applies)
Exterior
- Parking: Carport with space for 3 vehicles; Located in Gold Crest Mobile Home Park
- Utilities: Public sewer; District/public water
- Home design: Single-story; Mobile home (24' x 60') — mobile home remains
- Construction: Year built per assessor; Lot is level/flat
- Exterior features: Community pool; Curbs
Interior
- Kitchen: Kitchen (details not provided)
- Bathrooms: 2 full bathrooms
- Heating & cooling: Central cooling
- Interior features: Ground-level entry
- Laundry & utility: Laundry on-site (see remarks for details)
Neighborhood map
What this means for you Summary
Snapshot
- This is a 3-bed/2.0-bath manufactured listed at $330k.
Deal economics
- At list price, monthly cash flow is $299 ($4k/yr) — positive.
- The deal already cash-flows at list — no discount required.
- To meet the 1% rule (rent ≥ 1% of price), the offer needs to be $326k (1.0% below list).
- Recommended offer: $325k (1.5% below list) — sets the bar for market timing.
- Cap rate 7.4% vs local median 1.8% in Garden Grove — top-decile yield for the area; either an underpriced asset or a hidden risk that comps aren't pricing in. Stress-test before assuming the spread holds.
Location & tenants
- Location reads 66/100 on livability (#343 in CA) — a middle-class / working-renter tenant base. Strengths: commute A+, employment A; Watch: schools C-, amenities D+, cost of living F.
- Garden Grove Unified (suburban): math 38% / reading 65% proficiency, ranked #132 of 517 in CA (top 26%) — acceptable for families but not a draw, mixed tenant base, ~2y average lease; 60% free/reduced lunch — lower-income household profile, screen leases tightly.
- Market conditions: Rents flat; 86 active listings in the ZIP; 22 comparable units currently listed for rent nearby; rentals leasing fast (median 2d on market — plan ~1-2 weeks tenant-placement turnaround); solid renter incomes; 6,974 units permitted in Orange County in 2024 (3,839 in 5+ unit buildings).
- At $3,265/mo this rent would consume 51% of the median local household income ($76k/yr) (locally 5698% of renters already pay >50% of income on rent) — very limited rent-growth headroom before tenants either downsize or default.
Forward outlook
- Local home prices are declining (-3.0%/yr); year-one equity from $2k of loan paydown is wiped out by about $10k of value loss. Plan a longer hold.
- Orange County population projected at +14% by 2050 — modest demand growth; plan on rents tracking national, not racing it.
Negotiation context
- It's been on market 21 days — a 2% lower offer ($325k) is reasonable based on typical stale-listing flexibility.
Risks & watch-outs
- Climate carrying-cost: extreme-heat days projected 7→23/yr by 2055 (HVAC capex compounding) — expect insurance premiums to compound above CPI over the hold.
Questions for the listing agent
- Built in 1975 — when were the roof, HVAC, electrical panel, plumbing, and water heater last replaced?
- Is there a deadline driving the sale (1031 exchange, divorce, estate, relocation)? That informs how much negotiation room exists.
- The area grade is low — what's the realistic commute time and amenity access for the typical tenant pool here? Any planned neighborhood developments (good or bad) we should know about?
- What's the average days-on-market for RENTAL listings here right now (not sales)? A rising rental-DOM trend means longer vacancies and softer asking-rent achievability than the comps imply.
- What's the recent tenant-quality profile in this submarket — average credit score on applications, eviction rate, late-payment / NSF rate, and stable-employment percentage? A property-management company in the area should have these aggregated.
- How much new for-sale + rental construction is in the pipeline within 1–3 miles? Heavy new supply typically softens prices + rents 12–24 months out; constrained supply supports both.
Investment metrics
- 1% rule
- 0.99% ✗
- Cap rate
- 7.38%
- Cash-on-cash
- 3.89%
- DSCR
- 1.17
- GRM
- 8.4
CMA / ARV
- ARV (on-the-fly)
- $266,400
- Comps found
- 9
Show comp detail 9 sales within ~0.75 mi
| Address | Dist | Beds/Ba | Sqft | Sold | Price | $/sf | Match |
|---|---|---|---|---|---|---|---|
| 10770 Katella Ave #36 | 0.00mi | 3/2.0 | 1,404 (-2%) | 5mo | $365,000 | $260 | 92 |
| 10770 W Katella Ave #14 | 0.00mi | 2/2.0 (-1) | 1,440 (0%) | 13mo | $230,000 | $160 | 84 |
| 10770 West Katella Ave #23 | 0.02mi | 3/3.0 | 1,440 (0%) | 17mo | $255,000 | $177 | 81 |
| 11301 Euclid St #115 | 0.29mi | 4/2.0 (+1) | 1,500 (+4%) | 1mo | $295,000 | $197 | 74 |
| 11301 Euclid St #19 | 0.29mi | 3/2.0 | 1,534 (+6%) | 20mo | $274,000 | $179 | 59 |
| 11301 Euclid St #91 | 0.29mi | 3/2.0 | 1,540 (+7%) | 22mo | $245,000 | $159 | 56 |
| 11301 Euclid St #72 | 0.29mi | 4/2.0 (+1) | 1,512 (+5%) | 21mo | $279,000 | $185 | 55 |
| 1616 S Euclid St #11 | 0.50mi | 3/2.0 | 1,548 (+8%) | 12mo | $300,000 | $194 | 54 |
| 11301 Euclid St #43 | 0.29mi | 3/2.0 | 1,296 (-10%) | 20mo | $274,000 | $211 | 53 |
Match score weights: distance 35% · size 25% · config 20% · recency 20%. Top-matched comps best support the ARV.
Projected returns pro-forma
-3.0% appreciation · 0.57% rent growth · sell at horizon
- IRR
- -13.0%
- Equity multiple
- 0.54×
- Total profit
- $-42,145
- Equity at exit
- $49,189
- IRR
- -8.2%
- Equity multiple
- 0.54×
- Total profit
- $-42,418
- Equity at exit
- $28,524
Cash invested: $92,372 (down + closing). Projections, not guarantees.
Landlord ↔ Tenant lean methodology
- Overall (STATE)
- 18 Strongly Tenant-Friendly
- State California
- 18 Strongly Tenant-Friendly · D+13
- County
- — inherits STATE
- City
- — inherits STATE
ZIP-level market 92804
- Rents YoY
- 0.6%
- Active inventory
- 86
- Price-to-rent
- 8.4×
Monthly cashflow live
- Estimated rent
- $3,265 high interval (Pro) →
- Mortgage (P&I)
- −$1,730
- Tax est. 1.5%
- −$412 /mo · $4,948/yr
- Insurance
- −$137
- HOA
- −$0
- Vacancy / Maint / Mgmt
- −$686
- Net cashflow
- $299
Break-even live
UW: 25.0% down · 7.5% · 30yr · 1.5% tax · 5.0% vac · 8.0% maint · 8.0% mgmt
Financing live
Cash to close
- Down payment
- $82,475
- Closing costs
- $9,897
- Reserves months
- —
- Total cash needed
- —
Loan-product check · same deal, 3 products live
Conventional
25% down · 7.5% · 30yr
- Down + closing
- —
- Monthly P&I
- —
- Monthly cashflow
- —
- DSCR
- —
- Eligible?
- —
Personal DTI + credit; lowest rate.
DSCR
20% down · 8.5% · 30yr
- Down + closing
- —
- Monthly P&I
- —
- Monthly cashflow
- —
- DSCR
- —
- Eligible?
- —
No personal income docs; deal must DSCR.
Hard money
10% down · 12.0% · 12mo
- Down + closing
- —
- Monthly P&I
- —
- Monthly cashflow
- —
- DSCR
- —
- Eligible?
- —
Short-term bridge; refi at stabilization.
Rent comps 22 comps
| Address | Beds | Baths | Sqft | Rent | $/sqft | DOM | Units | Dist |
|---|---|---|---|---|---|---|---|---|
| 11121 Dino Cir Garden Grove, CA | 3.0 | 2.0 | 1294 | $3,095 | $2.39 | 22d | 1 | 0.15mi |
| 1693 S Heritage Cir Anaheim, CA | 3.0 | 2.0 | 1437 | $3,700 | $2.57 | 1d | 1 | 0.23mi |
| 1854 S Euclid St Anaheim, CA | 2.0–3.0 | 1.0–2.0 | 937 | $3,190 | $3.40 | 1d | 2 | 0.26mi |
| 11092 Dallas Dr Garden Grove, CA | 3.0 | 2.0 | 1310 | $3,950 | $3.02 | 24d | 1 | 0.48mi |
| 1700 W Cerritos Ave Anaheim, CA | 2.0 | 1.5 | 959 | $2,700 | $2.82 | 1d | 2 | 0.51mi |
| 11750 Euclid St Garden Grove, CA | 1.0–2.0 | 1.0–2.0 | 903 | $2,750 | $3.05 | 2d | 2 | 0.82mi |
| 1301 Laster Ave Unit ADU Anaheim, CA | 4.0 | 2.5 | 1200 | $3,600 | $3.00 | 2d | 1 | 0.87mi |
| 1250 S Euclid St Anaheim, CA | 1.0–3.0 | 1.0–2.0 | 935 | $2,600 | $2.78 | 1d | 9 | 0.99mi |
| 10572 Chamberlain Ave Anaheim, CA | 3.0 | 2.0 | 1000 | $3,500 | $3.50 | 10d | 1 | 1.00mi |
| 1371 W Cerritos Ave #86 Anaheim, CA | 3.0 | 2.5 | 1486 | $3,525 | $2.37 | 2d | 1 | 1.01mi |
| 1813 W Ball Rd Anaheim, CA | 2.0 | 1.0 | 900 | $2,495 | $2.77 | 1d | 1 | 1.06mi |
| 1640 W Ball Rd Anaheim, CA | 1.0–2.0 | 1.0–2.0 | 885 | $2,035 | $2.30 | 1d | 2 | 1.07mi |
| 1540 W Ball Rd Anaheim, CA | 2.0 | 1.0–2.0 | 815 | $2,875 | $3.53 | 1d | 1 | 1.09mi |
| 11401 Kearney Way Garden Grove, CA | 3.0 | 2.0 | 1237 | $3,800 | $3.07 | 43d | 1 | 1.10mi |
| 1250 S Brookhurst St Unit 01 Anaheim, CA | 3.0 | 2.0 | 1172 | $3,100 | $2.65 | 1d | 1 | 1.11mi |
| 9661 Maureen Dr Unit F Garden Grove, CA | 2.0 | 1.0 | 900 | $2,495 | $2.77 | 43d | 1 | 1.13mi |
| 915 S Arden Pl Apt 4 Anaheim, CA | 2.0 | 1.0 | 945 | $2,300 | $2.43 | 1d | 1 | 1.19mi |
| 909 S Echo Pl Anaheim, CA | 3.0 | 2.0 | 1669 | $5,200 | $3.12 | 1d | 1 | 1.19mi |
| 12211 Nutwood St Unit NA Garden Grove, CA | 3.0 | 2.0 | 1415 | $3,995 | $2.82 | 43d | 1 | 1.25mi |
| 11092 Jerry Ln Garden Grove, CA | 3.0 | 3.0 | 1780 | $1,350 | $0.76 | 18d | 1 | 1.33mi |
| 955 W Lamark Ln Anaheim, CA | 3.0 | 2.5 | 1333 | $3,400 | $2.55 | 1d | 1 | 1.35mi |
| 10426 Mahalo Way Garden Grove, CA | 3.0 | 2.0 | 1200 | $3,500 | $2.92 | 43d | 1 | 1.38mi |
Listing history 14 events
-
2026-06-18days on market $329,900 Active 21 DOM
-
2026-06-17days on market $329,900 Active 20 DOM
-
2026-06-16days on market $329,900 Active 19 DOM
-
2026-06-15days on market $329,900 Active 18 DOM
-
2026-06-13days on market $329,900 Active 16 DOM
-
2026-06-13days on market $329,900 Active 15 DOM
-
2026-06-09days on market $329,900 Active 12 DOM
-
2026-06-08days on market $329,900 Active 11 DOM
-
2026-06-07days on market $329,900 Active 10 DOM
-
2026-06-04days on market $329,900 Active 7 DOM
-
2026-06-03days on market $329,900 Active 6 DOM
-
2026-06-02days on market $329,900 Active 5 DOM
-
2026-06-01days on market $329,900 Active 4 DOM
-
2026-05-31days on market $329,900 Active 3 DOM
ⓘ Source: listings_history table (triggers on properties + properties_extension) + one-shot
backfill from property_details.listing_events for pre-trigger history.
Climate risk First Street
- Flood 1/10 Low FEMA zone X (shaded) · 0% chance over 30 yrs
- Wildfire 1/10 Low
- Heat 5/10 Major 7 d/yr ≥90°F today · 23 d/yr by 30 yrs out
- Wind 1/10 Low
- Air quality 6/10 Major 12 unhealthy d/yr today · 13 by 30 yrs out
Nearby sold comps map
Loading sold comps map…
Walkable amenities ~0.75 mi
Loading nearby amenities…
Taxation est. · year 1
- Rental income
- $39,176
- − Mortgage interest
- −$18,480
- − Property taxes
- −$4,948
- − Insurance
- −$1,650
- − Repairs & maintenance
- −$3,134
- − Management
- −$3,134
- − Depreciation
- −$9,597
- Taxable loss
- −$1,767
- Est. tax savings @ 24.0%
- +$424
- After-tax cash flow
- $4,015/yr
For passive investors: Depreciation is non-cash, so a rental often shows a tax loss while cash-flowing — sheltering income. Rental losses are passive: they offset passive income freely, and up to $25,000/yr can offset ordinary (W-2) income if you actively participate and your MAGI is under $100k (phasing out to $0 by $150k); unused losses carry forward. On sale, claimed depreciation is recaptured at up to 25%, and gains may owe capital-gains tax (a 1031 exchange can defer both). Figures are a year-1 estimate at your 24.0% rate — not tax advice; consult a CPA.
Schools (NCES district)
- District
- Garden Grove Unified
- NCES district ID
- 0614880
- Math proficiency
- 38% ▼ -14.00%
- Reading proficiency
- 65% ▲ 4.00%
- Median HH income
- $60,089
- Composite
- 44.89/100
- National rank
- #2715
- State rank
- #132 of 517 in CA
Livability — Garden Grove
- Score
- 66/100
- State rank
- #343
- US rank
- #11727
Category grades
Schools grade is shown separately in the Schools card above.
Census & demographics
- Census place
- Garden Grove, CA
- County
- Orange County · 3,096,323 people
- City population
- 157,355
- Metro
- Los Angeles-Long Beach-Anaheim, CA
- Population (ZIP)
- 83,537
- Household income
- $76,141
- Rent vs Own
- Severe rent burden
- 5698.0
Population outlook (Orange County) Hauer SSP2
- Today (2025)
- 3,477,456 people
- By 2030
- 3,613,117 · +3.9%
- By 2040
- 3,835,945 · +10.3%
- By 2050
- 3,968,736 · +14.1%
- By 2075
- 4,097,053 · +17.8%
- By 2100
- 3,903,633 · +12.3%
Race, ethnicity, and origin ACS 2023
- Neighborhood character
- Diverse neighborhood (Simpson 0.68)
- Race & ethnicity
- Hispanic / Latino 46% Asian 27% White 20% Two or more races 17% Black 3% Pacific Islander 1% Native American 1%
- Hispanic origin (detail)
- Mexican 40%
- Common ancestry
- Lithuanian 1%
- Foreign-born
- 40% · Canada, Vietnam, South Korea
- Languages at home
- 37% English-only · Spanish 36% Vietnamese 13% Tagalog/Filipino 4%
Political lean MEDSL · Orange
- 2024 margin
- Toss-up / Even · D 49.7% · R 47.1% · Other 3.2%
- 2008→2024 swing
- +5.2pp toward D · 2008: -2.6pp · 2024: 2.6pp
- All cycles
- 2024: D+2.6 2020: D+9.0 2016: D+7.7 2012: R+8.3 2008: R+2.6
Not yet ingested
- Civics
- —
Market trends
- HPI YoY
- ▼ -875.49%
- Current HPI
- 443.6764
- Rent YoY
- ▲ 0.57%
- Metro
- Los Angeles-Long Beach-Anaheim, CA
- State GDP YoY
- ▲ 3.21%
- F500 in state
- 116
Industry mix (Fortune 500 HQ in CA)
| Industry | F500 HQs | Revenue |
|---|---|---|
| Technology | 27 | $1,492B |
|
||
| Financial Services | 3 | $174B |
|
||
| Retail | 3 | $44B |
|
||
| Insurance | 3 | $26B |
|
||
| Media / Entertainment | 2 | $115B |
|
||
| Pharmaceuticals / Biotech | 2 | $62B |
|
||
Price history
1 event — show timeline
- 2026-05-28 Listed $329,900 CRMLS
Property tax history
-2.6%/yrLatest (2025): $13 · +0.5% YoY. Source: county tax records.
Cash-flow waterfall
monthlySold comps — $/sqft
last 12 mo · ≤1 miLoading sold comps…