245 Golf Dr · Perryman, MD
Flood risk No data
- FEMA flood zone
- —
- Chance of flooding over 30 yrs
- —
- Est. flood insurance / yr
- —
Fire risk No data
- Est. fire insurance / yr
- —
Heat risk No data
- Hot days now (above threshold)
- —
- Hot days in 30 yrs
- —
Wind risk No data
- Chance of severe wind over 30 yrs
- —
Air-quality risk No data
- Unhealthy air days now
- —
- Unhealthy air days in 30 yrs
- —
Risk factors via First Street. Map © Google.
Why this score? — see what drove the B grade
The composite is a weighted blend of 9 inputs, each scored 0–100. Each bar is that input's sub-score; the figure is the points it added to the 100-point composite (weight × sub-score).
- Cash flow +30.0/30.0
- ARV discount +10.3/15.0
- 1% rule +10.0/10.0
- DSCR +10.0/10.0
- Condition / age +4.0/5.0
- Livability +3.2/5.0
- Schools +2.9/10.0
- Rent growth +2.6/5.0
- Appreciation +0.0/10.0
$61,000
🖨 Deal sheet 📄 Offer letter ✓ Due diligence
Listing remarks MLS
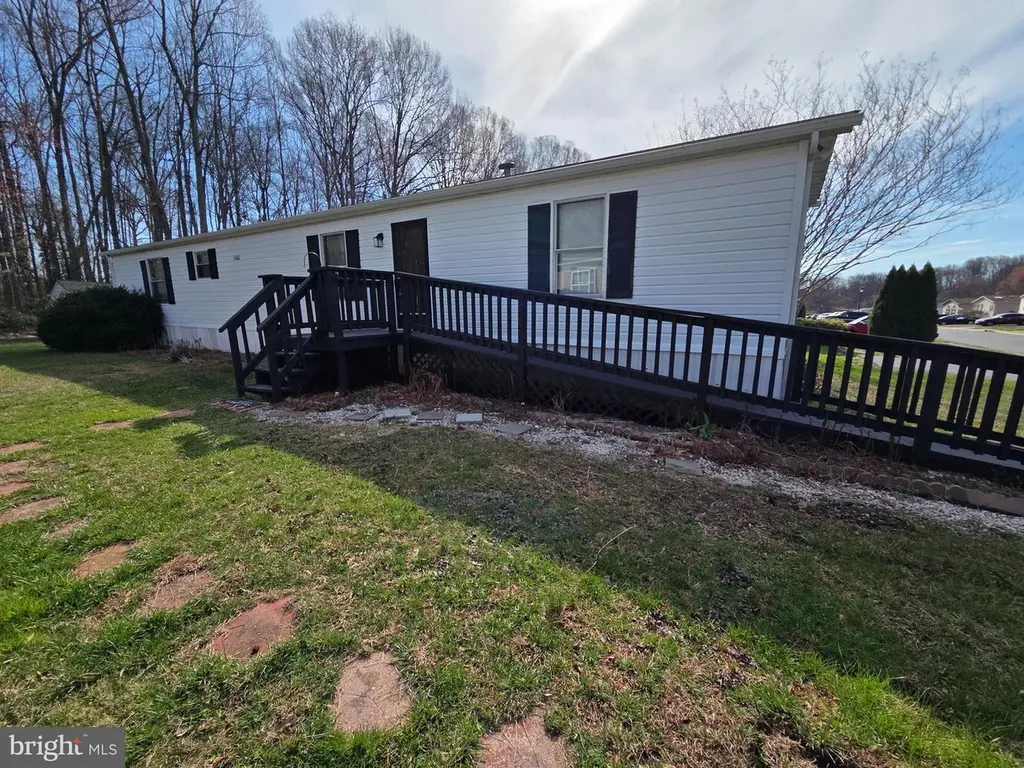
Welcome to this beautifully updated 2-bedroom, 2-bath singlewide home offering comfort, convenience, and modern touches throughout. Step inside to find brand-new flooring that flows seamlessly through the living spaces, along with a fully updated kitchen designed for both style and functionality. This home also includes a washer and dryer, conveniently stored and ready for use. Out back, you’ll find a storage shed perfect for tools, equipment, or extra belongings. Enjoy your morning coffee or unwind in the evening on the spacious front deck, complete with a ramp for easy access. Whether you’re downsizing, starting out, or looking for low-maintenance living, this move-in-ready home is a great opportunity you won’t want to miss! Must be park approved to purchase
Key facts
- Ramp for easy access
- Brand-new flooring
- Storage shed
Tags
Neighborhood map
What this means for you Summary
Snapshot
- This is a 2-bed/2.0-bath single-family listed at $61k. Condition is rated good.
Deal economics
- At list price, monthly cash flow is $1k ($12k/yr) — positive.
- The deal already cash-flows at list — no discount required.
- Meets the 1% rule at list price ($2k rent vs $61k).
- Recommended offer: $57k (6.0% below list) — sets the bar for market timing.
- Cap rate 26.0% vs local median 5.7% in Perryman — top-decile yield for the area; either an underpriced asset or a hidden risk that comps aren't pricing in. Stress-test before assuming the spread holds.
Location & tenants
- Location reads 63/100 on livability (#293 in MD) — a middle-class / working-renter tenant base. Strengths: housing A+, crime A-, cost of living A-; Watch: employment C-, commute D+, schools F.
- Harford County Public Schools (suburban): math 22% / reading 39% proficiency, ranked #9 of 24 in MD (top 38%) — families likely to look elsewhere, expect single-tenant / working-renter base with shorter leases.
- Market conditions: Rents flat; 186 active listings in the ZIP; solid renter incomes; 803 units permitted in Harford County in 2024 (26 in 5+ unit buildings).
Forward outlook
- Local home prices are declining (-3.0%/yr); year-one equity from $422 of loan paydown is wiped out by about $2k of value loss. Plan a longer hold.
- At projected returns (-3.0% appreciation + 0.3% rent growth), your $17k cash investment doubles in ~2 years — after that, you're playing with house money.
Negotiation context
- It's been on market 81 days — a 6% lower offer ($57k) is reasonable based on typical stale-listing flexibility.
Questions for the listing agent
- It's been on market 81 days. Have you received any prior offers? Is the seller open to a 6% concession, seller financing, or rate buy-down credit?
- Why hasn't it sold? Are there any deal-killer items the seller is aware of (foundation, flood, title, zoning, code violations)?
- Is there a deadline driving the sale (1031 exchange, divorce, estate, relocation)? That informs how much negotiation room exists.
- Schools are F-rated, which usually means shorter tenancies and higher turnover. Who's the typical renter profile here, and what's been the actual vacancy rate?
- What's the average days-on-market for RENTAL listings here right now (not sales)? A rising rental-DOM trend means longer vacancies and softer asking-rent achievability than the comps imply.
- What's the recent tenant-quality profile in this submarket — average credit score on applications, eviction rate, late-payment / NSF rate, and stable-employment percentage? A property-management company in the area should have these aggregated.
- How much new for-sale + rental construction is in the pipeline within 1–3 miles? Heavy new supply typically softens prices + rents 12–24 months out; constrained supply supports both.
Investment metrics
- 1% rule
- 2.96% ✓
- Cap rate
- 26.03%
- Cash-on-cash
- 70.48%
- DSCR
- 4.14
- GRM
- 2.8
CMA / ARV
- ARV (median comp)
- $65,000
- List price
- $61,000
- Delta
- -6.15%
- Verdict
- FAIR
- Comps
- 17 within 1.0 mi
Show comp detail 6 sales within ~0.75 mi
| Address | Dist | Beds/Ba | Sqft | Sold | Price | $/sf | Match |
|---|---|---|---|---|---|---|---|
| 228 Poclain Dr | 0.21mi | 2/2.0 | 1,000 (0%) | 1mo | $49,990 | $50 | 90 |
| 230 Poclain | 0.23mi | 2/2.0 | 1,000 (0%) | 1mo | $67,500 | $68 | 89 |
| 201 Forest Grn | 0.16mi | 3/2.0 (+1) | 1,000 (0%) | 1mo | $65,000 | $65 | 87 |
| 223 Poclain | 0.17mi | 2/2.0 | 975 (-2%) | 6mo | $79,500 | $82 | 83 |
| 206 Poclain Rd | 0.17mi | 3/2.0 (+1) | 1,100 (+10%) | 12mo | $54,000 | $49 | 60 |
| 1909 Bruce Rd | 0.11mi | 3/1.5 (+1) | 1,100 (+10%) | 19mo | $53,500 | $49 | 55 |
Match score weights: distance 35% · size 25% · config 20% · recency 20%. Top-matched comps best support the ARV.
Projected returns pro-forma
-3.0% appreciation · 0.28% rent growth · sell at horizon
- IRR
- 66.9%
- Equity multiple
- 3.88×
- Total profit
- $49,226
- Equity at exit
- $9,095
- IRR
- 70.3%
- Equity multiple
- 7.24×
- Total profit
- $106,571
- Equity at exit
- $5,274
Cash invested: $17,080 (down + closing). Projections, not guarantees.
Landlord ↔ Tenant lean methodology
- Overall (STATE)
- 27 Tenant-Leaning
- State Maryland
- 27 Tenant-Leaning · D+14
- County
- — inherits STATE
- City
- — inherits STATE
ZIP-level market 21001
- Home prices YoY
- -30.5%
- Rents YoY
- 0.3%
- Active inventory
- 186
- Price-to-rent
- 2.8×
Monthly cashflow live
- Estimated rent
- $1,803 medium interval (Pro) →
- Mortgage (P&I)
- −$320
- Tax est. 1.5%
- −$76 /mo · $915/yr
- Insurance
- −$25
- HOA
- −$0
- Vacancy / Maint / Mgmt
- −$379
- Net cashflow
- $1,003
Break-even live
UW: 25.0% down · 7.5% · 30yr · 1.5% tax · 5.0% vac · 8.0% maint · 8.0% mgmt
Financing live
Cash to close
- Down payment
- $15,250
- Closing costs
- $1,830
- Reserves months
- —
- Total cash needed
- —
Loan-product check · same deal, 3 products live
Conventional
25% down · 7.5% · 30yr
- Down + closing
- —
- Monthly P&I
- —
- Monthly cashflow
- —
- DSCR
- —
- Eligible?
- —
Personal DTI + credit; lowest rate.
DSCR
20% down · 8.5% · 30yr
- Down + closing
- —
- Monthly P&I
- —
- Monthly cashflow
- —
- DSCR
- —
- Eligible?
- —
No personal income docs; deal must DSCR.
Hard money
10% down · 12.0% · 12mo
- Down + closing
- —
- Monthly P&I
- —
- Monthly cashflow
- —
- DSCR
- —
- Eligible?
- —
Short-term bridge; refi at stabilization.
Listing history 14 events
-
2026-06-18days on market $61,000 Active 81 DOM
-
2026-06-17days on market $61,000 Active 80 DOM
-
2026-06-16days on market $61,000 Active 79 DOM
-
2026-06-15days on market $61,000 Active 78 DOM
-
2026-06-13pricedays on market $61,000 Active 76 DOM
-
2026-06-09days on market $64,000 Active 72 DOM
-
2026-06-08days on market $64,000 Active 71 DOM
-
2026-06-07days on market $64,000 Active 70 DOM
-
2026-06-04days on market $64,000 Active 67 DOM
-
2026-06-03days on market $64,000 Active 66 DOM
-
2026-06-02days on market $64,000 Active 65 DOM
-
2026-06-01days on market $64,000 Active 64 DOM
-
2026-05-31days on market $64,000 Active 63 DOM
-
2026-03-29$64,000 Active 789-char remark
Show marketing remark (789 chars)
Welcome to this beautifully updated 2-bedroom, 2-bath singlewide home offering comfort, convenience, and modern touches throughout. Step inside to find brand-new flooring that flows seamlessly through the living spaces, along with a fully updated kitchen designed for both style and functionality. This home also includes a washer and dryer, conveniently stored and ready for use. Out back, you’ll find a storage shed perfect for tools, equipment, or extra belongings. Enjoy your morning coffee or unwind in the evening on the spacious front deck, complete with a ramp for easy access. Whether you’re downsizing, starting out, or looking for low-maintenance living, this move-in-ready home is a great opportunity you won’t want to miss! Must be park approved to purchase
ⓘ Source: listings_history table (triggers on properties + properties_extension) + one-shot
backfill from property_details.listing_events for pre-trigger history.
Nearby sold comps map
Loading sold comps map…
Walkable amenities ~0.75 mi
Loading nearby amenities…
Taxation est. · year 1
- Rental income
- $21,641
- − Mortgage interest
- −$3,417
- − Property taxes
- −$915
- − Insurance
- −$305
- − Repairs & maintenance
- −$1,731
- − Management
- −$1,731
- − Depreciation
- −$1,775
- Taxable income
- $11,767
- Est. tax owed @ 24.0%
- −$2,824
- After-tax cash flow
- $9,213/yr
For passive investors: Depreciation is non-cash, so a rental often shows a tax loss while cash-flowing — sheltering income. Rental losses are passive: they offset passive income freely, and up to $25,000/yr can offset ordinary (W-2) income if you actively participate and your MAGI is under $100k (phasing out to $0 by $150k); unused losses carry forward. On sale, claimed depreciation is recaptured at up to 25%, and gains may owe capital-gains tax (a 1031 exchange can defer both). Figures are a year-1 estimate at your 24.0% rate — not tax advice; consult a CPA.
Condition & rehab AI · 12 photos
This move-in-ready singlewide home features updated interiors and a well-maintained exterior, making it an attractive option for buyers or renters.
Value-add opportunities
- Both Paint exterior — Enhances curb appeal and value
- Both Trim bushes — Improves landscaping and curb appeal
Renovation cost estimate screening
Value-add ROI direction
- Both Paint exterior — Enhances curb appeal and value ↑
- Both Trim bushes — Improves landscaping and curb appeal ↑
ⓘ Cost ranges are severity-bucket heuristics (US national rule-of-thumb). Get contractor quotes + a written scope before underwriting a rehab budget.
Schools (NCES district)
- District
- Harford County Public Schools
- NCES district ID
- 2400390
- Math proficiency
- 22% ▼ -23.00%
- Reading proficiency
- 39% ▼ -12.00%
- Median HH income
- $79,569
- Composite
- 29.38/100
- National rank
- #6527
- State rank
- #9 of 24 in MD
Livability — Perryman
- Score
- 63/100
- State rank
- #293
- US rank
- #15253
Category grades
Schools grade is shown separately in the Schools card above.
Census & demographics
- Census place
- Perryman, MD
- County
- Harford County · 198,512 people
- City population
- 75
- Metro
- Baltimore-Columbia-Towson, MD
- Population (ZIP)
- 27,168
- Household income
- $83,238
- Rent vs Own
- Severe rent burden
- 736.0
Population outlook (Harford County) Hauer SSP2
- Today (2025)
- 262,292 people
- By 2030
- 266,437 · +1.6%
- By 2040
- 269,954 · +2.9%
- By 2050
- 265,659 · +1.3%
- By 2075
- 252,886 · -3.6%
- By 2100
- 224,014 · -14.6%
Race, ethnicity, and origin ACS 2023
- Neighborhood character
- Diverse neighborhood (Simpson 0.62)
- Race & ethnicity
- White 54% Black 28% Hispanic / Latino 9% Two or more races 9% Asian 3%
- Hispanic origin (detail)
- Mexican 3% Puerto Rican 2% Dominican 1%
- Common ancestry
- Romanian 3% Slovak 1% Scotch-Irish 1%
- Foreign-born
- 8% · Canada, China, South Korea
- Languages at home
- 89% English-only · Spanish 4% Other Indo-European 1% German/W. Germanic 1%
Political lean MEDSL · Harford
- 2024 margin
- R (+13.8) · D 41.9% · R 55.7% · Other 2.4%
- 2008→2024 swing
- +5.0pp toward D · 2008: -18.8pp · 2024: -13.8pp
- All cycles
- 2024: R+13.8 2020: R+12.0 2016: R+24.5 2012: R+19.5 2008: R+18.8
Not yet ingested
- Civics
- —
Market trends
- HPI YoY
- ▼ -108.65%
- Current HPI
- 247.668
- Rent YoY
- ▲ 0.28%
- Metro
- Baltimore-Columbia-Towson, MD
- State GDP YoY
- ▲ 2.97%
- F500 in state
- 12
Industry mix (Fortune 500 HQ in MD)
| Industry | F500 HQs | Revenue |
|---|---|---|
| Aerospace / Defense | 1 | $71B |
|
||
| Utilities | 1 | $25B |
|
||
| Hotels | 1 | $24B |
|
||
| Consumer Goods | 1 | $7B |
|
||
| Real Estate | 1 | $6B |
|
||
| Chemicals | 1 | $2B |
|
||
Price history
1 event — show timeline
- 2026-03-29 Listed $64,000 BRIGHT MLS
Cash-flow waterfall
monthlySold comps — $/sqft
last 12 mo · ≤1 miLoading sold comps…