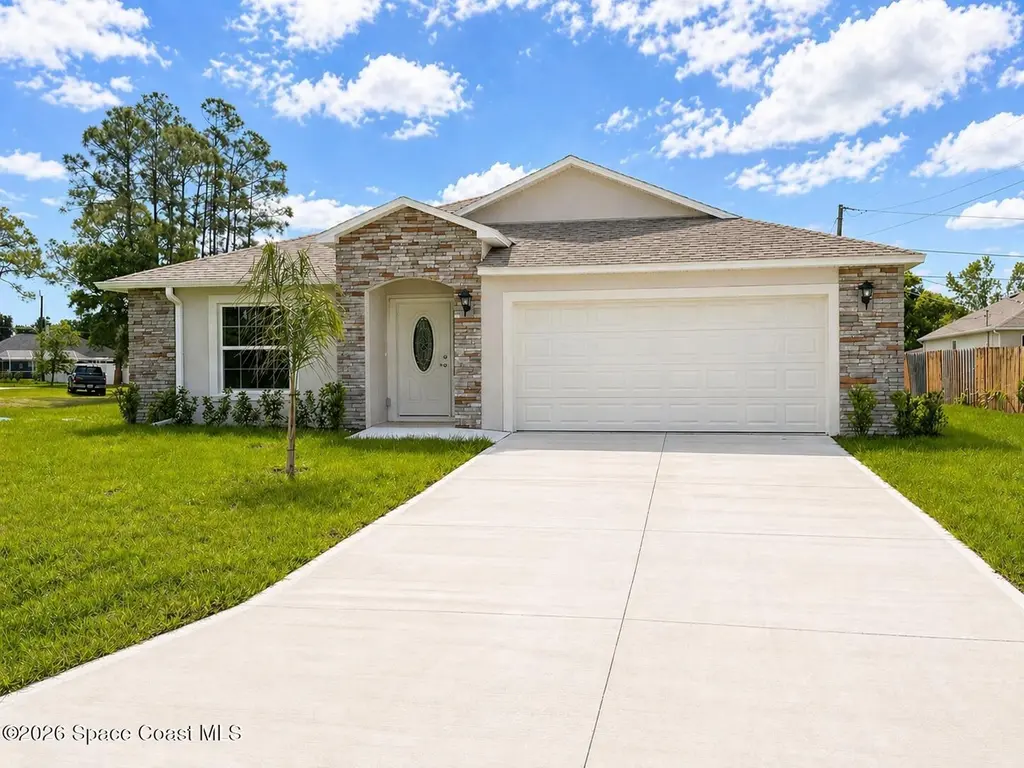
694 Airoso Rd SE · Palm Bay, FL
Flood risk 1/10 · Minimal
- FEMA flood zone
- X (unshaded)
- Chance of flooding over 30 yrs
- 0.0%
- Est. flood insurance / yr
- $507 – $1,088
Fire risk 1/10 · Minimal
- Est. fire insurance / yr
- $947 – $1,759
Heat risk 9/10 · Severe
- Hot days now (above 106°F)
- 7 days/yr
- Hot days in 30 yrs
- 22 days/yr
Wind risk 10/10 · Severe
- Chance of severe wind over 30 yrs
- 99.0%
Air-quality risk 1/10 · Minimal
- Unhealthy air days now
- 0 days/yr
- Unhealthy air days in 30 yrs
- 0 days/yr
Risk factors via First Street. Map © Google.
Why this score? — see what drove the D- grade
The composite is a weighted blend of 9 inputs, each scored 0–100. Each bar is that input's sub-score; the figure is the points it added to the 100-point composite (weight × sub-score).
- Appreciation +10.0/10.0
- ARV discount +7.5/15.0
- Cash flow +5.3/30.0
- Schools +4.7/10.0
- Livability +3.6/5.0
- Rent growth +3.4/5.0
- Condition / age +2.5/5.0
- 1% rule +1.0/10.0
- DSCR +0.0/10.0
$428,900
🖨 Deal sheet (PDF) 📄 Offer letter ✓ Due diligence
Listing remarks MLS
Build your dream home on this city water/septic corner lot available in South East Palm Bay. The lot is on . 41 acres! Drive by today!
Key facts
- Quartz countertops
- Stainless appliances
- Soft-close cabinetry
Tags
Property features AI
Exterior
- Parking: Attached 2-car garage
- Utilities: Aerobic septic system; Electricity connected; Water connected
- Home design: Single family residence; Faces southwest; New construction
- Construction: Built with block, stone, and stucco; Shingle roof
- Exterior features: Covered, screened rear porch; Front porch
Interior
- Kitchen: Dishwasher; Electric range; Microwave; Refrigerator
- Bedrooms: 4 bedrooms
- Flooring: Laminate; Tile
- Bathrooms: 3 full bathrooms
- Heating & cooling: Central heating (electric); Central air (electric)
- Interior features: Breakfast bar; Eat-in kitchen; Entrance foyer; Primary bathroom with shower (no tub); Walk-in closets
- Laundry & utility: Washer hookup; Electric dryer hookup
Neighborhood map
What this means for you Summary
Snapshot
- This is a 4-bed/3.0-bath land listed at $429k.
Deal economics
- At list price, monthly cash flow is $-946 ($-11k/yr) — negative.
- To cash-flow at today's rent, offer at most $292k (31.9% below list).
- To meet the 1% rule (rent ≥ 1% of price), the offer needs to be $255k (40.4% below list).
- Recommended offer: $255k (40.4% below list) — sets the bar for 1% rule.
Location & tenants
- Location reads 72/100 on livability (#366 in FL) — a middle-class / working-renter tenant base. Strengths: cost of living A+, housing A+; Watch: employment D+, amenities F, health & safety D-.
- Brevard (suburban): math 53% / reading 57% proficiency, ranked #19 of 73 in FL (top 26%) — acceptable for families but not a draw, mixed tenant base, ~2y average lease.
- Zoned schools: John F. Turner Senior Elementary School (math 38% / reading 43%, grade F, #1,471 of 2,144 statewide, top 69%, 543 students, 69% FRL); Southwest Middle School (math 40% / reading 39%, grade F, #373 of 571 statewide, top 66%, 920 students, 58% FRL); Bayside High School (math 27% / reading 40%, grade F, #400 of 667 statewide, top 61%, 1,854 students, 51% FRL) — zoned schools average 59% FRL vs 43% district-wide (16 pts higher); higher-poverty schools than district average — tighter screening recommended.
- Zoned-school proficiency averages 38% at this address vs 55% district-wide (-17 pts) — the specific schools serving this property underperform the Brevard average; the district grade overstates school quality for this exact location.
- Market conditions: Rents rising (+3.7%/yr); 1123 active listings in the ZIP; 18 comparable units currently listed for rent nearby; rentals at typical pace (median 23d on market — plan ~3-4 weeks tenant-placement turnaround); solid renter incomes; 4,602 units permitted in Brevard County in 2024 (702 in 5+ unit buildings).
- This rent runs 38% of the median local income ($80k/yr) — at the standard rent-burdened threshold; future hikes will face affordability resistance.
Forward outlook
- In year one you build about $46k of equity ($3k loan paydown + $43k appreciation (10.0% local appreciation)).
- Brevard County population projected at +15% by 2050 — modest demand growth; plan on rents tracking national, not racing it.
- By year 2, paydown + projected appreciation supports a ~$74k cash-out refi (75% LTV) — recoverable capital for the next deal without selling this one.
Negotiation context
- It's been on market 15 days — a 2% lower offer ($422k) is reasonable based on typical stale-listing flexibility.
- 3 sale attempts since 20y ago with the ask held roughly flat each time — persistent listings suggest the price (not the market) is what's stuck; bring a comps-based counter.
- Current owner paid $58k; list at $429k implies a 633% gain — meaningful room to come down on a strong offer.
Risks & watch-outs
- Climate carrying-cost: severe wind risk, 99% chance of damaging wind over 30y; extreme-heat days projected 7→22/yr by 2055 (HVAC capex compounding) — expect insurance premiums to compound above CPI over the hold.
Questions for the listing agent
- What do current leases actually rent for vs. the listed asking? Can we see a recent rent roll and the last 12 months of T-12 income?
- Is there a deadline driving the sale (1031 exchange, divorce, estate, relocation)? That informs how much negotiation room exists.
- The area grade is low — what's the realistic commute time and amenity access for the typical tenant pool here? Any planned neighborhood developments (good or bad) we should know about?
- What's the average days-on-market for RENTAL listings here right now (not sales)? A rising rental-DOM trend means longer vacancies and softer asking-rent achievability than the comps imply.
- What's the recent tenant-quality profile in this submarket — average credit score on applications, eviction rate, late-payment / NSF rate, and stable-employment percentage? A property-management company in the area should have these aggregated.
- How much new for-sale + rental construction is in the pipeline within 1–3 miles? Heavy new supply typically softens prices + rents 12–24 months out; constrained supply supports both.
Investment metrics
- 1% rule
- 0.60% ✗
- Cap rate
- 3.65%
- Cash-on-cash
- -9.45%
- DSCR
- 0.58
- GRM
- 14.0
CMA / ARV
No comps found within radius.
Projected returns pro-forma
10.0% appreciation · 3.67% rent growth · sell at horizon
- IRR
- 17.8%
- Equity multiple
- 2.46×
- Total profit
- $175,128
- Equity at exit
- $386,387
- IRR
- 16.8%
- Equity multiple
- 5.72×
- Total profit
- $566,783
- Equity at exit
- $833,258
Cash invested: $120,092 (down + closing). Projections, not guarantees.
Landlord ↔ Tenant lean methodology
- Overall (STATE)
- 87 Strongly Landlord-Friendly
- State Florida
- 87 Strongly Landlord-Friendly · R+3
- County
- — inherits STATE
- City
- — inherits STATE
ZIP-level market 32909
- Home prices YoY
- 6.0%
- Rents YoY
- 3.7%
- Active inventory
- 1123
- Price-to-rent
- 14.0×
Monthly cashflow live
- Estimated rent
- $2,555 high interval (Pro) →
- Mortgage (P&I)
- −$2,249
- Tax est. 1.5%
- −$536 /mo · $6,434/yr
- Insurance
- −$179
- HOA
- −$0
- Vacancy / Maint / Mgmt
- −$537
- Net cashflow
- $-946
Break-even live
Sensitivity live
| Price | -10% $-649 | -5% $-798 | +0% $-946 | +5% $-1,094 | +10% $-1,242 |
|---|---|---|---|---|---|
| Rent | -10% $-1,148 | -5% $-1,047 | +0% $-946 | +5% $-845 | +10% $-744 |
| Rate | -1.0pp $-730 | -0.5pp $-837 | base $-946 | +0.5pp $-1,057 | +1.0pp $-1,170 |
UW: 25.0% down · 7.5% · 30yr · 1.5% tax · 5.0% vac · 8.0% maint · 8.0% mgmt
Financing live
Cash to close
- Down payment
- $107,225
- Closing costs
- $12,867
- Reserves months
- —
- Total cash needed
- —
Loan-product check · same deal, 3 products live
Conventional
25% down · 7.5% · 30yr
- Down + closing
- —
- Monthly P&I
- —
- Monthly cashflow
- —
- DSCR
- —
- Eligible?
- —
Personal DTI + credit; lowest rate.
DSCR
20% down · 8.5% · 30yr
- Down + closing
- —
- Monthly P&I
- —
- Monthly cashflow
- —
- DSCR
- —
- Eligible?
- —
No personal income docs; deal must DSCR.
Hard money
10% down · 12.0% · 12mo
- Down + closing
- —
- Monthly P&I
- —
- Monthly cashflow
- —
- DSCR
- —
- Eligible?
- —
Short-term bridge; refi at stabilization.
Rent comps 18 comps
| Address | Beds | Baths | Sqft | Rent | $/sqft | DOM | Units | Dist |
|---|---|---|---|---|---|---|---|---|
| 647 Airoso Rd SE Palm Bay, FL | 4.0 | 3.0 | 2365 | $2,900 | $1.23 | 15d | 1 | 0.08mi |
| 1129 Colonial Ave SE Palm Bay, FL | 4.0 | 3.0 | 2008 | $2,500 | $1.25 | 21d | 1 | 0.15mi |
| 1290 Sail Ct SE Palm Bay, FL | 3.0 | 2.0 | 1509 | $1,945 | $1.29 | 25d | 1 | 0.42mi |
| 1224 Buffing Cir SE Palm Bay, FL | 4.0 | 2.0 | 2233 | $2,395 | $1.07 | 16d | 1 | 0.42mi |
| 822 Seven Gables Cir SE Palm Bay, FL | 3.0 | 2.0 | 1474 | $1,835 | $1.24 | 25d | 1 | 0.57mi |
| 818 Seven Gables Cir SE Palm Bay, FL | 3.0 | 2.0 | 1490 | $1,795 | $1.20 | 25d | 1 | 0.59mi |
| 2910 Emerson Dr SE Palm Bay, FL | 3.0 | 2.0 | 1700 | $1,950 | $1.15 | 16d | 1 | 0.88mi |
| 1255 Wadsworth St SE Unit 1255 Palm Bay, FL | 3.0 | 3.0 | 1747 | $2,350 | $1.35 | 21d | 1 | 1.02mi |
| 907 Algardi St SE Palm Bay, FL | 4.0 | 2.0 | 1943 | $2,330 | $1.20 | 25d | 1 | 1.04mi |
| 1517 Wacker Ave SE Palm Bay, FL | 4.0 | 2.0 | 1775 | $2,200 | $1.24 | 25d | 1 | 1.09mi |
| 885 Talmadge Ave SE Palm Bay, FL | 3.0 | 2.0 | 1787 | $2,300 | $1.29 | 23d | 1 | 1.10mi |
| 1210 Vandalia Ave SE Palm Bay, FL | 4.0 | 2.0 | 1833 | $2,050 | $1.12 | 16d | 1 | 1.18mi |
| 1150 Raoul St SE Palm Bay, FL | 4.0 | 2.0 | 1787 | $2,300 | $1.29 | 25d | 1 | 1.21mi |
| 309 Cactus St SE Palm Bay, FL | 4.0 | 2.0 | 1846 | $2,195 | $1.19 | 16d | 1 | 1.21mi |
| 721 Taluga Ave SE Palm Bay, FL | 3.0 | 2.0 | 1556 | $1,800 | $1.16 | 25d | 1 | 1.23mi |
| 1150 Tiger St SE Palm Bay, FL | 3.0 | 2.0 | 1690 | $1,950 | $1.15 | 16d | 1 | 1.32mi |
| 1523 Elmhurst Cir SE Palm Bay, FL | 3.0 | 2.0 | 2028 | $2,325 | $1.15 | 25d | 1 | 1.40mi |
| 490 Hatcher St SE Palm Bay, FL | 4.0 | 2.0 | 1833 | $2,150 | $1.17 | 23d | 1 | 1.43mi |
Listing history 10 events
-
2026-05-14status Pending
-
2026-04-28$428,900 Active
-
2025-04-10soldstatus $58,500
-
2022-10-27soldstatus $70,000
-
2022-10-26soldstatus $70,000 Closed 134-char remark
Show marketing remark (134 chars)
Build your dream home on this city water/septic corner lot available in South East Palm Bay. The lot is on . 41 acres! Drive by today!
-
2022-10-10historical Contingent 134-char remark
Show marketing remark (134 chars)
Build your dream home on this city water/septic corner lot available in South East Palm Bay. The lot is on . 41 acres! Drive by today!
-
2022-09-21$74,500 Active 134-char remark
Show marketing remark (134 chars)
Build your dream home on this city water/septic corner lot available in South East Palm Bay. The lot is on . 41 acres! Drive by today!
-
2021-02-12soldstatus $29,000
-
2016-08-16historical 101-char remark
Show marketing remark (101 chars)
UNIT 11.Great Price for oversized lot . 41 Acres for a Beautiful home or investment. Won t last long!
-
2006-02-27$59,900 101-char remark
Show marketing remark (101 chars)
UNIT 11.Great Price for oversized lot . 41 Acres for a Beautiful home or investment. Won t last long!
ⓘ Source: listings_history table (triggers on properties + properties_extension) + one-shot
backfill from property_details.listing_events for pre-trigger history.
Climate risk First Street
- Flood 1/10 Low FEMA zone X (unshaded) · 0% chance over 30 yrs
- Wildfire 1/10 Low
- Heat 9/10 Extreme 7 d/yr ≥106°F today · 22 d/yr by 30 yrs out
- Wind 10/10 Extreme 99% chance of damaging wind over 30 yrs
- Air quality 1/10 Low 0 unhealthy d/yr today · 0 by 30 yrs out
Nearby sold comps map
Loading sold comps map…
Walkable amenities ~0.75 mi
Loading nearby amenities…
Taxation est. · year 1
- Rental income
- $30,658
- − Mortgage interest
- −$24,025
- − Property taxes
- −$6,434
- − Insurance
- −$2,144
- − Repairs & maintenance
- −$2,453
- − Management
- −$2,453
- − Depreciation
- −$12,477
- Taxable loss
- −$19,328
- Est. tax savings @ 24.0%
- +$4,639
- After-tax cash flow
- $-6,710/yr
For passive investors: Depreciation is non-cash, so a rental often shows a tax loss while cash-flowing — sheltering income. Rental losses are passive: they offset passive income freely, and up to $25,000/yr can offset ordinary (W-2) income if you actively participate and your MAGI is under $100k (phasing out to $0 by $150k); unused losses carry forward. On sale, claimed depreciation is recaptured at up to 25%, and gains may owe capital-gains tax (a 1031 exchange can defer both). Figures are a year-1 estimate at your 24.0% rate — not tax advice; consult a CPA.
Schools (NCES district)
- District
- Brevard
- NCES district ID
- 1200150
- Math proficiency
- 53% ▼ -9.00%
- Reading proficiency
- 57% ▼ -4.00%
- Median HH income
- $49,426
- Composite
- 46.86/100
- National rank
- #2370
- State rank
- #19 of 73 in FL
Livability — Palm Bay
- Score
- 72/100
- State rank
- #366
- US rank
- #6458
Category grades
Schools grade is shown separately in the Schools card above.
Census & demographics
- Census place
- Palm Bay, FL
- County
- Brevard County · 602,871 people
- City population
- 132,211
- Metro
- Palm Bay-Melbourne-Titusville, FL
- Population (ZIP)
- 41,804
- Household income
- $79,977
- Rent vs Own
- Severe rent burden
- 697.0
Population outlook (Brevard County) Hauer SSP2
- Today (2025)
- 623,254 people
- By 2030
- 648,420 · +4.0%
- By 2040
- 690,009 · +10.7%
- By 2050
- 715,669 · +14.8%
- By 2075
- 775,744 · +24.5%
- By 2100
- 776,687 · +24.6%
Race, ethnicity, and origin ACS 2023
- Neighborhood character
- Diverse neighborhood (Simpson 0.70)
- Race & ethnicity
- White 46% Black 21% Hispanic / Latino 20% Two or more races 16% Asian 4%
- Hispanic origin (detail)
- Mexican 2% Puerto Rican 8% Cuban 5%
- Common ancestry
- Hispanic 3% Slovak 2% Lithuanian 2%
- Foreign-born
- 17% · Canada, China, Jamaica
- Languages at home
- 84% English-only · Spanish 9% French/Haitian/Cajun 4% Chinese 1%
Political lean MEDSL · Brevard
- 2024 margin
- Strong R (+20.8) · D 39.1% · R 59.9% · Other 1.0%
- 2008→2024 swing
- -10.4pp toward R · 2008: -10.4pp · 2024: -20.8pp
- All cycles
- 2024: R+20.8 2020: R+16.4 2016: R+19.8 2012: R+12.7 2008: R+10.4
Not yet ingested
- Civics
- —
Market trends
- HPI YoY
- ▲ 18.81%
- Current HPI
- 330.8595
- Rent YoY
- ▲ 3.67%
- Metro
- Palm Bay-Melbourne-Titusville, FL
- State GDP YoY
- ▲ 3.28%
- F500 in state
- 36
Industry mix (Fortune 500 HQ in FL)
| Industry | F500 HQs | Revenue |
|---|---|---|
| Industrial Technology | 2 | $29B |
|
||
| Insurance | 2 | $17B |
|
||
| Retail | 1 | $60B |
|
||
| Technology Distribution | 1 | $58B |
|
||
| Homebuilding | 1 | $35B |
|
||
| Technology Manufacturing | 1 | $35B |
|
||
Price history
+616.0% since first listed10 events — show timeline
- 2026-05-14 Pending — SCMLS
- 2026-04-28 Listed $428,900 SCMLS
- 2025-04-10 Sold (Public Records) $58,500 Public Records
- 2022-10-27 Sold (Public Records) $70,000 Public Records
- 2022-10-26 Sold (MLS) $70,000 SCMLS
- 2022-10-10 Contingent — SCMLS
- 2022-09-21 Listed $74,500 SCMLS
- 2021-02-12 Sold (Public Records) $29,000 Public Records
- 2016-08-16 Listing Removed — SCMLS
- 2006-02-27 Listed $59,900 SCMLS
Property tax history
+20.7%/yrLatest (2025): $759 · +11.4% YoY. Source: county tax records.
Cash-flow waterfall
monthlySold comps — $/sqft
last 12 mo · ≤1 miLoading sold comps…