 🌊 Lakefront
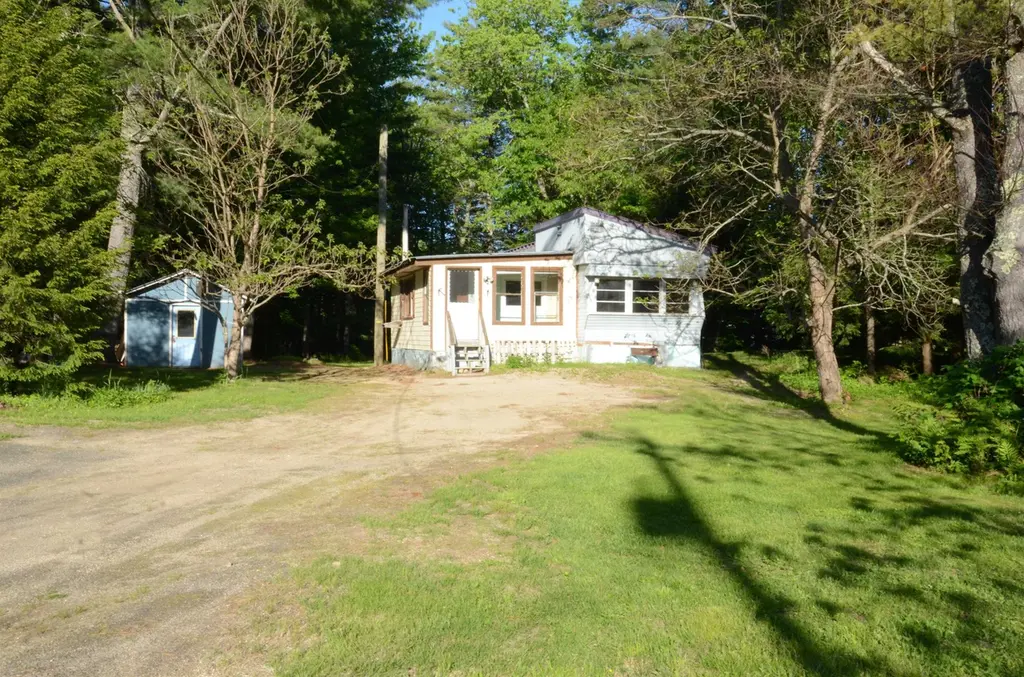
2070 Route 16 · Tamworth, NH
Flood risk 1/10 · Minimal
- FEMA flood zone
- X (unshaded)
- Chance of flooding over 30 yrs
- 0.0%
- Est. flood insurance / yr
- $473 – $860
Fire risk 3/10 · Minor
- Est. fire insurance / yr
- $507 – $941
Heat risk 3/10 · Minor
- Hot days now (above 93°F)
- 7 days/yr
- Hot days in 30 yrs
- 17 days/yr
Wind risk 3/10 · Minor
- Chance of severe wind over 30 yrs
- 6.0%
Air-quality risk 1/10 · Minimal
- Unhealthy air days now
- 0 days/yr
- Unhealthy air days in 30 yrs
- 0 days/yr
Risk factors via First Street. Map © Google.
Why this score? — see what drove the D+ grade
The composite is a weighted blend of 9 inputs, each scored 0–100. Each bar is that input's sub-score; the figure is the points it added to the 100-point composite (weight × sub-score).
- ARV discount +13.9/15.0
- Cash flow +10.7/30.0
- Appreciation +7.2/10.0
- 1% rule +3.1/10.0
- DSCR +3.1/10.0
- Rent growth +2.5/5.0
- Schools +2.5/10.0
- Livability +2.5/5.0
- Condition / age +1.0/5.0
$160,000
🖨 Deal sheet 📄 Offer letter ✓ Due diligence
Listing remarks
Nestled behind the trees, this 2 bedroom 1974 Holly Park Mobile Home offers privacy and convenience. Sitting on 3.3 wooded acres along Route 16 in Ossipee, It includes a sizable addition as a separate living area with propane fireplace. The 12’ by 20’ shed has electricity for a workshop or additional storage. This property presents a rare opportunity to invest in a generously sized parcel in the desirable Lakes Region area. Its convenient location provides easy access to the surrounding lakes, shops and trails. Only 13 miles to King Pine Ski Area and 21 miles to North Conway, making it well-suited for both year-round living and recreational use. The parcel offers a private, tree
Key facts
- Propane fireplace
- Shed has electricity
- Sizable addition
Tags
Property features AI
Finance
- Other: Surveyed
Exterior
- Parking: Right-of-way (ROW) driveway
- Utilities: On-site well needed for water; Septic system with leach field (private); 100 Amp electric service with circuit breaker panel; High-speed internet available; Other utilities available
- Home design: Manufactured/Mobile home; Single-story (all listed rooms on 1st level); Metal roof
- Construction: Built in 1974; Aluminum siding construction
- Exterior features: Level, wooded lot; Near skiing and snowmobile trails; Rural setting; Easements present; Right-of-way driveway access; Road frontage on a public maintained road (approx. 194' frontage)
Interior
- Kitchen: Kitchen (1st level) — 11 x 11
- Bedrooms: Bedroom 1 (1st level) — 8 x 6; Bedroom 2 (1st level) — 11 x 11
- Bathrooms: 1 full bathroom (1st level) — 8 x 6
- Heating & cooling: Propane heating with forced air; Cooling: Other
- Interior features: Six total rooms; Great room; Dining room
Neighborhood map
What this means for you Summary
Snapshot
- This is a 2-bed/1.0-bath manufactured listed at $160k. Condition is rated poor.
Deal economics
- At list price, monthly cash flow is $-77 ($-929/yr) — negative.
- To cash-flow at today's rent, offer at most $149k (7.0% below list).
- To meet the 1% rule (rent ≥ 1% of price), the offer needs to be $130k (18.6% below list).
- Recommended offer: $130k (18.6% below list) — sets the bar for 1% rule.
Location & tenants
- Location reads: area grade D — affects rentability + tenant quality, not the cash-flow math above.
- Tamworth School District (rural): math 25% / reading 25% proficiency, ranked #164 of 171 in NH (top 96%) — low school quality limits family demand, transient renter base, plan for 1-2y turnover.
- Market conditions: 4 active listings in the ZIP; 357 units permitted in Carroll County in 2024 (0 in 5+ unit buildings).
Forward outlook
- In year one you build about $8k of equity ($1k loan paydown + $7k appreciation (4.4% local appreciation)).
- Carroll County population projected at -27% by 2050 — secular population decline; favor cash flow + early exit over multi-decade hold.
- At projected returns (4.4% appreciation + 3.0% rent growth), your $45k cash investment doubles in ~6 years — after that, you're playing with house money.
- By year 5, paydown + projected appreciation supports a ~$35k cash-out refi (75% LTV) — recoverable capital for the next deal without selling this one.
Negotiation context
- Only 14 days on market — expect competitive offers; lowballing is unlikely to land.
Questions for the listing agent
- What do current leases actually rent for vs. the listed asking? Can we see a recent rent roll and the last 12 months of T-12 income?
- Have any recent inspections been done? Can we get a copy of the seller's disclosures and any deferred-maintenance estimates?
- Built in 1974 — when were the roof, HVAC, electrical panel, plumbing, and water heater last replaced?
- Is there a deadline driving the sale (1031 exchange, divorce, estate, relocation)? That informs how much negotiation room exists.
- The area grade is low — what's the realistic commute time and amenity access for the typical tenant pool here? Any planned neighborhood developments (good or bad) we should know about?
- This sits on a lake — are riparian / water-frontage rights deeded with the parcel? Any dock permits, shoreline easements, or HOA water-use restrictions?
- What's the documented flood / surge / shoreline-erosion history here (FEMA AND non-FEMA — e.g., storm surge, creek backup, septic-field saturation)?
- Any water-quality or seasonal algae-bloom issues that affect tenant satisfaction or short-term-rental demand?
- What's the average days-on-market for RENTAL listings here right now (not sales)? A rising rental-DOM trend means longer vacancies and softer asking-rent achievability than the comps imply.
- What's the recent tenant-quality profile in this submarket — average credit score on applications, eviction rate, late-payment / NSF rate, and stable-employment percentage? A property-management company in the area should have these aggregated.
- How much new for-sale + rental construction is in the pipeline within 1–3 miles? Heavy new supply typically softens prices + rents 12–24 months out; constrained supply supports both.
Investment metrics
- 1% rule
- 0.81% ✗
- Cap rate
- 5.71%
- Cash-on-cash
- -2.07%
- DSCR
- 0.91
- GRM
- 10.2
CMA / ARV
- ARV (on-the-fly)
- $186,312
- Comps found
- 1
Show comp detail 1 sale within ~0.75 mi
| Address | Dist | Beds/Ba | Sqft | Sold | Price | $/sf | Match |
|---|---|---|---|---|---|---|---|
| 74 Mays Way | 0.68mi | 3/2.0 (+1) | 1,248 (+12%) | 24mo | $210,000 | $168 | 19 |
Match score weights: distance 35% · size 25% · config 20% · recency 20%. Top-matched comps best support the ARV.
Projected returns pro-forma
4.4% appreciation · 3.0% rent growth · sell at horizon
- IRR
- 9.6%
- Equity multiple
- 1.59×
- Total profit
- $26,578
- Equity at exit
- $84,939
- IRR
- 11.3%
- Equity multiple
- 2.95×
- Total profit
- $87,407
- Equity at exit
- $142,060
Cash invested: $44,800 (down + closing). Projections, not guarantees.
Landlord ↔ Tenant lean methodology
- Overall (STATE)
- 56 Moderately Landlord-Leaning
- State New Hampshire
- 56 Moderately Landlord-Leaning · D+1
- County
- — inherits STATE
- City
- — inherits STATE
ZIP-level market 03890
- Home prices YoY
- 2.5%
- Active inventory
- 4
- Price-to-rent
- 10.2×
Monthly cashflow live
- Estimated rent
- $1,302 medium interval (Pro) →
- Mortgage (P&I)
- −$839
- Tax est. 1.5%
- −$200 /mo · $2,400/yr
- Insurance
- −$67
- HOA
- −$0
- Vacancy / Maint / Mgmt
- −$273
- Net cashflow
- $-77
Break-even live
UW: 25.0% down · 7.5% · 30yr · 1.5% tax · 5.0% vac · 8.0% maint · 8.0% mgmt
Financing live
Cash to close
- Down payment
- $40,000
- Closing costs
- $4,800
- Reserves months
- —
- Total cash needed
- —
Loan-product check · same deal, 3 products live
Conventional
25% down · 7.5% · 30yr
- Down + closing
- —
- Monthly P&I
- —
- Monthly cashflow
- —
- DSCR
- —
- Eligible?
- —
Personal DTI + credit; lowest rate.
DSCR
20% down · 8.5% · 30yr
- Down + closing
- —
- Monthly P&I
- —
- Monthly cashflow
- —
- DSCR
- —
- Eligible?
- —
No personal income docs; deal must DSCR.
Hard money
10% down · 12.0% · 12mo
- Down + closing
- —
- Monthly P&I
- —
- Monthly cashflow
- —
- DSCR
- —
- Eligible?
- —
Short-term bridge; refi at stabilization.
Listing history 11 events
-
2026-06-18days on market $160,000 Active 14 DOM
-
2026-06-17days on market $160,000 Active 13 DOM
-
2026-06-16days on market $160,000 Active 12 DOM
-
2026-06-15days on market $160,000 Active 11 DOM
-
2026-06-13days on market $160,000 Active 9 DOM
-
2026-06-12days on market $160,000 Active 8 DOM
-
2026-06-09days on market $160,000 Active 5 DOM
-
2026-06-08days on market $160,000 Active 4 DOM
-
2026-06-07days on market $160,000 Active 3 DOM
-
2026-06-05remarks 687-char remark
-
2026-06-05$160,000 Active 1 DOM
ⓘ Source: listings_history table (triggers on properties + properties_extension) + one-shot
backfill from property_details.listing_events for pre-trigger history.
Climate risk First Street
- Flood 1/10 Low FEMA zone X (unshaded) · 0% chance over 30 yrs
- Wildfire 3/10 Moderate
- Heat 3/10 Moderate 7 d/yr ≥93°F today · 17 d/yr by 30 yrs out
- Wind 3/10 Moderate 6% chance of damaging wind over 30 yrs
- Air quality 1/10 Low 0 unhealthy d/yr today · 0 by 30 yrs out
Nearby sold comps map
Loading sold comps map…
Walkable amenities ~0.75 mi
Loading nearby amenities…
Taxation est. · year 1
- Rental income
- $15,620
- − Mortgage interest
- −$8,962
- − Property taxes
- −$2,400
- − Insurance
- −$800
- − Repairs & maintenance
- −$1,250
- − Management
- −$1,250
- − Depreciation
- −$4,655
- Taxable loss
- −$3,697
- Est. tax savings @ 24.0%
- +$887
- After-tax cash flow
- $-42/yr
For passive investors: Depreciation is non-cash, so a rental often shows a tax loss while cash-flowing — sheltering income. Rental losses are passive: they offset passive income freely, and up to $25,000/yr can offset ordinary (W-2) income if you actively participate and your MAGI is under $100k (phasing out to $0 by $150k); unused losses carry forward. On sale, claimed depreciation is recaptured at up to 25%, and gains may owe capital-gains tax (a 1031 exchange can defer both). Figures are a year-1 estimate at your 24.0% rate — not tax advice; consult a CPA.
Condition & rehab AI · 10 photos
This mobile home requires extensive repairs and maintenance, including roof replacement, exterior painting, and landscaping improvements. Significant investment is needed to bring it up to a livable condition.
Repairs flagged
- Major roof — The roof appears to be in poor condition with visible damage and discoloration.
- Major siding — The siding is peeling and the paint is faded, indicating significant wear and tear.
- Major exterior paint — The exterior paint is faded and peeling, indicating significant wear and tear.
- Major fencing — The fencing is in disrepair and needs to be replaced or repaired.
Value-add opportunities
- Both roof repair and replacement — A new roof will significantly improve the home's appearance and functionality, making it more attractive to potential buyers or renters.
- Both exterior painting — Fresh paint will improve the home's curb appeal and make it more attractive to potential buyers or renters.
- Both landscaping and fencing repair — A well-maintained yard and fence will enhance the home's curb appeal and make it more attractive to potential buyers or renters.
Renovation cost estimate screening
| Repair item | Severity | Est. cost |
|---|---|---|
| roof · The roof appears to be in poor condition with visible damage and discoloration. | Major | $15,000–50,000 |
| siding · The siding is peeling and the paint is faded, indicating significant wear and tear. | Major | $15,000–50,000 |
| exterior paint · The exterior paint is faded and peeling, indicating significant wear and tear. | Major | $15,000–50,000 |
| fencing · The fencing is in disrepair and needs to be replaced or repaired. | Major | $15,000–50,000 |
| Total estimated repair cost · 4 items | $60,000–200,000 |
Value-add ROI direction
- Both roof repair and replacement — A new roof will significantly improve the home's appearance and functionality, making it more attractive to potential buyers or renters. ↑
- Both exterior painting — Fresh paint will improve the home's curb appeal and make it more attractive to potential buyers or renters. ↑
- Both landscaping and fencing repair — A well-maintained yard and fence will enhance the home's curb appeal and make it more attractive to potential buyers or renters. ↑
ⓘ Cost ranges are severity-bucket heuristics (US national rule-of-thumb). Get contractor quotes + a written scope before underwriting a rehab budget.
Schools (NCES district)
- District
- Tamworth School District
- NCES district ID
- 3306600
- Math proficiency
- 25% ▼ -5.00%
- Reading proficiency
- 25% ▼ -15.00%
- Median HH income
- $47,203
- Composite
- 24.83/100
- National rank
- #13010
- State rank
- #164 of 171 in NH
Livability — Tamworth
No livability data for this city. (Only ~50 U.S. cities are tracked.)
Census & demographics
- Population (ZIP)
- 52
Population outlook (Carroll County) Hauer SSP2
- Today (2025)
- 45,072 people
- By 2030
- 43,158 · -4.2%
- By 2040
- 38,044 · -15.6%
- By 2050
- 33,087 · -26.6%
- By 2075
- 25,661 · -43.1%
- By 2100
- 18,684 · -58.5%
Race, ethnicity, and origin ACS 2023
- Neighborhood character
- Predominantly White (100%)
- Race & ethnicity
- White 100%
- Common ancestry
- Lithuanian 6% Slovak 6%
Political lean MEDSL · Carroll
- 2024 margin
- Toss-up / Even · D 48.8% · R 50.5%
- 2008→2024 swing
- -8.0pp toward R · 2008: 6.3pp · 2024: -1.7pp
- All cycles
- 2024: R+1.7 2020: D+1.5 2016: R+5.7 2012: R+0.8 2008: D+6.3
Not yet ingested
- Civics
- —
Market trends
- HPI YoY
- ▲ 4.40%
- Current HPI
- 182.6247
- Rent YoY
- —
- Metro
- —
- State GDP YoY
- —
- F500 in state
- 0
Price history
1 event — show timeline
- 2026-06-04 Listed $160,000 PrimeMLS
Cash-flow waterfall
monthlySold comps — $/sqft
last 12 mo · ≤1 miLoading sold comps…