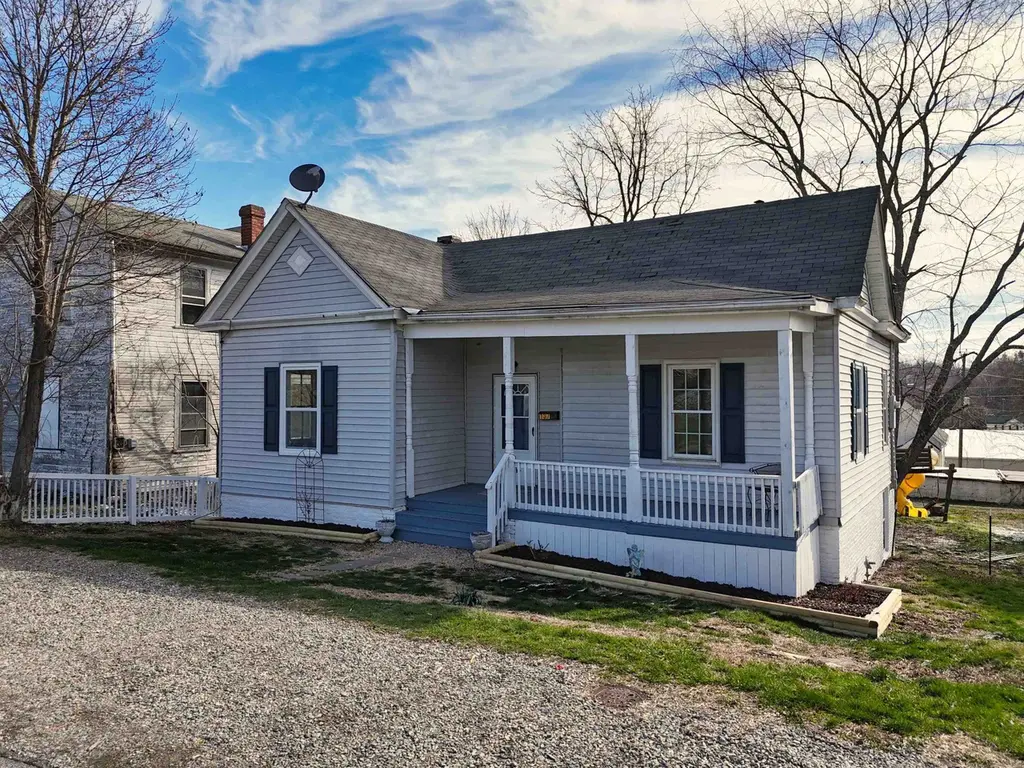
137 Lagrange St · Pulaski, VA
Flood risk 1/10 · Minimal
- FEMA flood zone
- X (unshaded)
- Chance of flooding over 30 yrs
- 0.0%
- Est. flood insurance / yr
- $507 – $1,088
Fire risk 4/10 · Minor
- Est. fire insurance / yr
- $666 – $1,236
Heat risk 4/10 · Minor
- Hot days now (above 93°F)
- 8 days/yr
- Hot days in 30 yrs
- 24 days/yr
Wind risk 2/10 · Minimal
- Chance of severe wind over 30 yrs
- —
Air-quality risk 1/10 · Minimal
- Unhealthy air days now
- 0 days/yr
- Unhealthy air days in 30 yrs
- 0 days/yr
Risk factors via First Street. Map © Google.
Why this score? — see what drove the C- grade
The composite is a weighted blend of 9 inputs, each scored 0–100. Each bar is that input's sub-score; the figure is the points it added to the 100-point composite (weight × sub-score).
- Cash flow +25.2/30.0
- DSCR +8.2/10.0
- 1% rule +5.3/10.0
- Schools +4.6/10.0
- Livability +3.4/5.0
- Rent growth +2.5/5.0
- Condition / age +2.5/5.0
- ARV discount +0.0/15.0
- Appreciation +0.0/10.0
$124,900
🖨 Deal sheet 📄 Offer letter ✓ Due diligence
Listing remarks MLS
Updated 2-bedroom home featuring a charming rocking-chair front porch and an enclosed rear porch overlooking a flat yard with a large play set. Move-in ready and priced to sell! Call with any questions or to schedule your private showing today.
Key facts
- 6,970 sq ft lot
- Built 1900
- Listed 84 days
Neighborhood map
What this means for you Summary
Snapshot
- This is a 2-bed/1.0-bath single-family listed at $125k.
Deal economics
- At list price, monthly cash flow is $278 ($3k/yr) — positive.
- The deal already cash-flows at list — no discount required.
- Meets the 1% rule at list price ($1k rent vs $125k).
- Recommended offer: $117k (6.0% below list) — sets the bar for market timing.
- Cap rate 9.0% vs local median 5.5% in Pulaski — top-decile yield for the area; either an underpriced asset or a hidden risk that comps aren't pricing in. Stress-test before assuming the spread holds.
Location & tenants
- Location reads 67/100 on livability (#297 in VA) — a middle-class / working-renter tenant base. Strengths: cost of living A+, housing A+, health & safety A+; Watch: employment D+, crime F, amenities F.
- Pulaski County Public School District (rural): math 48% / reading 61% proficiency, ranked #86 of 131 in VA (top 66%) — acceptable for families but not a draw, mixed tenant base, ~2y average lease.
- Market conditions: 114 active listings in the ZIP; 2 comparable units currently listed for rent nearby; 39 units permitted in Pulaski County in 2024 (0 in 5+ unit buildings).
Forward outlook
- Local home prices are declining (-3.0%/yr); year-one equity from $864 of loan paydown is wiped out by about $4k of value loss. Plan a longer hold.
- Pulaski County population projected at -19% by 2050 — secular population decline; favor cash flow + early exit over multi-decade hold.
Negotiation context
- It's been on market 85 days — a 6% lower offer ($117k) is reasonable based on typical stale-listing flexibility.
- Current owner paid $18k; list at $125k implies a 594% gain — meaningful room to come down on a strong offer.
Risks & watch-outs
- Watch-outs: built in 1900 — expect roof / HVAC / electrical / plumbing capex.
Questions for the listing agent
- It's been on market 85 days. Have you received any prior offers? Is the seller open to a 6% concession, seller financing, or rate buy-down credit?
- Built in 1900 — when were the roof, HVAC, electrical panel, plumbing, and water heater last replaced?
- Why hasn't it sold? Are there any deal-killer items the seller is aware of (foundation, flood, title, zoning, code violations)?
- Is there a deadline driving the sale (1031 exchange, divorce, estate, relocation)? That informs how much negotiation room exists.
- Schools are B-rated — typically a magnet for longer-tenancy family renters. What's the average tenant stay here, and is there a school-zone premium baked into asking?
- Crime grade is F in this area — have there been break-ins, vandalism, or insurance claims at this property in the last 3 years? What carrier currently insures it and at what premium?
- What's the average days-on-market for RENTAL listings here right now (not sales)? A rising rental-DOM trend means longer vacancies and softer asking-rent achievability than the comps imply.
- What's the recent tenant-quality profile in this submarket — average credit score on applications, eviction rate, late-payment / NSF rate, and stable-employment percentage? A property-management company in the area should have these aggregated.
- How much new for-sale + rental construction is in the pipeline within 1–3 miles? Heavy new supply typically softens prices + rents 12–24 months out; constrained supply supports both.
Investment metrics
- 1% rule
- 1.03% ✓
- Cap rate
- 8.97%
- Cash-on-cash
- 9.55%
- DSCR
- 1.42
- GRM
- 8.1
CMA / ARV
- ARV (median comp)
- $99,355
- List price
- $124,900
- Delta
- 25.71%
- Verdict
- OVERPRICED
- Comps
- 20 within 1.0 mi
Show comp detail 12 sales within ~0.75 mi
| Address | Dist | Beds/Ba | Sqft | Sold | Price | $/sf | Match |
|---|---|---|---|---|---|---|---|
| 127 State Aly | 0.19mi | 3/2.0 (+1) | 1,000 (+5%) | 1mo | $199,000 | $199 | 73 |
| 127 State | 0.19mi | 3/2.0 (+1) | 1,000 (+5%) | 1mo | $190,000 | $190 | 73 |
| 40 2nd St SE | 0.37mi | 2/1.0 | 892 (-6%) | 9mo | $38,000 | $43 | 65 |
| 202 Pierce Ave | 0.58mi | 2/1.0 | 956 (+0%) | 9mo | $55,000 | $58 | 65 |
| 225 Altoona Rd | 0.36mi | 2/1.0 | 895 (-6%) | 14mo | $163,000 | $182 | 61 |
| 138 Pierce Ave | 0.56mi | 3/2.0 (+1) | 1,000 (+5%) | 2mo | $199,000 | $199 | 55 |
| 502 Dora Hwy | 0.65mi | 2/1.0 | 1,040 (+9%) | 3mo | $68,000 | $65 | 52 |
| 413 Draper Ave | 0.62mi | 2/1.0 | 858 (-10%) | 4mo | $138,000 | $161 | 52 |
| 312 Lexington Ave | 0.39mi | 2/1.0 | 1,072 (+13%) | 14mo | $129,900 | $121 | 50 |
| 538 Graham St | 0.74mi | 2/1.0 | 1,040 (+9%) | 4mo | $169,000 | $163 | 46 |
| 422 S Madison Ave | 0.48mi | 3/2.0 (+1) | 1,020 (+7%) | 13mo | $199,900 | $196 | 46 |
| 125 Fayette St | 0.62mi | 3/1.0 (+1) | 1,036 (+9%) | 12mo | $145,000 | $140 | 41 |
Match score weights: distance 35% · size 25% · config 20% · recency 20%. Top-matched comps best support the ARV.
Projected returns pro-forma
-3.0% appreciation · 3.0% rent growth · sell at horizon
- IRR
- -2.0%
- Equity multiple
- 0.93×
- Total profit
- $-2,580
- Equity at exit
- $18,623
- IRR
- 7.7%
- Equity multiple
- 1.58×
- Total profit
- $20,328
- Equity at exit
- $10,799
Cash invested: $34,972 (down + closing). Projections, not guarantees.
Landlord ↔ Tenant lean methodology
- Overall (STATE)
- 55 Moderately Landlord-Leaning
- State Virginia
- 55 Moderately Landlord-Leaning · D+2
- County
- — inherits STATE
- City
- — inherits STATE
ZIP-level market 24301
- Active inventory
- 114
- Price-to-rent
- 8.1×
Monthly cashflow live
- Estimated rent
- $1,283 medium interval (Pro) →
- Mortgage (P&I)
- −$655
- Tax from tax record
- −$28 /mo · $342/yr
- Insurance
- −$52
- HOA
- −$0
- Vacancy / Maint / Mgmt
- −$269
- Net cashflow
- $278
Break-even live
UW: 25.0% down · 7.5% · 30yr · 1.5% tax · 5.0% vac · 8.0% maint · 8.0% mgmt
Financing live
Cash to close
- Down payment
- $31,225
- Closing costs
- $3,747
- Reserves months
- —
- Total cash needed
- —
Loan-product check · same deal, 3 products live
Conventional
25% down · 7.5% · 30yr
- Down + closing
- —
- Monthly P&I
- —
- Monthly cashflow
- —
- DSCR
- —
- Eligible?
- —
Personal DTI + credit; lowest rate.
DSCR
20% down · 8.5% · 30yr
- Down + closing
- —
- Monthly P&I
- —
- Monthly cashflow
- —
- DSCR
- —
- Eligible?
- —
No personal income docs; deal must DSCR.
Hard money
10% down · 12.0% · 12mo
- Down + closing
- —
- Monthly P&I
- —
- Monthly cashflow
- —
- DSCR
- —
- Eligible?
- —
Short-term bridge; refi at stabilization.
Rent comps 2 comps
| Address | Beds | Baths | Sqft | Rent | $/sqft | DOM | Units | Dist |
|---|---|---|---|---|---|---|---|---|
| 34 1st St NE Pulaski, VA | 1.0 | 1.0–1.5 | 696 | $1,225 | $1.76 | 43d | 4 | 0.41mi |
| 500 Pico Ter Pulaski, VA | 3.0 | 1.0–2.0 | 882 | $1,390 | $1.58 | 43d | 11 | 0.95mi |
Listing history 19 events
-
2026-06-19days on market $124,900 Active 85 DOM
-
2026-06-18days on market $124,900 Active 84 DOM
-
2026-06-17days on market $124,900 Active 83 DOM
-
2026-06-16days on market $124,900 Active 82 DOM
-
2026-06-15days on market $124,900 Active 81 DOM
-
2026-06-14days on market $124,900 Active 79 DOM
-
2026-06-13days on market $124,900 Active 78 DOM
-
2026-06-10days on market $124,900 Active 76 DOM
-
2026-06-09days on market $124,900 Active 75 DOM
-
2026-06-08days on market $124,900 Active 74 DOM
-
2026-06-07days on market $124,900 Active 73 DOM
-
2026-06-05days on market $124,900 Active 70 DOM
-
2026-06-02days on market $124,900 Active 68 DOM
-
2026-06-01days on market $124,900 Active 67 DOM
-
2026-05-31days on market $124,900 Active 66 DOM
-
2026-05-30days on market $124,900 Active 65 DOM
-
2026-05-19price $124,900 244-char remark
Show marketing remark (244 chars)
Updated 2-bedroom home featuring a charming rocking-chair front porch and an enclosed rear porch overlooking a flat yard with a large play set. Move-in ready and priced to sell! Call with any questions or to schedule your private showing today.
-
2026-03-27$139,900 Active 244-char remark
Show marketing remark (244 chars)
Updated 2-bedroom home featuring a charming rocking-chair front porch and an enclosed rear porch overlooking a flat yard with a large play set. Move-in ready and priced to sell! Call with any questions or to schedule your private showing today.
-
2005-01-27soldstatus $18,000
ⓘ Source: listings_history table (triggers on properties + properties_extension) + one-shot
backfill from property_details.listing_events for pre-trigger history.
Tax reassessment forecast VA · Resets to sale price
- Current annual tax
- $342 · $28/mo
- Projected year-2 tax
- $1,024 · $85/mo
- Expected delta
- +$682/yr (+$57/mo · 199.6%)
ⓘ Screening estimate from a state-policy table — verify with the county assessor before closing.
Climate risk First Street
- Flood 1/10 Low FEMA zone X (unshaded) · 0% chance over 30 yrs
- Wildfire 4/10 Moderate
- Heat 4/10 Moderate 8 d/yr ≥93°F today · 24 d/yr by 30 yrs out
- Wind 2/10 Low
- Air quality 1/10 Low 0 unhealthy d/yr today · 0 by 30 yrs out
Nearby sold comps map
Loading sold comps map…
Walkable amenities ~0.75 mi
Loading nearby amenities…
Taxation est. · year 1
- Rental income
- $15,398
- − Mortgage interest
- −$6,996
- − Property taxes
- −$342
- − Insurance
- −$624
- − Repairs & maintenance
- −$1,232
- − Management
- −$1,232
- − Depreciation
- −$3,633
- Taxable income
- $1,338
- Est. tax owed @ 24.0%
- −$321
- After-tax cash flow
- $3,017/yr
For passive investors: Depreciation is non-cash, so a rental often shows a tax loss while cash-flowing — sheltering income. Rental losses are passive: they offset passive income freely, and up to $25,000/yr can offset ordinary (W-2) income if you actively participate and your MAGI is under $100k (phasing out to $0 by $150k); unused losses carry forward. On sale, claimed depreciation is recaptured at up to 25%, and gains may owe capital-gains tax (a 1031 exchange can defer both). Figures are a year-1 estimate at your 24.0% rate — not tax advice; consult a CPA.
Schools (NCES district)
- District
- Pulaski County Public School District
- NCES district ID
- 5103150
- Math proficiency
- 48% ▼ -31.00%
- Reading proficiency
- 61% ▼ -13.00%
- Median HH income
- $44,912
- Composite
- 45.98/100
- National rank
- #2537
- State rank
- #86 of 131 in VA
Livability — Pulaski
- Score
- 67/100
- State rank
- #297
- US rank
- #10639
Category grades
Schools grade is shown separately in the Schools card above.
Census & demographics
- Census place
- Pulaski, VA
- Population (ZIP)
- 13,370
Population outlook (Pulaski County) Hauer SSP2
- Today (2025)
- 32,949 people
- By 2030
- 31,812 · -3.5%
- By 2040
- 29,224 · -11.3%
- By 2050
- 26,691 · -19.0%
- By 2075
- 21,312 · -35.3%
- By 2100
- 15,697 · -52.4%
Race, ethnicity, and origin ACS 2023
- Neighborhood character
- Predominantly White (89%)
- Race & ethnicity
- White 89% Two or more races 5% Black 4% Hispanic / Latino 3%
- Common ancestry
- Serbian 2% Italian 2% Iranian 1%
- Foreign-born
- 2% · Vietnam, Canada
- Languages at home
- 97% English-only · Spanish 1%
Political lean MEDSL · Pulaski
- 2024 margin
- Solid R (+44.7) · D 27.3% · R 72.0%
- 2008→2024 swing
- -25.1pp toward R · 2008: -19.5pp · 2024: -44.7pp
- All cycles
- 2024: R+44.7 2020: R+41.5 2016: R+40.7 2012: R+24.8 2008: R+19.5
Not yet ingested
- Civics
- —
Market trends
- HPI YoY
- ▼ -88.98%
- Current HPI
- 144.6556
- Rent YoY
- —
- Metro
- —
- State GDP YoY
- ▲ 2.40%
- F500 in state
- 50
Industry mix (Fortune 500 HQ in VA)
| Industry | F500 HQs | Revenue |
|---|---|---|
| Aerospace / Defense | 4 | $236B |
|
||
| Technology / Defense | 3 | $32B |
|
||
| Financial Services | 2 | $176B |
|
||
| Utilities | 2 | $27B |
|
||
| Insurance | 2 | $25B |
|
||
| Technology | 2 | $15B |
|
||
Price history
+593.9% since first listed3 events — show timeline
- 2026-05-19 Price Changed $124,900 NRVMLS
- 2026-03-27 Listed $139,900 NRVMLS
- 2005-01-27 Sold (Public Records) $18,000 Public Records
Property tax history
+3.1%/yrLatest (2026): $342 · +0.0% YoY. Source: county tax records.
Cash-flow waterfall
monthlySold comps — $/sqft
last 12 mo · ≤1 miLoading sold comps…