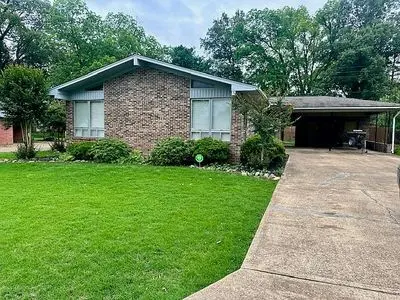
501 College St · Marvell, AR
Flood risk No data
- FEMA flood zone
- —
- Chance of flooding over 30 yrs
- —
- Est. flood insurance / yr
- —
Fire risk No data
- Est. fire insurance / yr
- —
Heat risk No data
- Hot days now (above threshold)
- —
- Hot days in 30 yrs
- —
Wind risk No data
- Chance of severe wind over 30 yrs
- —
Air-quality risk No data
- Unhealthy air days now
- —
- Unhealthy air days in 30 yrs
- —
Risk factors via First Street. Map © Google.
Why this score? — see what drove the D- grade
The composite is a weighted blend of 9 inputs, each scored 0–100. Each bar is that input's sub-score; the figure is the points it added to the 100-point composite (weight × sub-score).
- Cash flow +11.4/30.0
- ARV discount +7.5/15.0
- Appreciation +5.8/10.0
- DSCR +3.4/10.0
- Livability +3.1/5.0
- Rent growth +2.5/5.0
- Condition / age +2.5/5.0
- 1% rule +2.3/10.0
- Schools +1.4/10.0
$139,900
🖨 Deal sheet 📄 Offer letter ✓ Due diligence
Listing remarks
House located on quiet street with great neighbors! Has fenced in back yard with closed in patio. Solid house with lots of storage and space. Come see this home while it lasts!
Key facts
- Lots of storage
- Fenced in back yard
- Closed in patio
Tags
Neighborhood map
What this means for you Summary
Snapshot
- This is a 2-bed/2.0-bath single-family listed at $140k.
Deal economics
- At list price, monthly cash flow is $-48 ($-571/yr) — negative.
- To cash-flow at today's rent, offer at most $131k (6.0% below list).
- To meet the 1% rule (rent ≥ 1% of price), the offer needs to be $102k (26.9% below list).
- Recommended offer: $102k (26.9% below list) — sets the bar for 1% rule.
Location & tenants
- Location reads 61/100 on livability (#237 in AR) — a middle-class / working-renter tenant base. Strengths: cost of living A+, health & safety A+, crime B; Watch: schools F, amenities F, commute F.
- Marvell School District (rural): math 14% / reading 12% proficiency, ranked #243 of 245 in AR (top 99%) — low school quality limits family demand, transient renter base, plan for 1-2y turnover; 94% free/reduced lunch — lower-income household profile, screen leases tightly.
- Market conditions: 11 active listings in the ZIP; 17 units permitted in Phillips County in 2024 (0 in 5+ unit buildings).
Forward outlook
- In year one you build about $3k of equity ($967 loan paydown + $2k appreciation (1.7% local appreciation)).
- Phillips County population projected at -45% by 2050 — secular population decline; favor cash flow + early exit over multi-decade hold.
- At projected returns (1.7% appreciation + 3.0% rent growth), your $39k cash investment doubles in ~9 years — after that, you're playing with house money.
- By year 10, paydown + projected appreciation supports a ~$33k cash-out refi (75% LTV) — recoverable capital for the next deal without selling this one.
Negotiation context
- It's been on market 30 days — a 2% lower offer ($138k) is reasonable based on typical stale-listing flexibility.
Questions for the listing agent
- What do current leases actually rent for vs. the listed asking? Can we see a recent rent roll and the last 12 months of T-12 income?
- Is there a deadline driving the sale (1031 exchange, divorce, estate, relocation)? That informs how much negotiation room exists.
- Schools are F-rated, which usually means shorter tenancies and higher turnover. Who's the typical renter profile here, and what's been the actual vacancy rate?
- The area grade is low — what's the realistic commute time and amenity access for the typical tenant pool here? Any planned neighborhood developments (good or bad) we should know about?
- What's the average days-on-market for RENTAL listings here right now (not sales)? A rising rental-DOM trend means longer vacancies and softer asking-rent achievability than the comps imply.
- What's the recent tenant-quality profile in this submarket — average credit score on applications, eviction rate, late-payment / NSF rate, and stable-employment percentage? A property-management company in the area should have these aggregated.
- How much new for-sale + rental construction is in the pipeline within 1–3 miles? Heavy new supply typically softens prices + rents 12–24 months out; constrained supply supports both.
Investment metrics
- 1% rule
- 0.73% ✗
- Cap rate
- 5.88%
- Cash-on-cash
- -1.46%
- DSCR
- 0.94
- GRM
- 11.4
CMA / ARV
No comps found within radius.
Projected returns pro-forma
1.67% appreciation · 3.0% rent growth · sell at horizon
- IRR
- 2.0%
- Equity multiple
- 1.11×
- Total profit
- $4,196
- Equity at exit
- $52,721
- IRR
- 6.2%
- Equity multiple
- 1.81×
- Total profit
- $31,714
- Equity at exit
- $74,074
Cash invested: $39,172 (down + closing). Projections, not guarantees.
Landlord ↔ Tenant lean methodology
- Overall (STATE)
- 92 Strongly Landlord-Friendly
- State Arkansas
- 92 Strongly Landlord-Friendly · R+14
- County
- — inherits STATE
- City
- — inherits STATE
ZIP-level market 72366
- Home prices YoY
- 1.8%
- Active inventory
- 11
- Price-to-rent
- 11.4×
Monthly cashflow live
- Estimated rent
- $1,022 medium interval (Pro) →
- Mortgage (P&I)
- −$734
- Tax from tax record
- −$63 /mo · $757/yr
- Insurance
- −$58
- HOA
- −$0
- Vacancy / Maint / Mgmt
- −$215
- Net cashflow
- $-48
Break-even live
UW: 25.0% down · 7.5% · 30yr · 1.5% tax · 5.0% vac · 8.0% maint · 8.0% mgmt
Financing live
Cash to close
- Down payment
- $34,975
- Closing costs
- $4,197
- Reserves months
- —
- Total cash needed
- —
Loan-product check · same deal, 3 products live
Conventional
25% down · 7.5% · 30yr
- Down + closing
- —
- Monthly P&I
- —
- Monthly cashflow
- —
- DSCR
- —
- Eligible?
- —
Personal DTI + credit; lowest rate.
DSCR
20% down · 8.5% · 30yr
- Down + closing
- —
- Monthly P&I
- —
- Monthly cashflow
- —
- DSCR
- —
- Eligible?
- —
No personal income docs; deal must DSCR.
Hard money
10% down · 12.0% · 12mo
- Down + closing
- —
- Monthly P&I
- —
- Monthly cashflow
- —
- DSCR
- —
- Eligible?
- —
Short-term bridge; refi at stabilization.
Listing history 20 events
-
2026-06-19days on market $139,900 Active 30 DOM
-
2026-06-18days on market $139,900 Active 29 DOM
-
2026-06-17days on market $139,900 Active 28 DOM
-
2026-06-16days on market $139,900 Active 27 DOM
-
2026-06-15days on market $139,900 Active 26 DOM
-
2026-06-14days on market $139,900 Active 24 DOM
-
2026-06-12days on market $139,900 Active 23 DOM
-
2026-06-09days on market $139,900 Active 20 DOM
-
2026-06-08days on market $139,900 Active 19 DOM
-
2026-06-07days on market $139,900 Active 18 DOM
-
2026-06-07days on market $139,900 Active 17 DOM
-
2026-06-04days on market $139,900 Active 14 DOM
-
2026-06-02days on market $139,900 Active 13 DOM
-
2026-06-01days on market $139,900 Active 12 DOM
-
2026-05-31days on market $139,900 Active 11 DOM
-
2026-05-31days on market $139,900 Active 10 DOM
-
2026-05-21$139,900 Active
-
2024-09-11soldstatus $129,000
-
2022-03-21soldstatus $72,500
-
2008-04-16soldstatus $60,000
ⓘ Source: listings_history table (triggers on properties + properties_extension) + one-shot
backfill from property_details.listing_events for pre-trigger history.
Tax reassessment forecast AR · Resets to sale price
- Current annual tax
- $757 · $63/mo
- Projected year-2 tax
- $895 · $75/mo
- Expected delta
- +$139/yr (+$12/mo · 18.3%)
ⓘ Screening estimate from a state-policy table — verify with the county assessor before closing.
Nearby sold comps map
Loading sold comps map…
Walkable amenities ~0.75 mi
Loading nearby amenities…
Taxation est. · year 1
- Rental income
- $12,264
- − Mortgage interest
- −$7,837
- − Property taxes
- −$757
- − Insurance
- −$700
- − Repairs & maintenance
- −$981
- − Management
- −$981
- − Depreciation
- −$4,070
- Taxable loss
- −$3,060
- Est. tax savings @ 24.0%
- +$735
- After-tax cash flow
- $163/yr
For passive investors: Depreciation is non-cash, so a rental often shows a tax loss while cash-flowing — sheltering income. Rental losses are passive: they offset passive income freely, and up to $25,000/yr can offset ordinary (W-2) income if you actively participate and your MAGI is under $100k (phasing out to $0 by $150k); unused losses carry forward. On sale, claimed depreciation is recaptured at up to 25%, and gains may owe capital-gains tax (a 1031 exchange can defer both). Figures are a year-1 estimate at your 24.0% rate — not tax advice; consult a CPA.
Schools (NCES district)
- District
- Marvell School District
- NCES district ID
- 0509510
- Math proficiency
- 14% ▼ -5.00%
- Reading proficiency
- 12% ▼ -3.00%
- Median HH income
- $30,534
- Composite
- 13.79/100
- National rank
- #14475
- State rank
- #243 of 245 in AR
Livability — Marvell
- Score
- 61/100
- State rank
- #237
- US rank
- #17737
Category grades
Schools grade is shown separately in the Schools card above.
Census & demographics
- Census place
- Marvell, AR
- Population (ZIP)
- 1,637
Population outlook (Phillips County) Hauer SSP2
- Today (2025)
- 15,786 people
- By 2030
- 14,028 · -11.1%
- By 2040
- 11,019 · -30.2%
- By 2050
- 8,684 · -45.0%
- By 2075
- 5,074 · -67.9%
- By 2100
- 3,053 · -80.7%
Race, ethnicity, and origin ACS 2023
- Neighborhood character
- Diverse neighborhood (Simpson 0.59)
- Race & ethnicity
- Black 53% White 37% Two or more races 9% Hispanic / Latino 1%
- Foreign-born
- 2%
- Languages at home
- 99% English-only · German/W. Germanic 1%
Political lean MEDSL · Phillips
- 2024 margin
- D (+13.3) · D 55.8% · R 42.5% · Other 1.7%
- 2008→2024 swing
- -15.7pp toward R · 2008: 29.0pp · 2024: 13.3pp
- All cycles
- 2024: D+13.3 2020: D+19.3 2016: D+26.8 2012: D+32.8 2008: D+29.0
Not yet ingested
- Civics
- —
Market trends
- HPI YoY
- ▲ 1.67%
- Current HPI
- 94.2121
- Rent YoY
- —
- Metro
- —
- State GDP YoY
- ▲ 3.80%
- F500 in state
- 10
Industry mix (Fortune 500 HQ in AR)
| Industry | F500 HQs | Revenue |
|---|---|---|
| Retail | 1 | $681B |
|
||
| Food / Agriculture | 1 | $53B |
|
||
| Retail / Energy | 1 | $22B |
|
||
| Transportation / Logistics | 1 | $12B |
|
||
| Energy | 1 | $4B |
|
||
Price history
+133.2% since first listed4 events — show timeline
- 2026-05-21 Listed $139,900 FSBO.com
- 2024-09-11 Sold (Public Records) $129,000 Public Records
- 2022-03-21 Sold (Public Records) $72,500 Public Records
- 2008-04-16 Sold (Public Records) $60,000 Public Records
Property tax history
+17.8%/yrLatest (2025): $757 · +15.6% YoY. Source: county tax records.
Cash-flow waterfall
monthlySold comps — $/sqft
last 12 mo · ≤1 miLoading sold comps…