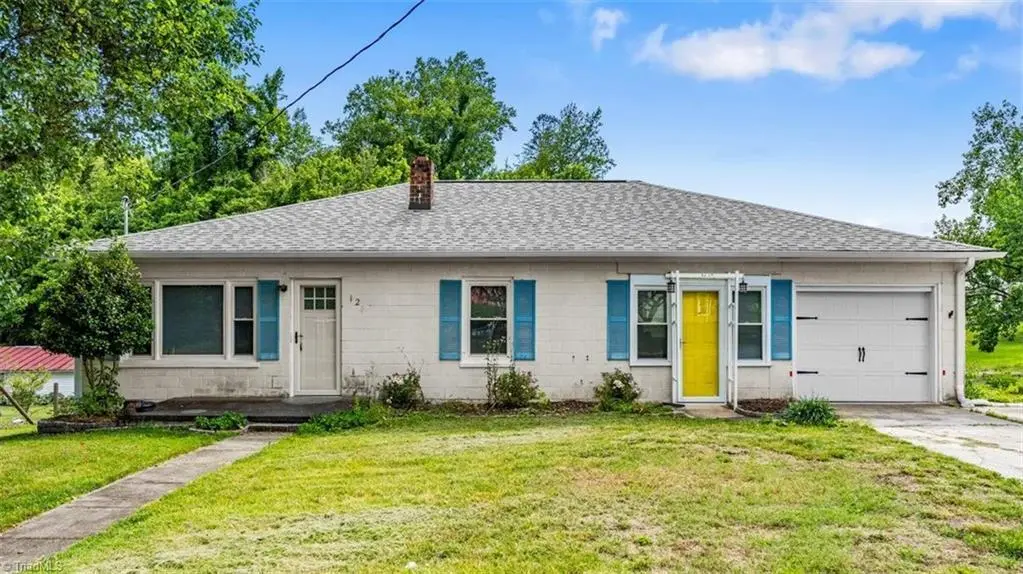
124 Birchwood Dr · Flat Rock, NC
Flood risk 1/10 · Minimal
- FEMA flood zone
- X (unshaded)
- Chance of flooding over 30 yrs
- 0.0%
- Est. flood insurance / yr
- $473 – $860
Fire risk 3/10 · Minor
- Est. fire insurance / yr
- $906 – $1,684
Heat risk 5/10 · Moderate
- Hot days now (above 99°F)
- 7 days/yr
- Hot days in 30 yrs
- 18 days/yr
Wind risk 2/10 · Minimal
- Chance of severe wind over 30 yrs
- 1.0%
Air-quality risk 1/10 · Minimal
- Unhealthy air days now
- 0 days/yr
- Unhealthy air days in 30 yrs
- 0 days/yr
Risk factors via First Street. Map © Google.
Why this score? — see what drove the B- grade
The composite is a weighted blend of 9 inputs, each scored 0–100. Each bar is that input's sub-score; the figure is the points it added to the 100-point composite (weight × sub-score).
- Cash flow +26.5/30.0
- ARV discount +15.0/15.0
- DSCR +9.1/10.0
- 1% rule +6.2/10.0
- Schools +4.1/10.0
- Livability +3.2/5.0
- Rent growth +2.5/5.0
- Condition / age +2.5/5.0
- Appreciation +0.0/10.0
$119,900
🖨 Deal sheet 📄 Offer letter ✓ Due diligence
Listing remarks MLS
Come see this cozy home that is ready for new owners! All appliances including washer and dryer convey! Breezeway would be ideal for a seating area to enjoy a cup of coffee. The backyard is cleared and level. There are several areas that would be a great spot for a garden-there's already a cherry tree on the property! Roof was just installed in 2018. Basement was recently waterproofed. Seller believes there are hardwoods underneath current flooring.Schedule an appointment to see this one before it's gone!
Key facts
- Functional layout
- Electric cooktop
- Cinderblock home
Tags
Property features AI
Finance
- Other: Directions: Head toward Kirkman Rd, turn right onto Lovers Ln, turn left onto Smith Ln, turn left onto Birchwood Dr
- HOA & community: No homeowners association; Subdivision: Hamburg
Exterior
- Parking: Attached garage (1 car)
- Utilities: Electric water heater; Septic tank; Public water
- Home design: Residential stick/site-built house; One story; Built in 1957; Existing structure
- Construction: Block construction
- Exterior features: Lot approximately 0.49 acres; Public water; Septic tank; Private maintained road
Interior
- Kitchen: Electric water heater
- Bedrooms: Total rooms: 4
- Bathrooms: 1 full bathroom
- Heating & cooling: Central air; Wall unit(s); Forced air heating; Oil heating fuel
- Interior features: Primary bedroom on main level; Unfinished basement
Neighborhood map
What this means for you Summary
Snapshot
- This is a 2-bed/1.0-bath single-family listed at $120k.
Deal economics
- At list price, monthly cash flow is $318 ($4k/yr) — positive.
- The deal already cash-flows at list — no discount required.
- Meets the 1% rule at list price ($1k rent vs $120k).
- Cap rate 9.5% vs local median 1.5% in Flat Rock — top-decile yield for the area; either an underpriced asset or a hidden risk that comps aren't pricing in. Stress-test before assuming the spread holds.
Location & tenants
- Location reads 65/100 on livability (#330 in NC) — a middle-class / working-renter tenant base. Strengths: crime A+, employment A+, housing A; Watch: amenities F, commute F, cost of living F.
- Mount Airy City Schools (town): math 51% / reading 49% proficiency, ranked #69 of 178 in NC (top 39%) — acceptable for families but not a draw, mixed tenant base, ~2y average lease.
- Market conditions: 213 active listings in the ZIP; 1 comparable units currently listed for rent nearby; 243 units permitted in Surry County in 2024 (0 in 5+ unit buildings).
- This rent runs 35% of the median local income ($46k/yr) — at the standard rent-burdened threshold; future hikes will face affordability resistance.
Forward outlook
- Local home prices are declining (-3.0%/yr); year-one equity from $829 of loan paydown is wiped out by about $4k of value loss. Plan a longer hold.
- Surry County population projected at -22% by 2050 — secular population decline; favor cash flow + early exit over multi-decade hold.
- At projected returns (-3.0% appreciation + 3.0% rent growth), your $34k cash investment doubles in ~10 years — after that, you're playing with house money.
Negotiation context
- Only 5 days on market — expect competitive offers; lowballing is unlikely to land.
- 3 sale attempts since 11y ago with the ask held roughly flat each time — persistent listings suggest the price (not the market) is what's stuck; bring a comps-based counter.
- Current owner paid $75k; list at $120k implies a 60% gain — meaningful room to come down on a strong offer.
Risks & watch-outs
- Watch-outs: built in 1957 — expect roof / HVAC / electrical / plumbing capex.
- Climate carrying-cost: extreme-heat days projected 7→18/yr by 2055 (HVAC capex compounding) — expect insurance premiums to compound above CPI over the hold.
Questions for the listing agent
- Built in 1957 — when were the roof, HVAC, electrical panel, plumbing, and water heater last replaced?
- Is there a deadline driving the sale (1031 exchange, divorce, estate, relocation)? That informs how much negotiation room exists.
- Schools are B-rated — typically a magnet for longer-tenancy family renters. What's the average tenant stay here, and is there a school-zone premium baked into asking?
- What's the average days-on-market for RENTAL listings here right now (not sales)? A rising rental-DOM trend means longer vacancies and softer asking-rent achievability than the comps imply.
- What's the recent tenant-quality profile in this submarket — average credit score on applications, eviction rate, late-payment / NSF rate, and stable-employment percentage? A property-management company in the area should have these aggregated.
- How much new for-sale + rental construction is in the pipeline within 1–3 miles? Heavy new supply typically softens prices + rents 12–24 months out; constrained supply supports both.
Investment metrics
- 1% rule
- 1.12% ✓
- Cap rate
- 9.48%
- Cash-on-cash
- 11.37%
- DSCR
- 1.51
- GRM
- 7.5
CMA / ARV
- ARV (on-the-fly)
- $235,200
- Comps found
- 10
Show comp detail 10 sales within ~0.75 mi
| Address | Dist | Beds/Ba | Sqft | Sold | Price | $/sf | Match |
|---|---|---|---|---|---|---|---|
| 124 Birchwood Dr | 0.00mi | 2/1.0 | 1,417 (+5%) | 0mo | $117,500 | $83 | 91 |
| 138 Durham Ln | 0.22mi | 3/2.0 (+1) | 1,392 (+4%) | 5mo | $332,500 | $239 | 71 |
| 174 Fairview Dr | 0.38mi | 2/1.0 | 1,239 (-8%) | 8mo | $142,000 | $115 | 62 |
| 353 Smith Ln | 0.24mi | 3/1.5 (+1) | 1,429 (+6%) | 22mo | $262,000 | $183 | 52 |
| 1512 Pittman St | 0.58mi | 2/3.0 | 1,220 (-9%) | 1mo | $299,900 | $246 | 48 |
| 1729 Surry Ave | 0.48mi | 3/2.0 (+1) | 1,374 (+2%) | 23mo | $270,000 | $197 | 46 |
| 132 Hilda Dr | 0.72mi | 2/2.0 | 1,362 (+1%) | 19mo | $228,000 | $167 | 44 |
| 131 Hilda Dr | 0.71mi | 3/1.5 (+1) | 1,232 (-8%) | 4mo | $215,000 | $175 | 42 |
| 111 Vine St | 0.67mi | 3/2.0 (+1) | 1,425 (+6%) | 10mo | $250,000 | $175 | 41 |
| 1610 S Main St | 0.67mi | 3/1.0 (+1) | 1,200 (-11%) | 12mo | $141,000 | $118 | 36 |
Match score weights: distance 35% · size 25% · config 20% · recency 20%. Top-matched comps best support the ARV.
Projected returns pro-forma
-3.0% appreciation · 3.0% rent growth · sell at horizon
- IRR
- 0.6%
- Equity multiple
- 1.02×
- Total profit
- $789
- Equity at exit
- $17,877
- IRR
- 10.2%
- Equity multiple
- 1.79×
- Total profit
- $26,629
- Equity at exit
- $10,367
Cash invested: $33,572 (down + closing). Projections, not guarantees.
Landlord ↔ Tenant lean methodology
- Overall (STATE)
- 85 Strongly Landlord-Friendly
- State North Carolina
- 85 Strongly Landlord-Friendly · R+3
- County
- — inherits STATE
- City
- — inherits STATE
ZIP-level market 27030
- Active inventory
- 213
- Price-to-rent
- 7.5×
Monthly cashflow live
- Estimated rent
- $1,341 medium interval (Pro) →
- Mortgage (P&I)
- −$629
- Tax from tax record
- −$63 /mo · $751/yr
- Insurance
- −$50
- HOA
- −$0
- Vacancy / Maint / Mgmt
- −$282
- Net cashflow
- $318
Break-even live
UW: 25.0% down · 7.5% · 30yr · 1.5% tax · 5.0% vac · 8.0% maint · 8.0% mgmt
Financing live
Cash to close
- Down payment
- $29,975
- Closing costs
- $3,597
- Reserves months
- —
- Total cash needed
- —
Loan-product check · same deal, 3 products live
Conventional
25% down · 7.5% · 30yr
- Down + closing
- —
- Monthly P&I
- —
- Monthly cashflow
- —
- DSCR
- —
- Eligible?
- —
Personal DTI + credit; lowest rate.
DSCR
20% down · 8.5% · 30yr
- Down + closing
- —
- Monthly P&I
- —
- Monthly cashflow
- —
- DSCR
- —
- Eligible?
- —
No personal income docs; deal must DSCR.
Hard money
10% down · 12.0% · 12mo
- Down + closing
- —
- Monthly P&I
- —
- Monthly cashflow
- —
- DSCR
- —
- Eligible?
- —
Short-term bridge; refi at stabilization.
Rent comps 1 comps
| Address | Beds | Baths | Sqft | Rent | $/sqft | DOM | Units | Dist |
|---|---|---|---|---|---|---|---|---|
| 335 Willow St Mount Airy, NC | 1.0–2.0 | 1.0–2.0 | 815 | $1,641 | $2.01 | 43d | 9 | 1.41mi |
Listing history 6 events
-
2026-06-12status $119,900 Pending 5 DOM
-
2026-06-09days on market $119,900 Active 5 DOM
-
2026-06-08days on market $119,900 Active 4 DOM
-
2026-06-07days on market $119,900 Active 3 DOM
-
2026-06-05remarks 699-char remark
-
2026-06-05$119,900 Active 1 DOM
ⓘ Source: listings_history table (triggers on properties + properties_extension) + one-shot
backfill from property_details.listing_events for pre-trigger history.
Tax reassessment forecast NC · Resets to sale price
- Current annual tax
- $751 · $63/mo
- Projected year-2 tax
- $983 · $82/mo
- Expected delta
- +$232/yr (+$19/mo · 31.0%)
ⓘ Screening estimate from a state-policy table — verify with the county assessor before closing.
Climate risk First Street
- Flood 1/10 Low FEMA zone X (unshaded) · 0% chance over 30 yrs
- Wildfire 3/10 Moderate
- Heat 5/10 Major 7 d/yr ≥99°F today · 18 d/yr by 30 yrs out
- Wind 2/10 Low 100% chance of damaging wind over 30 yrs
- Air quality 1/10 Low 0 unhealthy d/yr today · 0 by 30 yrs out
Nearby sold comps map
Loading sold comps map…
Walkable amenities ~0.75 mi
Loading nearby amenities…
Taxation est. · year 1
- Rental income
- $16,090
- − Mortgage interest
- −$6,716
- − Property taxes
- −$751
- − Insurance
- −$600
- − Repairs & maintenance
- −$1,287
- − Management
- −$1,287
- − Depreciation
- −$3,488
- Taxable income
- $1,961
- Est. tax owed @ 24.0%
- −$471
- After-tax cash flow
- $3,345/yr
For passive investors: Depreciation is non-cash, so a rental often shows a tax loss while cash-flowing — sheltering income. Rental losses are passive: they offset passive income freely, and up to $25,000/yr can offset ordinary (W-2) income if you actively participate and your MAGI is under $100k (phasing out to $0 by $150k); unused losses carry forward. On sale, claimed depreciation is recaptured at up to 25%, and gains may owe capital-gains tax (a 1031 exchange can defer both). Figures are a year-1 estimate at your 24.0% rate — not tax advice; consult a CPA.
Schools (NCES district)
- District
- Mount Airy City Schools
- NCES district ID
- 3703210
- Math proficiency
- 51% ▲ 8.00%
- Reading proficiency
- 49% ▲ 2.00%
- Median HH income
- $33,113
- Composite
- 41.19/100
- National rank
- #3546
- State rank
- #69 of 178 in NC
Livability — Flat Rock
- Score
- 65/100
- State rank
- #330
- US rank
- #13447
Category grades
Schools grade is shown separately in the Schools card above.
Census & demographics
- Census place
- Flat Rock, NC
- County
- Surry County · 36,241 people
- Metro
- Mount Airy, NC
- Population (ZIP)
- 36,241
- Household income
- $46,377
- Rent vs Own
- Severe rent burden
- 939.0
Population outlook (Surry County) Hauer SSP2
- Today (2025)
- 69,473 people
- By 2030
- 66,964 · -3.6%
- By 2040
- 60,967 · -12.2%
- By 2050
- 54,102 · -22.1%
- By 2075
- 38,806 · -44.1%
- By 2100
- 24,711 · -64.4%
Race, ethnicity, and origin ACS 2023
- Neighborhood character
- Predominantly White (83%)
- Race & ethnicity
- White 83% Hispanic / Latino 9% Two or more races 5% Black 5%
- Hispanic origin (detail)
- Mexican 7%
- Common ancestry
- Serbian 2% Slovak 2% Italian 1%
- Foreign-born
- 4% · Canada
- Languages at home
- 92% English-only · Spanish 6% Other Asian/Pacific 1%
Political lean MEDSL · Surry
- 2024 margin
- Solid R (+53.3) · D 23.0% · R 76.3%
- 2008→2024 swing
- -25.4pp toward R · 2008: -28.0pp · 2024: -53.3pp
- All cycles
- 2024: R+53.3 2020: R+51.4 2016: R+50.7 2012: R+36.9 2008: R+28.0
Not yet ingested
- Civics
- —
Market trends
- HPI YoY
- ▼ -132.64%
- Current HPI
- 177.1549
- Rent YoY
- —
- Metro
- Mount Airy, NC
- State GDP YoY
- ▲ 3.28%
- F500 in state
- 26
Industry mix (Fortune 500 HQ in NC)
| Industry | F500 HQs | Revenue |
|---|---|---|
| Financial Services | 2 | $213B |
|
||
| Retail | 2 | $95B |
|
||
| Industrial Conglomerate | 1 | $38B |
|
||
| Metals / Steel | 1 | $35B |
|
||
| Utilities | 1 | $30B |
|
||
| Industrial Machinery | 1 | $19B |
|
||
Price history
+74.0% since first listed14 events — show timeline
- 2026-06-04 Listed $119,900 Triad MLS
- 2020-06-30 Sold (Public Records) $75,000 Public Records
- 2020-06-30 Sold (MLS) $75,000 Triad MLS
- 2020-06-02 Pending — Triad MLS
- 2020-05-09 Contingent — Triad MLS
- 2019-11-13 Price Changed $82,900 Triad MLS
- 2019-08-14 Listed $84,900 Triad MLS
- 2016-12-13 Sold (Public Records) $54,000 Public Records
- 2016-12-13 Sold (MLS) $54,000 Triad MLS
- 2016-10-25 Pending — Triad MLS
- 2016-09-01 Price Changed $59,900 Triad MLS
- 2016-06-29 Price Changed $61,500 Triad MLS
- 2016-03-16 Price Changed $63,900 Triad MLS
- 2015-11-09 Listed $68,900 Triad MLS
Property tax history
+9.3%/yrLatest (2025): $751 · +18.8% YoY. Source: county tax records.
Cash-flow waterfall
monthlySold comps — $/sqft
last 12 mo · ≤1 miLoading sold comps…