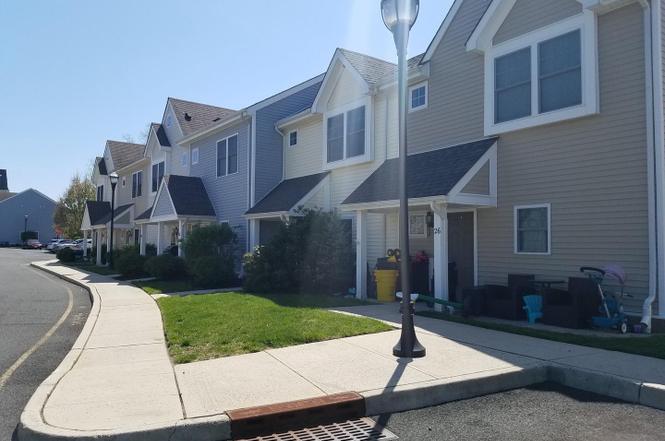
24 Cedar Xing · Red Bank, NJ
Flood risk 1/10 · Minimal
- FEMA flood zone
- X (unshaded)
- Chance of flooding over 30 yrs
- 0.0%
- Est. flood insurance / yr
- $507 – $1,088
Fire risk 1/10 · Minimal
- Est. fire insurance / yr
- $526 – $976
Heat risk 8/10 · Major
- Hot days now (above 95°F)
- 7 days/yr
- Hot days in 30 yrs
- 16 days/yr
Wind risk 8/10 · Major
- Chance of severe wind over 30 yrs
- 80.0%
Air-quality risk 3/10 · Minor
- Unhealthy air days now
- 3 days/yr
- Unhealthy air days in 30 yrs
- 4 days/yr
Risk factors via First Street. Map © Google.
Why this score? — see what drove the B grade
The composite is a weighted blend of 9 inputs, each scored 0–100. Each bar is that input's sub-score; the figure is the points it added to the 100-point composite (weight × sub-score).
- Cash flow +30.0/30.0
- 1% rule +10.0/10.0
- DSCR +10.0/10.0
- ARV discount +7.5/15.0
- Schools +4.4/10.0
- Rent growth +4.1/5.0
- Livability +4.1/5.0
- Condition / age +2.5/5.0
- Appreciation +0.0/10.0
$202,930
🖨 Deal sheet 📄 Offer letter ✓ Due diligence
Listing remarks
Property is a deed restricted. Affordable Housing unit. Maximum income limits for a moderate unit in Monmouth County: 2 person household - $86,160.00 As-is, where-is. * Seller and listing agent make no representation regarding any information contained within or regarding the property. Buyer is responsible for verifying the accuracy of any and all information provided in the MLS including but not limited to, room sizes, property amenities, property condition, functionality of any systems, property condition, functionality of any systems. Terms- Cash or non warrantable mortgage only.
Key facts
- $230 HOA
- Community pool
- Built 2013
Property features AI
Finance
- Other: Pets allowed with size/weight restrictions
- HOA & community: Monthly association fee of $230; HOA covers common area maintenance, exterior building maintenance, lawn care, snow removal, and trash
Exterior
- Parking: Off-site parking
- Utilities: Public water; Public sewer; Cable TV available; Electric available; Natural gas available; Water and sewer available
- Home design: Interior townhouse/rowhouse; Fee simple ownership; Property in good condition
- Construction: Frame construction; Slab foundation; Asphalt roof; Year built estimated
- Exterior features: Community pool; Above-grade and below-grade structures noted; Lot dimensions estimated
Interior
- Bedrooms: Two bedrooms on the first upper level
- Bathrooms: Two full bathrooms (one on main level, one on first upper level)
- Heating & cooling: 90% forced air heating; Natural gas heating and hot water; Central air conditioning (electric)
- Interior features: Estimated living area; No basement
Neighborhood map
What this means for you Summary
Snapshot
- This is a 2-bed/2.0-bath townhouse listed at $203k.
Deal economics
- At list price, monthly cash flow is $1k ($15k/yr) — positive.
- The deal already cash-flows at list — no discount required.
- Meets the 1% rule at list price ($4k rent vs $203k).
- Recommended offer: $179k (12.0% below list) — sets the bar for market timing.
- Cap rate 13.6% vs local median 2.3% in Red Bank — top-decile yield for the area; either an underpriced asset or a hidden risk that comps aren't pricing in. Stress-test before assuming the spread holds.
Location & tenants
- Location reads 82/100 on livability (#45 in NJ, #1,151 nationally) — a professional / high-income tenant draw. Strengths: amenities A+, commute A+, employment A+; Watch: cost of living F.
- Red Bank Regional School District (suburban): math 34% / reading 49% proficiency, ranked #143 of 472 in NJ (top 30%) — families likely to look elsewhere, expect single-tenant / working-renter base with shorter leases.
- Market conditions: Rents rising fast (+6.5%/yr); 137 active listings in the ZIP; 14 comparable units currently listed for rent nearby; rentals leasing fast (median 1d on market — plan ~1-2 weeks tenant-placement turnaround); high-income renter base; 2,840 units permitted in Monmouth County in 2024 (484 in 5+ unit buildings).
- This rent runs 39% of the median local income ($112k/yr) — at the standard rent-burdened threshold; future hikes will face affordability resistance.
Forward outlook
- Local home prices are declining (-3.0%/yr); year-one equity from $1k of loan paydown is wiped out by about $6k of value loss. Plan a longer hold.
- Monmouth County population projected at -11% by 2050 — secular population decline; favor cash flow + early exit over multi-decade hold.
- At projected returns (-3.0% appreciation + 6.5% rent growth), your $57k cash investment doubles in ~5 years — after that, you're playing with house money.
Negotiation context
- It's been on market 328 days — a 12% lower offer ($179k) is reasonable based on typical stale-listing flexibility.
- 4 sale attempts since 2y ago with the ask held roughly flat each time — persistent listings suggest the price (not the market) is what's stuck; bring a comps-based counter.
Risks & watch-outs
- Climate carrying-cost: severe wind risk, 80% chance of damaging wind over 30y; extreme-heat days projected 7→16/yr by 2055 (HVAC capex compounding) — expect insurance premiums to compound above CPI over the hold.
Questions for the listing agent
- It's been on market 328 days. Have you received any prior offers? Is the seller open to a 12% concession, seller financing, or rate buy-down credit?
- What does the HOA fee cover, when was the last increase, and are there any pending special assessments or reserve-fund shortfalls?
- Why hasn't it sold? Are there any deal-killer items the seller is aware of (foundation, flood, title, zoning, code violations)?
- Is there a deadline driving the sale (1031 exchange, divorce, estate, relocation)? That informs how much negotiation room exists.
- Schools are B-rated — typically a magnet for longer-tenancy family renters. What's the average tenant stay here, and is there a school-zone premium baked into asking?
- What's the average days-on-market for RENTAL listings here right now (not sales)? A rising rental-DOM trend means longer vacancies and softer asking-rent achievability than the comps imply.
- What's the recent tenant-quality profile in this submarket — average credit score on applications, eviction rate, late-payment / NSF rate, and stable-employment percentage? A property-management company in the area should have these aggregated.
- How much new for-sale + rental construction is in the pipeline within 1–3 miles? Heavy new supply typically softens prices + rents 12–24 months out; constrained supply supports both.
Investment metrics
- 1% rule
- 1.79% ✓
- Cap rate
- 13.58%
- Cash-on-cash
- 26.04%
- DSCR
- 2.16
- GRM
- 4.7
CMA / ARV
- ARV (on-the-fly)
- $446,040
- Comps found
- 3
Show comp detail 3 sales within ~0.75 mi
| Address | Dist | Beds/Ba | Sqft | Sold | Price | $/sf | Match |
|---|---|---|---|---|---|---|---|
| 23 Cedar Xing | 0.05mi | 2/2.0 | 1,080 (0%) | 6mo | $206,626 | $191 | 92 |
| — | 0.52mi | 2/2.5 | 1,114 (+3%) | 16mo | $460,000 | $413 | 55 |
| 28 Morford Pl | 0.60mi | 1/1.0 (-1) | 930 (-14%) | 17mo | $390,000 | $419 | 26 |
Match score weights: distance 35% · size 25% · config 20% · recency 20%. Top-matched comps best support the ARV.
Projected returns pro-forma
-3.0% appreciation · 6.45% rent growth · sell at horizon
- IRR
- 24.0%
- Equity multiple
- 2.04×
- Total profit
- $58,860
- Equity at exit
- $30,258
- IRR
- 34.1%
- Equity multiple
- 4.71×
- Total profit
- $210,544
- Equity at exit
- $17,546
Cash invested: $56,820 (down + closing). Projections, not guarantees.
Landlord ↔ Tenant lean methodology
- Overall (STATE)
- 21 Tenant-Leaning
- State New Jersey
- 21 Tenant-Leaning · D+6
- County
- — inherits STATE
- City
- — inherits STATE
ZIP-level market 07701
- Rents YoY
- 6.5%
- Active inventory
- 137
- Price-to-rent
- 4.7×
Monthly cashflow live
- Estimated rent
- $3,627 high interval (Pro) →
- Mortgage (P&I)
- −$1,064
- Tax est. 1.5%
- −$254 /mo · $3,044/yr
- Insurance
- −$85
- HOA
- −$230
- Vacancy / Maint / Mgmt
- −$762
- Net cashflow
- $1,233
Break-even live
UW: 25.0% down · 7.5% · 30yr · 1.5% tax · 5.0% vac · 8.0% maint · 8.0% mgmt
Financing live
Cash to close
- Down payment
- $50,732
- Closing costs
- $6,088
- Reserves months
- —
- Total cash needed
- —
Loan-product check · same deal, 3 products live
Conventional
25% down · 7.5% · 30yr
- Down + closing
- —
- Monthly P&I
- —
- Monthly cashflow
- —
- DSCR
- —
- Eligible?
- —
Personal DTI + credit; lowest rate.
DSCR
20% down · 8.5% · 30yr
- Down + closing
- —
- Monthly P&I
- —
- Monthly cashflow
- —
- DSCR
- —
- Eligible?
- —
No personal income docs; deal must DSCR.
Hard money
10% down · 12.0% · 12mo
- Down + closing
- —
- Monthly P&I
- —
- Monthly cashflow
- —
- DSCR
- —
- Eligible?
- —
Short-term bridge; refi at stabilization.
Rent comps 14 comps
| Address | Beds | Baths | Sqft | Rent | $/sqft | DOM | Units | Dist |
|---|---|---|---|---|---|---|---|---|
| 116 Chestnut St Red Bank, NJ | 1.0–2.0 | 1.0–2.0 | 1063 | $5,204 | $4.89 | 1d | 2 | 0.28mi |
| 35 E Westside Ave Red Bank, NJ | 3.0 | 1.5 | 1400 | $3,650 | $2.61 | 15d | 1 | 0.38mi |
| 170 Monmouth St Red Bank, NJ | 1.0–2.0 | 1.0–2.0 | 1063 | $4,195 | $3.94 | 1d | 1 | 0.42mi |
| 335 Broad St Red Bank, NJ | 2.0 | 1.0 | 810 | $2,750 | $3.40 | 1d | 1 | 0.52mi |
| 8 E Front St Unit 204 Red Bank, NJ | 2.0 | 1.0 | 1400 | $3,600 | $2.57 | 1d | 1 | 0.76mi |
| 96-98 Wallace St Red Bank, NJ | 2.0 | 1.0 | 1500 | $2,550 | $1.70 | 5d | 1 | 0.82mi |
| 183-213 Branch Ave Red Bank, NJ | 1.0–2.0 | 1.0 | 657 | $2,895 | $4.41 | 1d | 2 | 0.85mi |
| 155 Manor Dr Red Bank, NJ | 2.0 | 1.0 | 1168 | $2,900 | $2.48 | 10d | 1 | 0.87mi |
| 19 Manor Dr Red Bank, NJ | 2.0 | 1.0 | 798 | $2,600 | $3.26 | 1d | 1 | 0.89mi |
| 321 Spring St #9 Red Bank, NJ | 2.0 | 2.5 | 1125 | $3,600 | $3.20 | 1d | 1 | 1.00mi |
| 20 Tower Hill Dr #1009 Red Bank, NJ | 1.0 | 1.5 | 1136 | $3,100 | $2.73 | 1d | 1 | 1.11mi |
| 96 Lake Shore Dr Red Bank, NJ | 3.0 | 2.0 | 1382 | $5,500 | $3.98 | 2d | 1 | 1.12mi |
| 5B Auburn Ct Red Bank, NJ | 2.0 | 2.0 | 1142 | $3,300 | $2.89 | 24d | 1 | 1.34mi |
| 34 Lexington Ct Red Bank, NJ | 1.0 | 1.0 | 999 | $2,800 | $2.80 | 3d | 1 | 1.49mi |
HOA detail
- Monthly dues
- $230 · $2,760/yr
Listing history 21 events
-
2026-06-18days on market $202,930 Active 328 DOM
-
2026-06-17days on market $202,930 Active 327 DOM
-
2026-06-16days on market $202,930 Active 326 DOM
-
2026-06-15days on market $202,930 Active 325 DOM
-
2026-06-13days on market $202,930 Active 323 DOM
-
2026-06-09days on market $202,930 Active 319 DOM
-
2026-06-08days on market $202,930 Active 318 DOM
-
2026-06-07days on market $202,930 Active 317 DOM
-
2026-06-04days on market $202,930 Active 314 DOM
-
2026-06-03days on market $202,930 Active 313 DOM
-
2026-06-02days on market $202,930 Active 312 DOM
-
2026-06-01days on market $202,930 Active 311 DOM
-
2026-05-31days on market $202,930 Active 310 DOM
-
2026-02-24status Active
-
2026-02-21historical
-
2025-07-22$202,930 Active
-
2025-07-20historical
-
2025-07-15price $202,930
-
2025-01-20$196,068 Active
-
2024-12-17historical
-
2024-06-19$196,068 Active
ⓘ Source: listings_history table (triggers on properties + properties_extension) + one-shot
backfill from property_details.listing_events for pre-trigger history.
Climate risk First Street
- Flood 1/10 Low FEMA zone X (unshaded) · 0% chance over 30 yrs
- Wildfire 1/10 Low
- Heat 8/10 Severe 7 d/yr ≥95°F today · 16 d/yr by 30 yrs out
- Wind 8/10 Severe 80% chance of damaging wind over 30 yrs
- Air quality 3/10 Moderate 3 unhealthy d/yr today · 4 by 30 yrs out
Nearby sold comps map
Loading sold comps map…
Walkable amenities ~0.75 mi
Loading nearby amenities…
Taxation est. · year 1
- Rental income
- $43,523
- − Mortgage interest
- −$11,367
- − Property taxes
- −$3,044
- − Insurance
- −$1,015
- − Repairs & maintenance
- −$3,482
- − Management
- −$3,482
- − HOA
- −$2,760
- − Depreciation
- −$5,903
- Taxable income
- $12,470
- Est. tax owed @ 24.0%
- −$2,993
- After-tax cash flow
- $11,802/yr
For passive investors: Depreciation is non-cash, so a rental often shows a tax loss while cash-flowing — sheltering income. Rental losses are passive: they offset passive income freely, and up to $25,000/yr can offset ordinary (W-2) income if you actively participate and your MAGI is under $100k (phasing out to $0 by $150k); unused losses carry forward. On sale, claimed depreciation is recaptured at up to 25%, and gains may owe capital-gains tax (a 1031 exchange can defer both). Figures are a year-1 estimate at your 24.0% rate — not tax advice; consult a CPA.
Schools (NCES district)
- District
- Red Bank Regional School District
- NCES district ID
- 3413750
- Math proficiency
- 34% ▼ -14.00%
- Reading proficiency
- 49% ▼ -18.00%
- Median HH income
- $141,699
- Composite
- 44.45/100
- National rank
- #2805
- State rank
- #143 of 472 in NJ
Livability — Red Bank
- Score
- 82/100
- State rank
- #45
- US rank
- #1151
Category grades
Schools grade is shown separately in the Schools card above.
Census & demographics
- Census place
- Red Bank, NJ
- County
- Monmouth County · 505,557 people
- City population
- 24,376
- Metro
- New York-Newark-Jersey City, NY-NJ-PA
- Population (ZIP)
- 24,376
- Household income
- $112,143
- Rent vs Own
- Severe rent burden
- 854.0
Population outlook (Monmouth County) Hauer SSP2
- Today (2025)
- 620,308 people
- By 2030
- 612,309 · -1.3%
- By 2040
- 587,297 · -5.3%
- By 2050
- 551,342 · -11.1%
- By 2075
- 472,934 · -23.8%
- By 2100
- 381,534 · -38.5%
Race, ethnicity, and origin ACS 2023
- Neighborhood character
- Predominantly White (73%)
- Race & ethnicity
- White 73% Hispanic / Latino 18% Two or more races 8% Black 4% Native American 2% Asian 2%
- Hispanic origin (detail)
- Mexican 13% Puerto Rican 2%
- Common ancestry
- Romanian 5% Scotch-Irish 2% Lithuanian 2%
- Foreign-born
- 14% · Canada, Dominican Republic, China
- Languages at home
- 81% English-only · Spanish 14% Other Indo-European 3%
Political lean MEDSL · Monmouth
- 2024 margin
- R (+11.4) · D 43.4% · R 54.8% · Other 1.8%
- 2008→2024 swing
- -7.7pp toward R · 2008: -3.7pp · 2024: -11.4pp
- All cycles
- 2024: R+11.4 2020: R+2.8 2016: R+9.5 2012: R+5.5 2008: R+3.7
Not yet ingested
- Civics
- —
Market trends
- HPI YoY
- ▼ -428.28%
- Current HPI
- 350.124
- Rent YoY
- ▲ 6.45%
- Metro
- New York-Newark-Jersey City, NY-NJ-PA
- State GDP YoY
- ▲ 2.05%
- F500 in state
- 34
Industry mix (Fortune 500 HQ in NJ)
| Industry | F500 HQs | Revenue |
|---|---|---|
| Consumer Goods | 3 | $31B |
|
||
| Pharmaceuticals | 2 | $153B |
|
||
| Technology | 2 | $21B |
|
||
| Insurance | 2 | $20B |
|
||
| Healthcare | 2 | $19B |
|
||
| Financial Services | 1 | $70B |
|
||
Price history
+3.5% since first listed8 events — show timeline
- 2026-02-24 Relisted — BRIGHT MLS
- 2026-02-21 Listing Removed — BRIGHT MLS
- 2025-07-22 Listed $202,930 BRIGHT MLS
- 2025-07-20 Listing Removed — BRIGHT MLS
- 2025-07-15 Price Changed $202,930 BRIGHT MLS
- 2025-01-20 Listed $196,068 BRIGHT MLS
- 2024-12-17 Listing Removed — BRIGHT MLS
- 2024-06-19 Listed $196,068 BRIGHT MLS
Cash-flow waterfall
monthlySold comps — $/sqft
last 12 mo · ≤1 miLoading sold comps…