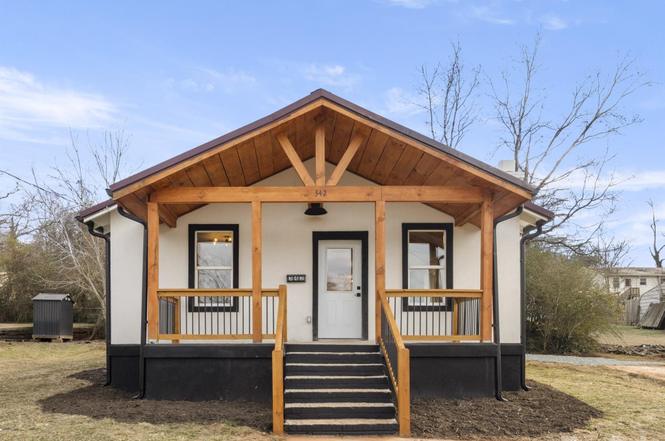
342 N Cleghorn St · Rutherfordton, NC
Flood risk 1/10 · Minimal
- FEMA flood zone
- X (unshaded)
- Chance of flooding over 30 yrs
- 0.0%
- Est. flood insurance / yr
- $507 – $1,088
Fire risk 3/10 · Minor
- Est. fire insurance / yr
- $906 – $1,684
Heat risk 6/10 · Moderate
- Hot days now (above 105°F)
- 7 days/yr
- Hot days in 30 yrs
- 17 days/yr
Wind risk 2/10 · Minimal
- Chance of severe wind over 30 yrs
- 0.0%
Air-quality risk 3/10 · Minor
- Unhealthy air days now
- 3 days/yr
- Unhealthy air days in 30 yrs
- 3 days/yr
Risk factors via First Street. Map © Google.
Why this score? — see what drove the D- grade
The composite is a weighted blend of 9 inputs, each scored 0–100. Each bar is that input's sub-score; the figure is the points it added to the 100-point composite (weight × sub-score).
- Cash flow +14.8/30.0
- DSCR +4.5/10.0
- 1% rule +4.1/10.0
- Livability +3.7/5.0
- Schools +3.6/10.0
- Rent growth +2.5/5.0
- Condition / age +2.5/5.0
- ARV discount +0.0/15.0
- Appreciation +0.0/10.0
$200,000
🖨 Deal sheet (PDF) 📄 Offer letter ✓ Due diligence
Listing remarks
Positioned in the heart of downtown Rutherfordton, this beautifully remodeled bungalow offers the rare combination of quality craftsmanship, walkable mountain-town living and long-term value in one of Western North Carolina’s fastest-growing small towns. Thoughtfully renovated from top to bottom, the two-bedroom, one-bath home features vaulted exposed-beam ceilings, a charming fireplace, luxury vinyl plank flooring, solid-surface countertops, custom cabinetry, rustic hood vent, dedicated laundry room and tasteful designer finishes throughout. Major upgrades include new plumbing, electrical, windows, gutters, stucco siding, HVAC system and metal roof, delivering near-new confidence at
Key facts
- Custom cabinetry
- Charming fireplace
- Remodeled bungalow
Tags
Property features AI
Finance
- HOA & community: No HOA
Exterior
- Parking: Driveway
- Utilities: City water; Public sewer; Electricity connected; Propane available
- Home design: Single family residence (residential); One level; Completed development; R2 zoning
- Construction: Site-built construction; Hard stucco exterior; Metal roof; Crawl space foundation
- Exterior features: Covered front porch; Cleared, level lot with green area; Concrete, gravel and paved road access (publicly maintained)
Interior
- Kitchen: Dishwasher; Electric oven; Electric range; Exhaust hood; Refrigerator
- Bedrooms: 2 bedrooms on the main level
- Flooring: Vinyl flooring
- Bathrooms: 1 full bathroom on the main level
- Heating & cooling: Electric heating; Heat pump; Electric cooling; Heat pump cooling
- Interior features: Vaulted ceilings; 7 total rooms
- Laundry & utility: Dedicated laundry room
Neighborhood map
What this means for you Summary
Snapshot
- This is a 2-bed/1.0-bath single-family listed at $200k.
Deal economics
- At list price, monthly cash flow is $56 ($668/yr) — positive.
- The deal already cash-flows at list — no discount required.
- To meet the 1% rule (rent ≥ 1% of price), the offer needs to be $182k (9.0% below list).
- Recommended offer: $182k (9.0% below list) — sets the bar for 1% rule, market timing.
- Cap rate 6.6% vs local median 3.0% in Rutherfordton — top-decile yield for the area; either an underpriced asset or a hidden risk that comps aren't pricing in. Stress-test before assuming the spread holds.
Location & tenants
- Location reads 73/100 on livability (#67 in NC) — a middle-class / working-renter tenant base. Strengths: cost of living A+, housing A+, health & safety A+; Watch: crime D, amenities F, commute F.
- Rutherford County Schools (rural): math 43% / reading 44% proficiency, ranked #98 of 178 in NC (top 55%) — families likely to look elsewhere, expect single-tenant / working-renter base with shorter leases; 60% free/reduced lunch — lower-income household profile, screen leases tightly.
- Zoned schools: Rutherfordton Elementary School (math 37% / reading 47%, grade F, #633 of 1,410 statewide, top 48%, 390 students, 99% FRL); R-S Middle School (math 32% / reading 43%, grade F, #256 of 475 statewide, top 55%, 574 students, 100% FRL); R-S Central High School (math 62% / reading 42%, grade D+, #292 of 535 statewide, top 56%, 758 students, 100% FRL) — zoned schools average 99% FRL vs 60% district-wide (39 pts higher); higher-poverty schools than district average — tighter screening recommended.
- Market conditions: 318 active listings in the ZIP; 1 comparable units currently listed for rent nearby; 193 units permitted in Rutherford County in 2024 (0 in 5+ unit buildings).
Forward outlook
- Local home prices are declining (-3.0%/yr); year-one equity from $1k of loan paydown is wiped out by about $6k of value loss. Plan a longer hold.
- Rutherford County population projected at -17% by 2050 — secular population decline; favor cash flow + early exit over multi-decade hold.
Negotiation context
- It's been on market 110 days — a 9% lower offer ($182k) is reasonable based on typical stale-listing flexibility.
- 2 sale attempts with the ask held roughly flat each time — persistent listings suggest the price (not the market) is what's stuck; bring a comps-based counter.
Risks & watch-outs
- Watch-outs: built in 1940 — expect roof / HVAC / electrical / plumbing capex.
- Climate carrying-cost: extreme-heat days projected 7→17/yr by 2055 (HVAC capex compounding) — expect insurance premiums to compound above CPI over the hold.
Questions for the listing agent
- It's been on market 110 days. Have you received any prior offers? Is the seller open to a 9% concession, seller financing, or rate buy-down credit?
- Built in 1940 — when were the roof, HVAC, electrical panel, plumbing, and water heater last replaced?
- Why hasn't it sold? Are there any deal-killer items the seller is aware of (foundation, flood, title, zoning, code violations)?
- Is there a deadline driving the sale (1031 exchange, divorce, estate, relocation)? That informs how much negotiation room exists.
- Schools are D-rated, which usually means shorter tenancies and higher turnover. Who's the typical renter profile here, and what's been the actual vacancy rate?
- Crime grade is D in this area — have there been break-ins, vandalism, or insurance claims at this property in the last 3 years? What carrier currently insures it and at what premium?
- The area grade is low — what's the realistic commute time and amenity access for the typical tenant pool here? Any planned neighborhood developments (good or bad) we should know about?
- What's the average days-on-market for RENTAL listings here right now (not sales)? A rising rental-DOM trend means longer vacancies and softer asking-rent achievability than the comps imply.
- What's the recent tenant-quality profile in this submarket — average credit score on applications, eviction rate, late-payment / NSF rate, and stable-employment percentage? A property-management company in the area should have these aggregated.
- How much new for-sale + rental construction is in the pipeline within 1–3 miles? Heavy new supply typically softens prices + rents 12–24 months out; constrained supply supports both.
Investment metrics
- 1% rule
- 0.91% ✗
- Cap rate
- 6.63%
- Cash-on-cash
- 1.19%
- DSCR
- 1.05
- GRM
- 9.2
CMA / ARV
- ARV (on-the-fly)
- $138,232
- Comps found
- 6
Show comp detail 6 sales within ~0.75 mi
| Address | Dist | Beds/Ba | Sqft | Sold | Price | $/sf | Match |
|---|---|---|---|---|---|---|---|
| 246 Elm St | 0.09mi | 2/1.0 | 810 (-13%) | 12mo | $145,000 | $179 | 64 |
| 112 Levi St | 0.41mi | 3/1.0 (+1) | 912 (-2%) | 18mo | $63,500 | $70 | 56 |
| 138 North St | 0.63mi | 2/1.0 | 937 (+0%) | 17mo | $190,000 | $203 | 56 |
| 165 N Mitchell St | 0.44mi | 2/1.0 | 1,059 (+13%) | 6mo | $136,800 | $129 | 52 |
| 123 Cedar St | 0.19mi | 3/1.5 (+1) | 1,056 (+13%) | 23mo | $150,000 | $142 | 44 |
| 156 Gabriel St | 0.58mi | 2/1.0 | 809 (-13%) | 24mo | $120,000 | $148 | 31 |
Match score weights: distance 35% · size 25% · config 20% · recency 20%. Top-matched comps best support the ARV.
Projected returns pro-forma
-3.0% appreciation · 3.0% rent growth · sell at horizon
- IRR
- -14.4%
- Equity multiple
- 0.49×
- Total profit
- $-28,837
- Equity at exit
- $29,821
- IRR
- -5.6%
- Equity multiple
- 0.64×
- Total profit
- $-20,436
- Equity at exit
- $17,292
Cash invested: $56,000 (down + closing). Projections, not guarantees.
Landlord ↔ Tenant lean methodology
- Overall (STATE)
- 85 Strongly Landlord-Friendly
- State North Carolina
- 85 Strongly Landlord-Friendly · R+3
- County
- — inherits STATE
- City
- — inherits STATE
ZIP-level market 28139
- Home prices YoY
- -21.6%
- Active inventory
- 318
- Price-to-rent
- 9.2×
Monthly cashflow live
- Estimated rent
- $1,820 medium interval (Pro) →
- Mortgage (P&I)
- −$1,049
- Tax est. 1.5%
- −$250 /mo · $3,000/yr
- Insurance
- −$83
- HOA
- −$0
- Vacancy / Maint / Mgmt
- −$382
- Net cashflow
- $56
Break-even live
Sensitivity live
| Price | -10% $194 | -5% $125 | +0% $56 | +5% $-13 | +10% $-83 |
|---|---|---|---|---|---|
| Rent | -10% $-88 | -5% $-16 | +0% $56 | +5% $128 | +10% $199 |
| Rate | -1.0pp $156 | -0.5pp $107 | base $56 | +0.5pp $4 | +1.0pp $-49 |
UW: 25.0% down · 7.5% · 30yr · 1.5% tax · 5.0% vac · 8.0% maint · 8.0% mgmt
Financing live
Cash to close
- Down payment
- $50,000
- Closing costs
- $6,000
- Reserves months
- —
- Total cash needed
- —
Loan-product check · same deal, 3 products live
Conventional
25% down · 7.5% · 30yr
- Down + closing
- —
- Monthly P&I
- —
- Monthly cashflow
- —
- DSCR
- —
- Eligible?
- —
Personal DTI + credit; lowest rate.
DSCR
20% down · 8.5% · 30yr
- Down + closing
- —
- Monthly P&I
- —
- Monthly cashflow
- —
- DSCR
- —
- Eligible?
- —
No personal income docs; deal must DSCR.
Hard money
10% down · 12.0% · 12mo
- Down + closing
- —
- Monthly P&I
- —
- Monthly cashflow
- —
- DSCR
- —
- Eligible?
- —
Short-term bridge; refi at stabilization.
Rent comps 1 comps
| Address | Beds | Baths | Sqft | Rent | $/sqft | DOM | Units | Dist |
|---|---|---|---|---|---|---|---|---|
| 125 Central St Rutherfordton, NC | 1.0 | 1.0 | 740 | $1,820 | $2.46 | 15d | 1 | 0.39mi |
Listing history 20 events
-
2026-06-22days on market $200,000 Active 110 DOM
-
2026-06-19days on market $200,000 Active 108 DOM
-
2026-06-18days on market $200,000 Active 107 DOM
-
2026-06-17days on market $200,000 Active 106 DOM
-
2026-06-16days on market $200,000 Active 105 DOM
-
2026-06-15days on market $200,000 Active 104 DOM
-
2026-06-14days on market $200,000 Active 102 DOM
-
2026-06-13days on market $200,000 Active 101 DOM
-
2026-06-10days on market $200,000 Active 99 DOM
-
2026-06-09days on market $200,000 Active 98 DOM
-
2026-06-08days on market $200,000 Active 97 DOM
-
2026-06-07days on market $200,000 Active 96 DOM
-
2026-06-02days on market $200,000 Active 91 DOM
-
2026-06-01days on market $200,000 Active 90 DOM
-
2026-05-31days on market $200,000 Active 89 DOM
-
2026-05-30days on market $200,000 Active 88 DOM
-
2026-05-20status Active
-
2026-04-10status Pending
-
2026-03-19historical Active Under Contract
-
2026-01-22$200,000 Active
ⓘ Source: listings_history table (triggers on properties + properties_extension) + one-shot
backfill from property_details.listing_events for pre-trigger history.
Climate risk First Street
- Flood 1/10 Low FEMA zone X (unshaded) · 0% chance over 30 yrs
- Wildfire 3/10 Moderate
- Heat 6/10 Major 7 d/yr ≥105°F today · 17 d/yr by 30 yrs out
- Wind 2/10 Low 0% chance of damaging wind over 30 yrs
- Air quality 3/10 Moderate 3 unhealthy d/yr today · 3 by 30 yrs out
Nearby sold comps map
Loading sold comps map…
Walkable amenities ~0.75 mi
Loading nearby amenities…
Taxation est. · year 1
- Rental income
- $21,840
- − Mortgage interest
- −$11,203
- − Property taxes
- −$3,000
- − Insurance
- −$1,000
- − Repairs & maintenance
- −$1,747
- − Management
- −$1,747
- − Depreciation
- −$5,818
- Taxable loss
- −$2,676
- Est. tax savings @ 24.0%
- +$642
- After-tax cash flow
- $1,310/yr
For passive investors: Depreciation is non-cash, so a rental often shows a tax loss while cash-flowing — sheltering income. Rental losses are passive: they offset passive income freely, and up to $25,000/yr can offset ordinary (W-2) income if you actively participate and your MAGI is under $100k (phasing out to $0 by $150k); unused losses carry forward. On sale, claimed depreciation is recaptured at up to 25%, and gains may owe capital-gains tax (a 1031 exchange can defer both). Figures are a year-1 estimate at your 24.0% rate — not tax advice; consult a CPA.
Schools (NCES district)
- District
- Rutherford County Schools
- NCES district ID
- 3704080
- Math proficiency
- 43% ▼ -1.00%
- Reading proficiency
- 44% ▼ -2.00%
- Median HH income
- $36,490
- Composite
- 36.11/100
- National rank
- #4753
- State rank
- #98 of 178 in NC
Livability — Rutherfordton
- Score
- 73/100
- State rank
- #67
- US rank
- #5114
Category grades
Schools grade is shown separately in the Schools card above.
Census & demographics
- Census place
- Rutherfordton, NC
- Population (ZIP)
- 18,887
Population outlook (Rutherford County) Hauer SSP2
- Today (2025)
- 63,695 people
- By 2030
- 61,670 · -3.2%
- By 2040
- 57,212 · -10.2%
- By 2050
- 52,763 · -17.2%
- By 2075
- 44,493 · -30.1%
- By 2100
- 38,127 · -40.1%
Race, ethnicity, and origin ACS 2023
- Neighborhood character
- Predominantly White (86%)
- Race & ethnicity
- White 86% Black 6% Two or more races 5% Hispanic / Latino 4%
- Common ancestry
- Serbian 3% Slovak 2% Lithuanian 1%
- Foreign-born
- 3% · Canada
- Languages at home
- 96% English-only · Spanish 3%
Political lean MEDSL · Rutherford
- 2024 margin
- Solid R (+47.8) · D 25.8% · R 73.6%
- 2008→2024 swing
- -16.0pp toward R · 2008: -31.8pp · 2024: -47.8pp
- All cycles
- 2024: R+47.8 2020: R+45.8 2016: R+47.9 2012: R+33.5 2008: R+31.8
Not yet ingested
- Civics
- —
Market trends
- HPI YoY
- ▼ -68.65%
- Current HPI
- 249.7007
- Rent YoY
- —
- Metro
- —
- State GDP YoY
- ▲ 3.28%
- F500 in state
- 26
Industry mix (Fortune 500 HQ in NC)
| Industry | F500 HQs | Revenue |
|---|---|---|
| Financial Services | 2 | $213B |
|
||
| Retail | 2 | $95B |
|
||
| Industrial Conglomerate | 1 | $38B |
|
||
| Metals / Steel | 1 | $35B |
|
||
| Utilities | 1 | $30B |
|
||
| Industrial Machinery | 1 | $19B |
|
||
Price history
4 events — show timeline
- 2026-05-20 Relisted — CANOPYMLS as Distributed by MLS Grid
- 2026-04-10 Pending — CANOPYMLS as Distributed by MLS Grid
- 2026-03-19 Contingent — CANOPYMLS as Distributed by MLS Grid
- 2026-01-22 Listed $200,000 CANOPYMLS as Distributed by MLS Grid
Property tax history
-4.6%/yrLatest (2025): $198 · +24.0% YoY. Source: county tax records.
Cash-flow waterfall
monthlySold comps — $/sqft
last 12 mo · ≤1 miLoading sold comps…