 🏗️ New Construction
16640 Woodland Retreat Ln · Grangerland, TX
Flood risk No data
- FEMA flood zone
- —
- Chance of flooding over 30 yrs
- —
- Est. flood insurance / yr
- —
Fire risk No data
- Est. fire insurance / yr
- —
Heat risk No data
- Hot days now (above threshold)
- —
- Hot days in 30 yrs
- —
Wind risk No data
- Chance of severe wind over 30 yrs
- —
Air-quality risk No data
- Unhealthy air days now
- —
- Unhealthy air days in 30 yrs
- —
Risk factors via First Street. Map © Google.
Why this score? — see what drove the D+ grade
The composite is a weighted blend of 9 inputs, each scored 0–100. Each bar is that input's sub-score; the figure is the points it added to the 100-point composite (weight × sub-score).
- Cash flow +13.7/30.0
- ARV discount +7.5/15.0
- Schools +5.1/10.0
- Condition / age +4.8/5.0
- 1% rule +4.1/10.0
- DSCR +4.1/10.0
- Rent growth +3.3/5.0
- Livability +2.5/5.0
- Appreciation +0.0/10.0
$278,990
🖨 Deal sheet (PDF) 📄 Offer letter ✓ Due diligence
Listing remarks
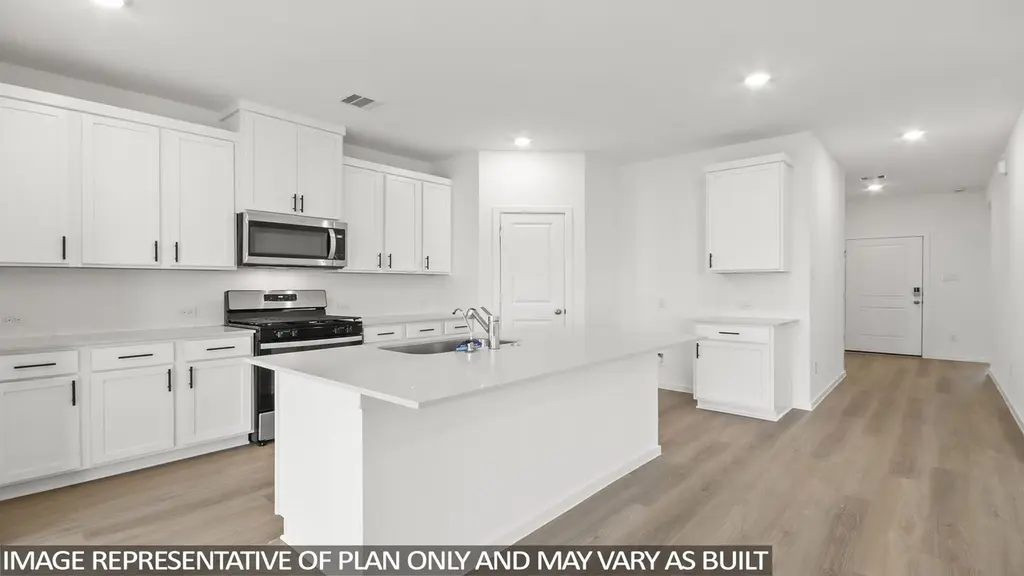
WONDERFUL NEW D. R. HORTON BUILT 1 STORY IN GRANGER PINES! Popular Split Plan Layout! 4 Beds and 2 Full Baths! Impressive Foyer Leads to Open Concept Living Room and Gourmet Island Kitchen with Quartz Counter tops, Tile Backsplash, Upgraded 42 Inch Cabinets with Modern Cabinet Hardware & Large Walk-In Pantry. Privately Located Primary Suite Features Great Bathroom With Separate Tub & Shower, Two Sinks, & Walk-In Closet! Generously Sized Secondary Bedrooms! Large Covered Patio, Full Sod, & Sprinkler System Included! Tankless Water Heater and Smart Home Package Included! Awesome Community with On-Site Elementary School, Acres of preserved open space, natural creeks, walk
Key facts
- Split plan layout
- Quartz counter tops
- Tile backsplash
Tags
Property features AI
Finance
- Other: Located in a subdivision
- HOA & community: Association: Associa Principal Management; Annual association fee of $650
Exterior
- Parking: Attached 2-car garage
- Security: Prewired for security; Smoke detectors
- Utilities: Public water; Public sewer
- Home design: Residential property under construction; New construction by D.R. Horton; Slab foundation; Composition roof
- Construction: Brick, cement siding, and stone exterior; Built in 2026
- Exterior features: Covered patio; Private yard; Porch; Patio; Deck; Fence (back yard); Sprinkler/irrigation
Interior
- Kitchen: Dishwasher; Disposal; Gas oven; Gas range; Microwave; Kitchen island; Quartz counters; Pantry; Walk-in pantry; Breakfast bar
- Bedrooms: 4 total rooms (includes bedrooms and living spaces)
- Flooring: Carpet; Plank; Vinyl
- Bathrooms: 2 full bathrooms; Double vanity; Soaking tub and separate shower
- Heating & cooling: Central heating (gas); Central electric air conditioning; Programmable thermostat
- Interior features: Breakfast bar; Double vanity; High ceilings; Kitchen/family room combo; Kitchen/dining combo; Living/dining room; Kitchen island; Pantry; Walk-in pantry; Quartz counters; Soaking tub; Separate shower; Programmable thermostat; Low emissivity windows
- Laundry & utility: Washer hookup; Electric dryer hookup; Tankless water heater
Neighborhood map
What this means for you Summary
Snapshot
- This is a 4-bed/2.0-bath single-family listed at $279k. Condition is rated excellent.
Deal economics
- At list price, monthly cash flow is $21 ($249/yr) — positive.
- To cash-flow at today's rent, offer at most $275k (1.3% below list).
- To meet the 1% rule (rent ≥ 1% of price), the offer needs to be $248k (11.2% below list).
- Recommended offer: $248k (11.2% below list) — sets the bar for 1% rule.
- Cap rate 6.4% vs local median 5.1% in Grangerland — meaningfully above typical; check what's discounted (condition, days-on-market, listing class) to confirm the premium yield is real.
Location & tenants
- Location reads: area grade D — affects rentability + tenant quality, not the cash-flow math above.
- Conroe ISD (other): math 57% / reading 57% proficiency, ranked #69 of 826 in TX (top 8%) — acceptable for families but not a draw, mixed tenant base, ~2y average lease.
- Zoned schools: Milam El (math 49% / reading 35%, grade F, #1,335 of 4,322 statewide, top 33%, 524 students, 82% FRL); Moorhead J H (math 35% / reading 42%, grade F, #704 of 1,662 statewide, top 43%, 1,391 students, 82% FRL); Conroe H S (math 32% / reading 51%, grade F, #767 of 1,632 statewide, top 47%, 4,915 students, 61% FRL) — zoned schools average 75% FRL vs 34% district-wide (40 pts higher); higher-poverty schools than district average — tighter screening recommended.
- Zoned-school proficiency averages 41% at this address vs 57% district-wide (-16 pts) — the specific schools serving this property underperform the Conroe ISD average; the district grade overstates school quality for this exact location.
- Market conditions: Rents rising (+3.3%/yr); 1117 active listings in the ZIP; 4 comparable units currently listed for rent nearby; rentals lingering (median 46d on market — plan ~5-8 weeks vacancy on turnover, expect pricing pressure); 50% of comp listings sitting > 30 days — soft ceiling on asking rent; solid renter incomes; 13,259 units permitted in Montgomery County in 2024 (1,402 in 5+ unit buildings).
- This rent runs 35% of the median local income ($85k/yr) — at the standard rent-burdened threshold; future hikes will face affordability resistance.
Forward outlook
- Local home prices are declining (-3.0%/yr); year-one equity from $2k of loan paydown is wiped out by about $8k of value loss. Plan a longer hold.
- Montgomery County population projected at +65% by 2050 — long-run rental-demand tailwind backs the buy-and-hold thesis.
Negotiation context
- It's been on market 38 days — a 3% lower offer ($271k) is reasonable based on typical stale-listing flexibility.
Questions for the listing agent
- It's been on market 38 days. Have you received any prior offers? Is the seller open to a 11% concession, seller financing, or rate buy-down credit?
- What does the HOA fee cover, when was the last increase, and are there any pending special assessments or reserve-fund shortfalls?
- Is there a deadline driving the sale (1031 exchange, divorce, estate, relocation)? That informs how much negotiation room exists.
- The area grade is low — what's the realistic commute time and amenity access for the typical tenant pool here? Any planned neighborhood developments (good or bad) we should know about?
- What's the average days-on-market for RENTAL listings here right now (not sales)? A rising rental-DOM trend means longer vacancies and softer asking-rent achievability than the comps imply.
- What's the recent tenant-quality profile in this submarket — average credit score on applications, eviction rate, late-payment / NSF rate, and stable-employment percentage? A property-management company in the area should have these aggregated.
- How much new for-sale + rental construction is in the pipeline within 1–3 miles? Heavy new supply typically softens prices + rents 12–24 months out; constrained supply supports both.
Investment metrics
- 1% rule
- 0.91% ✗
- Cap rate
- 6.38%
- Cash-on-cash
- 0.33%
- DSCR
- 1.01
- GRM
- 9.2
CMA / ARV
- ARV (median comp)
- $272,497
- List price
- $278,990
- Delta
- 2.38%
- Verdict
- FAIR
- Comps
- 20 within 1.0 mi
Show comp detail 12 sales within ~0.75 mi
| Address | Dist | Beds/Ba | Sqft | Sold | Price | $/sf | Match |
|---|---|---|---|---|---|---|---|
| 15557 Granger Green Way | 0.10mi | 4/2.0 | 1,750 (0%) | 1mo | $266,990 | $153 | 95 |
| 16787 Country Roots Ave | 0.12mi | 4/2.0 | 1,750 (0%) | 1mo | $274,990 | $157 | 94 |
| 16771 Country Roots Ave | 0.16mi | 4/2.0 | 1,750 (0%) | 0mo | $279,990 | $160 | 92 |
| 16807 Country Roots Ave | 0.07mi | 4/2.0 | 1,796 (+3%) | 2mo | $277,990 | $155 | 91 |
| 15623 Tranquil Pines St | 0.24mi | 3/2.0 (-1) | 1,697 (-3%) | 1mo | $254,990 | $150 | 78 |
| 16811 Country Roots Ave | 0.07mi | 3/2.0 (-1) | 1,575 (-10%) | 3mo | $259,990 | $165 | 73 |
| 16900 Hazelnut Dr | 0.44mi | 4/3.0 | 1,721 (-2%) | 2mo | $269,990 | $157 | 71 |
| 16912 Hazelnut Dr | 0.46mi | 4/3.0 | 1,721 (-2%) | 4mo | $259,990 | $151 | 68 |
| 15427 Woody Haven Dr | 0.18mi | 3/2.0 (-1) | 1,516 (-13%) | 1mo | $249,990 | $165 | 64 |
| 16980 Hazelnut Dr | 0.62mi | 3/2.0 (-1) | 1,869 (+7%) | 3mo | $259,900 | $139 | 52 |
| 14308 Ash Tree Dr | 0.66mi | 3/2.0 (-1) | 1,932 (+10%) | 2mo | $269,900 | $140 | 45 |
| 17014 Hazelnut Dr | 0.70mi | 3/2.0 (-1) | 1,932 (+10%) | 3mo | $274,900 | $142 | 42 |
Match score weights: distance 35% · size 25% · config 20% · recency 20%. Top-matched comps best support the ARV.
Projected returns pro-forma
-3.0% appreciation · 3.3% rent growth · sell at horizon
- IRR
- -15.4%
- Equity multiple
- 0.45×
- Total profit
- $-42,014
- Equity at exit
- $40,630
- IRR
- -6.3%
- Equity multiple
- 0.59×
- Total profit
- $-31,499
- Equity at exit
- $23,561
Cash invested: $76,299 (down + closing). Projections, not guarantees.
Landlord ↔ Tenant lean methodology
- Overall (STATE)
- 87 Strongly Landlord-Friendly
- State Texas
- 87 Strongly Landlord-Friendly · R+5
- County
- — inherits STATE
- City
- — inherits STATE
ZIP-level market 77302
- Rents YoY
- 3.3%
- Active inventory
- 1117
- Price-to-rent
- 9.4×
Monthly cashflow live
- Estimated rent
- $2,478 medium interval (Pro) →
- Mortgage (P&I)
- −$1,429
- Tax est. 1.5%
- −$341 /mo · $4,087/yr
- Insurance
- −$114
- HOA
- −$54
- Vacancy / Maint / Mgmt
- −$520
- Net cashflow
- $21
Break-even live
Sensitivity live
| Price | -10% $209 | -5% $115 | +0% $21 | +5% $-73 | +10% $-168 |
|---|---|---|---|---|---|
| Rent | -10% $-175 | -5% $-77 | +0% $21 | +5% $119 | +10% $217 |
| Rate | -1.0pp $158 | -0.5pp $90 | base $21 | +0.5pp $-50 | +1.0pp $-122 |
UW: 25.0% down · 7.5% · 30yr · 1.5% tax · 5.0% vac · 8.0% maint · 8.0% mgmt
Financing live
Cash to close
- Down payment
- $68,124
- Closing costs
- $8,175
- Reserves months
- —
- Total cash needed
- —
Loan-product check · same deal, 3 products live
Conventional
25% down · 7.5% · 30yr
- Down + closing
- —
- Monthly P&I
- —
- Monthly cashflow
- —
- DSCR
- —
- Eligible?
- —
Personal DTI + credit; lowest rate.
DSCR
20% down · 8.5% · 30yr
- Down + closing
- —
- Monthly P&I
- —
- Monthly cashflow
- —
- DSCR
- —
- Eligible?
- —
No personal income docs; deal must DSCR.
Hard money
10% down · 12.0% · 12mo
- Down + closing
- —
- Monthly P&I
- —
- Monthly cashflow
- —
- DSCR
- —
- Eligible?
- —
Short-term bridge; refi at stabilization.
Rent comps 4 comps
| Address | Beds | Baths | Sqft | Rent | $/sqft | DOM | Units | Dist |
|---|---|---|---|---|---|---|---|---|
| 16703 Twisted Pine Dr Conroe, TX | 3.0–4.0 | 2.0–3.0 | 1671 | $2,230 | $1.33 | 0d | 13 | 0.84mi |
| 15447 Dapple Bluff Ln Conroe, TX | 4.0 | 2.5 | 2265 | $2,900 | $1.28 | 45d | 1 | 0.97mi |
| 16393 Many Trees Ln Conroe, TX | 3.0 | 2.0 | 1540 | $1,795 | $1.17 | 45d | 1 | 1.29mi |
| 16350 Many Trees Ln Conroe, TX | 3.0 | 2.0 | 1550 | $1,500 | $0.97 | 26d | 1 | 1.38mi |
HOA detail
- Monthly dues
- $54 · $648/yr
- Likely covers
- water
Listing history 15 events
-
2026-06-21days on market $278,990 Active 38 DOM
-
2026-06-18days on market $278,990 Active 35 DOM
-
2026-06-17days on market $278,990 Active 34 DOM
-
2026-06-16days on market $278,990 Active 33 DOM
-
2026-06-15days on market $278,990 Active 32 DOM
-
2026-06-13days on market $278,990 Active 30 DOM
-
2026-06-09days on market $278,990 Active 26 DOM
-
2026-06-08days on market $278,990 Active 25 DOM
-
2026-06-07days on market $278,990 Active 24 DOM
-
2026-06-04days on market $278,990 Active 21 DOM
-
2026-06-03pricedays on market $278,990 Active 20 DOM
-
2026-06-02days on market $280,990 Active 19 DOM
-
2026-06-01days on market $280,990 Active 18 DOM
-
2026-05-31days on market $280,990 Active 17 DOM
-
2026-05-14$280,990 Active 765-char remark
ⓘ Source: listings_history table (triggers on properties + properties_extension) + one-shot
backfill from property_details.listing_events for pre-trigger history.
Nearby sold comps map
Loading sold comps map…
Walkable amenities ~0.75 mi
Loading nearby amenities…
Taxation est. · year 1
- Rental income
- $29,740
- − Mortgage interest
- −$15,264
- − Property taxes
- −$4,087
- − Insurance
- −$1,362
- − Repairs & maintenance
- −$2,379
- − Management
- −$2,379
- − HOA
- −$648
- − Depreciation
- −$7,927
- Taxable loss
- −$4,307
- Est. tax savings @ 24.0%
- +$1,034
- After-tax cash flow
- $1,283/yr
For passive investors: Depreciation is non-cash, so a rental often shows a tax loss while cash-flowing — sheltering income. Rental losses are passive: they offset passive income freely, and up to $25,000/yr can offset ordinary (W-2) income if you actively participate and your MAGI is under $100k (phasing out to $0 by $150k); unused losses carry forward. On sale, claimed depreciation is recaptured at up to 25%, and gains may owe capital-gains tax (a 1031 exchange can defer both). Figures are a year-1 estimate at your 24.0% rate — not tax advice; consult a CPA.
Condition & rehab AI · 26 photos
This home is in excellent condition with modern finishes and a well-maintained exterior. It is move-in ready and would benefit from a smart home package and landscaping improvements to further enhance its value.
Value-add opportunities
- Both Smart home package — Enhances home's appeal and functionality
- Both Landscaping improvements — Enhances curb appeal and property value
- Both Smart security system — Enhances safety and property value
Renovation cost estimate screening
Value-add ROI direction
- Both Smart home package — Enhances home's appeal and functionality ↑
- Both Landscaping improvements — Enhances curb appeal and property value ↑
- Both Smart security system — Enhances safety and property value ↑
ⓘ Cost ranges are severity-bucket heuristics (US national rule-of-thumb). Get contractor quotes + a written scope before underwriting a rehab budget.
Schools (NCES district)
- District
- Conroe ISD
- NCES district ID
- 4815000
- Math proficiency
- 57% ▼ -6.00%
- Reading proficiency
- 57% ▼ -1.00%
- Median HH income
- $71,541
- Composite
- 50.65/100
- National rank
- #1833
- State rank
- #69 of 826 in TX
Livability — Grangerland
No livability data for this city. (Only ~50 U.S. cities are tracked.)
Census & demographics
- County
- Montgomery County · 663,713 people
- Metro
- Houston-The Woodlands-Sugar Land, TX
- Population (ZIP)
- 21,546
- Household income
- $84,673
- Rent vs Own
- Severe rent burden
- 205.0
Population outlook (Montgomery County) Hauer SSP2
- Today (2025)
- 713,896 people
- By 2030
- 805,263 · +12.8%
- By 2040
- 992,708 · +39.1%
- By 2050
- 1,179,590 · +65.2%
- By 2075
- 1,628,084 · +128.1%
- By 2100
- 1,937,880 · +171.5%
Race, ethnicity, and origin ACS 2023
- Neighborhood character
- Majority White (63%)
- Race & ethnicity
- White 63% Hispanic / Latino 29% Two or more races 19% Black 3% Asian 1%
- Hispanic origin (detail)
- Mexican 26% Puerto Rican 1%
- Common ancestry
- Lithuanian 3% Italian 2% Slovak 2%
- Foreign-born
- 13% · Canada, Vietnam, China
- Languages at home
- 78% English-only · Spanish 20% Russian/Polish/Slavic 1% Other Indo-European 0%
Political lean MEDSL · Montgomery
- 2024 margin
- Solid R (+45.5) · D 26.8% · R 72.3%
- 2008→2024 swing
- +7.2pp toward D · 2008: -52.7pp · 2024: -45.5pp
- All cycles
- 2024: R+45.5 2020: R+43.8 2016: R+51.4 2012: R+60.7 2008: R+52.7
Not yet ingested
- Civics
- —
Market trends
- HPI YoY
- ▼ -187.56%
- Current HPI
- 262.1879
- Rent YoY
- ▲ 3.30%
- Metro
- Houston-The Woodlands-Sugar Land, TX
- State GDP YoY
- ▲ 3.95%
- F500 in state
- 110
Industry mix (Fortune 500 HQ in TX)
| Industry | F500 HQs | Revenue |
|---|---|---|
| Energy | 16 | $1,198B |
|
||
| Technology | 5 | $198B |
|
||
| Engineering / Construction | 4 | $72B |
|
||
| Energy Services | 3 | $60B |
|
||
| Utilities | 3 | $41B |
|
||
| Healthcare | 2 | $330B |
|
||
Price history
-0.7% since first listed2 events — show timeline
- 2026-06-02 Price Changed $278,990 HARMLS
- 2026-05-14 Listed $280,990 HARMLS
Cash-flow waterfall
monthlySold comps — $/sqft
last 12 mo · ≤1 miLoading sold comps…