 Duplex
1519 SW Lincoln St · Topeka, KS
Flood risk 1/10 · Minimal
- FEMA flood zone
- X (unshaded)
- Chance of flooding over 30 yrs
- 0.0%
- Est. flood insurance / yr
- $507 – $1,088
Fire risk 1/10 · Minimal
- Est. fire insurance / yr
- $1,154 – $2,142
Heat risk 5/10 · Moderate
- Hot days now (above 107°F)
- 7 days/yr
- Hot days in 30 yrs
- 17 days/yr
Wind risk 2/10 · Minimal
- Chance of severe wind over 30 yrs
- —
Air-quality risk 3/10 · Minor
- Unhealthy air days now
- 3 days/yr
- Unhealthy air days in 30 yrs
- 4 days/yr
Risk factors via First Street. Map © Google.
Why this score? — see what drove the C- grade
The composite is a weighted blend of 9 inputs, each scored 0–100. Each bar is that input's sub-score; the figure is the points it added to the 100-point composite (weight × sub-score).
- Cash flow +23.2/30.0
- DSCR +7.5/10.0
- ARV discount +7.5/15.0
- 1% rule +5.0/10.0
- Rent growth +3.6/5.0
- Livability +3.5/5.0
- Condition / age +2.5/5.0
- Schools +1.7/10.0
- Appreciation +0.0/10.0
$149,000
🖨 Deal sheet (PDF) 📄 Offer letter ✓ Due diligence
Multi-family units
County records classify this as Multi-Family (2-4 Unit). Listing-text estimate: 2 units. confirmed
Listing remarks MLS
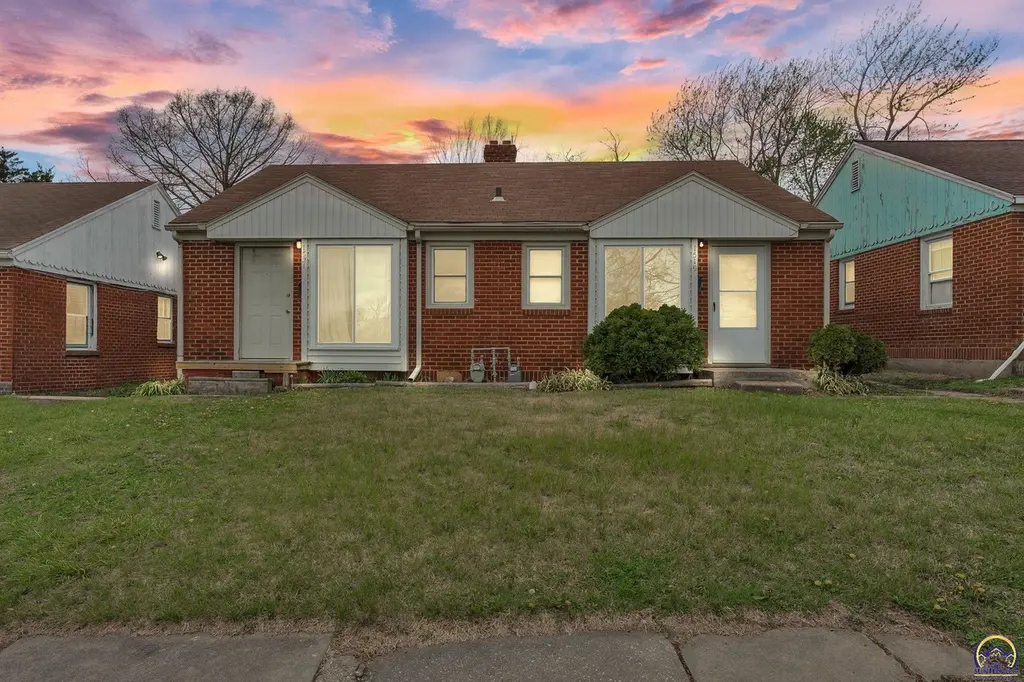
This brick side by side duplex was built in 1945. Both units have nice size living rooms, kitchen/dining combos, utility rooms off kitchen area, 1 bath and 1 large bedroom + central heat and ac. This is one of 3 buildings all in a row. This is a Fannie Mae Homepath Property.
Key facts
- Utility room
- Central heat and air
- Kitchen dining combo
Tags
Property features AI
Finance
- Financial info: Annual tax amount reported
Exterior
- Parking: On-street parking
- Utilities: Public water; Public sewer
- Home design: Residential income property; Multi-family (2–4 units)
- Exterior features: Composition roof; Located on a 0.11-acre lot
Interior
- Flooring: Wood
- Heating & cooling: Central heating; Electric cooling
- Interior features: Wood flooring; Central heating; Electric cooling
Neighborhood map
What this means for you Summary
Snapshot
- This is a 2 × 1-bed/1-bath units multifamily listed at $149k.
Deal economics
- At list price, monthly cash flow is $271 ($3k/yr) — positive. Per door: $135/mo.
- The deal already cash-flows at list — no discount required.
- Meets the 1% rule at list price ($1k rent vs $149k).
- Recommended offer: $145k (3.0% below list) — sets the bar for market timing.
- Cap rate 8.5% vs local median 4.3% in Topeka — top-decile yield for the area; either an underpriced asset or a hidden risk that comps aren't pricing in. Stress-test before assuming the spread holds.
Location & tenants
- Location reads 69/100 on livability (#195 in KS) — a middle-class / working-renter tenant base. Strengths: cost of living A+, housing A+, health & safety A+; Watch: employment C-, crime F, commute F.
- Topeka Public Schools (urban): math 17% / reading 23% proficiency, ranked #158 of 169 in KS (top 94%) — low school quality limits family demand, transient renter base, plan for 1-2y turnover; 69% free/reduced lunch — lower-income household profile, screen leases tightly.
- Zoned schools: Robinson Middle School (math 10% / reading 19%, grade F, #180 of 219 statewide, top 83%, 360 students, 84% FRL); Topeka High (math 11% / reading 20%, grade F, #248 of 327 statewide, top 76%, 1,514 students, 72% FRL).
- Market conditions: Rents rising fast (+4.4%/yr); 131 active listings in the ZIP; 21 comparable units currently listed for rent nearby; rentals at typical pace (median 22d on market — plan ~3-4 weeks tenant-placement turnaround); 219 units permitted in Shawnee County in 2024 (25 in 5+ unit buildings).
Forward outlook
- Local home prices are declining (-3.0%/yr); year-one equity from $1k of loan paydown is wiped out by about $4k of value loss. Plan a longer hold.
- Shawnee County population projected to shrink 7% by 2050 — rents likely to lag national; underwrite the cash flow, not the appreciation.
Negotiation context
- It's been on market 59 days — a 3% lower offer ($145k) is reasonable based on typical stale-listing flexibility.
- 2 sale attempts since 12y ago with the ask held roughly flat each time — persistent listings suggest the price (not the market) is what's stuck; bring a comps-based counter.
- Current owner paid $38k; list at $149k implies a 287% gain — meaningful room to come down on a strong offer.
Risks & watch-outs
- Watch-outs: built in 1945 — expect roof / HVAC / electrical / plumbing capex.
- Climate carrying-cost: extreme-heat days projected 7→17/yr by 2055 (HVAC capex compounding) — expect insurance premiums to compound above CPI over the hold.
Questions for the listing agent
- It's been on market 59 days. Have you received any prior offers? Is the seller open to a 3% concession, seller financing, or rate buy-down credit?
- Can we see the unit-by-unit rent roll, current vacancy, and any below-market leases? What's the average tenancy length?
- What capital expenditures (roof, boiler, parking lot, exteriors) have been made in the last 5 years, and what's planned in the next 2?
- Built in 1945 — when were the roof, HVAC, electrical panel, plumbing, and water heater last replaced?
- Is there a deadline driving the sale (1031 exchange, divorce, estate, relocation)? That informs how much negotiation room exists.
- Schools are D-rated, which usually means shorter tenancies and higher turnover. Who's the typical renter profile here, and what's been the actual vacancy rate?
- Crime grade is F in this area — have there been break-ins, vandalism, or insurance claims at this property in the last 3 years? What carrier currently insures it and at what premium?
- What's the average days-on-market for RENTAL listings here right now (not sales)? A rising rental-DOM trend means longer vacancies and softer asking-rent achievability than the comps imply.
- What's the recent tenant-quality profile in this submarket — average credit score on applications, eviction rate, late-payment / NSF rate, and stable-employment percentage? A property-management company in the area should have these aggregated.
- How much new apartment / multifamily construction is in the pipeline within 1–3 miles? Heavy new supply (>2% of stock underway) typically softens rents 12–24 months out; light construction supports rent growth.
Investment metrics
- 1% rule
- 1.00% ✓
- Cap rate
- 8.47%
- Cash-on-cash
- 7.79%
- DSCR
- 1.35
- GRM
- 8.3
CMA / ARV
No comps found within radius.
Projected returns pro-forma
-3.0% appreciation · 4.39% rent growth · sell at horizon
- IRR
- -3.0%
- Equity multiple
- 0.88×
- Total profit
- $-4,837
- Equity at exit
- $22,216
- IRR
- 8.0%
- Equity multiple
- 1.64×
- Total profit
- $26,717
- Equity at exit
- $12,883
Cash invested: $41,720 (down + closing). Projections, not guarantees.
Landlord ↔ Tenant lean methodology
- Overall (STATE)
- 83 Strongly Landlord-Friendly
- State Kansas
- 83 Strongly Landlord-Friendly · R+10
- County
- — inherits STATE
- City
- — inherits STATE
ZIP-level market 66604
- Rents YoY
- 4.4%
- Active inventory
- 131
- Price-to-rent
- 16.6×
Monthly cashflow live
- Estimated rent
- $1,493 high interval (Pro) →
- Mortgage (P&I)
- −$781
- Tax from tax record
- −$65 /mo · $784/yr
- Insurance
- −$62
- HOA
- −$0
- Vacancy / Maint / Mgmt
- −$314
- Net cashflow
- $271
Break-even live
Sensitivity live
| Price | -10% $355 | -5% $313 | +0% $271 | +5% $229 | +10% $186 |
|---|---|---|---|---|---|
| Rent | -10% $153 | -5% $212 | +0% $271 | +5% $330 | +10% $389 |
| Rate | -1.0pp $346 | -0.5pp $309 | base $271 | +0.5pp $232 | +1.0pp $193 |
2-unit breakdown (identical units grouped — click to expand)
| Units | Beds | Baths | Est. rent |
|---|---|---|---|
| 2× units | 1 | 1 | $1,492 |
| #1 | 1 | 1 | $746 |
| #2 | 1 | 1 | $746 |
| Total (2 units) | $1,493 | ||
UW: 25.0% down · 7.5% · 30yr · 1.5% tax · 5.0% vac · 8.0% maint · 8.0% mgmt
Financing live
Cash to close
- Down payment
- $37,250
- Closing costs
- $4,470
- Reserves months
- —
- Total cash needed
- —
Loan-product check · same deal, 3 products live
Conventional
25% down · 7.5% · 30yr
- Down + closing
- —
- Monthly P&I
- —
- Monthly cashflow
- —
- DSCR
- —
- Eligible?
- —
Personal DTI + credit; lowest rate.
DSCR
20% down · 8.5% · 30yr
- Down + closing
- —
- Monthly P&I
- —
- Monthly cashflow
- —
- DSCR
- —
- Eligible?
- —
No personal income docs; deal must DSCR.
Hard money
10% down · 12.0% · 12mo
- Down + closing
- —
- Monthly P&I
- —
- Monthly cashflow
- —
- DSCR
- —
- Eligible?
- —
Short-term bridge; refi at stabilization.
Rent comps 21 comps
| Address | Beds | Baths | Sqft | Rent | $/sqft | DOM | Units | Dist |
|---|---|---|---|---|---|---|---|---|
| 1510 SW Lane St Topeka, KS | 1.0 | 1.0 | 750 | $675 | $0.90 | 22d | 1 | 0.05mi |
| 1436 SW Byron St Topeka, KS | 2.0 | 1.0 | 900 | $720 | $0.80 | 22d | 1 | 0.11mi |
| 1515 SW 15th St Topeka, KS | 1.0 | 1.0 | 775 | $700 | $0.90 | 22d | 1 | 0.21mi |
| 1116 SW 18th St Topeka, KS | 3.0 | 1.0 | 1105 | $1,175 | $1.06 | 22d | 1 | 0.25mi |
| 1900 SW Washburn Ave Topeka, KS | 2.0 | 1.0 | 883 | $890 | $1.01 | 22d | 1 | 0.41mi |
| 1268 SW Western Ave Unit 1A Topeka, KS | 2.0 | 1.0 | 1404 | $1,000 | $0.71 | 22d | 1 | 0.46mi |
| 1624 SW Polk St Topeka, KS | 3.0 | 2.0 | 1288 | $1,350 | $1.05 | 22d | 1 | 0.46mi |
| 512 SW 14th St Topeka, KS | 2.0 | 1.0 | 815 | $895 | $1.10 | 22d | 1 | 0.59mi |
| 1438 SW Van Buren St Apt 4 Topeka, KS | 2.0 | 1.0 | 700 | $825 | $1.18 | 22d | 1 | 0.78mi |
| 2130 SW Fillmore St Topeka, KS | 2.0 | 1.0 | 800 | $800 | $1.00 | 22d | 1 | 0.78mi |
| 2045 SW Macvicar Ave Topeka, KS | 2.0 | 2.0 | 860 | $875 | $1.02 | 22d | 1 | 0.92mi |
| 1027 SW Woodward Ave Topeka, KS | 3.0 | 1.0 | 864 | $1,195 | $1.38 | 22d | 1 | 0.96mi |
| 2409 SW 21st St Topeka, KS | 3.0 | 1.0 | 890 | $850 | $0.96 | 22d | 1 | 0.97mi |
| 937 SW Jewell Ave Topeka, KS | 3.0 | 1.0 | 1297 | $1,295 | $1.00 | 22d | 1 | 1.05mi |
| 1316 SW 27th St Topeka, KS | 2.0 | 2.0 | 1456 | $1,150 | $0.79 | 22d | 1 | 1.10mi |
| 1623 SW Campbell Ave Topeka, KS | 2.0 | 1.0 | 828 | $1,100 | $1.33 | 22d | 1 | 1.12mi |
| 1414 SW 27th St Topeka, KS | 2.0 | 1.0 | 908 | $825 | $0.91 | 22d | 1 | 1.13mi |
| 507 SW 6th Ave Unit 001 Topeka, KS | 1.0 | 1.0 | 710 | $700 | $0.99 | 22d | 1 | 1.24mi |
| 728 SW Lindenwood Ave Topeka, KS | 2.0 | 1.0 | 968 | $1,195 | $1.23 | 22d | 1 | 1.24mi |
| 603 SW Topeka Blvd Topeka, KS | 1.0 | 1.0 | 710 | $700 | $0.99 | 22d | 1 | 1.24mi |
| 1724 SE Pennsylvania Ave Unit B Topeka, KS | 2.0 | 1.0 | 960 | $850 | $0.89 | 22d | 1 | 1.46mi |
Listing history 9 events
-
2026-06-02days on market $149,000 Active 59 DOM
-
2026-06-01days on market $149,000 Active 58 DOM
-
2026-05-31days on market $149,000 Active 57 DOM
-
2026-05-30days on market $149,000 Active 56 DOM
-
2026-04-04$149,000 Active
-
2016-06-15soldstatus
-
2014-09-30soldstatus 275-char remark
Show marketing remark (275 chars)
This brick side by side duplex was built in 1945. Both units have nice size living rooms, kitchen/dining combos, utility rooms off kitchen area, 1 bath and 1 large bedroom + central heat and ac. This is one of 3 buildings all in a row. This is a Fannie Mae Homepath Property.
-
2014-09-08$35,000 275-char remark
Show marketing remark (275 chars)
This brick side by side duplex was built in 1945. Both units have nice size living rooms, kitchen/dining combos, utility rooms off kitchen area, 1 bath and 1 large bedroom + central heat and ac. This is one of 3 buildings all in a row. This is a Fannie Mae Homepath Property.
-
2000-06-01soldstatus $38,500
ⓘ Source: listings_history table (triggers on properties + properties_extension) + one-shot
backfill from property_details.listing_events for pre-trigger history.
Tax reassessment forecast KS · Resets to sale price
- Current annual tax
- $784 · $65/mo
- Projected year-2 tax
- $2,101 · $175/mo
- Expected delta
- +$1,317/yr (+$110/mo · 168.1%)
ⓘ Screening estimate from a state-policy table — verify with the county assessor before closing.
Climate risk First Street
- Flood 1/10 Low FEMA zone X (unshaded) · 0% chance over 30 yrs
- Wildfire 1/10 Low
- Heat 5/10 Major 7 d/yr ≥107°F today · 17 d/yr by 30 yrs out
- Wind 2/10 Low
- Air quality 3/10 Moderate 3 unhealthy d/yr today · 4 by 30 yrs out
Nearby sold comps map
Loading sold comps map…
Walkable amenities ~0.75 mi
Loading nearby amenities…
Taxation est. · year 1
- Rental income
- $17,916
- − Mortgage interest
- −$8,346
- − Property taxes
- −$784
- − Insurance
- −$745
- − Repairs & maintenance
- −$1,433
- − Management
- −$1,433
- − Depreciation
- −$4,335
- Taxable income
- $840
- Est. tax owed @ 24.0%
- −$202
- After-tax cash flow
- $3,047/yr
For passive investors: Depreciation is non-cash, so a rental often shows a tax loss while cash-flowing — sheltering income. Rental losses are passive: they offset passive income freely, and up to $25,000/yr can offset ordinary (W-2) income if you actively participate and your MAGI is under $100k (phasing out to $0 by $150k); unused losses carry forward. On sale, claimed depreciation is recaptured at up to 25%, and gains may owe capital-gains tax (a 1031 exchange can defer both). Figures are a year-1 estimate at your 24.0% rate — not tax advice; consult a CPA.
Schools (NCES district)
- District
- Topeka Public Schools
- NCES district ID
- 2012260
- Math proficiency
- 17% ▼ -8.00%
- Reading proficiency
- 23% ▼ -2.00%
- Median HH income
- $37,405
- Composite
- 16.69/100
- National rank
- #9167
- State rank
- #158 of 169 in KS
Livability — Topeka
- Score
- 69/100
- State rank
- #195
- US rank
- #8848
Category grades
Schools grade is shown separately in the Schools card above.
Census & demographics
- Census place
- Topeka, KS
- County
- Shawnee County · 118,130 people
- City population
- 118,130
- Metro
- Topeka, KS
- Population (ZIP)
- 23,006
- Household income
- $60,874
- Rent vs Own
- Severe rent burden
- 1192.0
Population outlook (Shawnee County) Hauer SSP2
- Today (2025)
- 179,277 people
- By 2030
- 177,762 · -0.8%
- By 2040
- 172,341 · -3.9%
- By 2050
- 166,330 · -7.2%
- By 2075
- 152,417 · -15.0%
- By 2100
- 134,782 · -24.8%
Race, ethnicity, and origin ACS 2023
- Neighborhood character
- Predominantly White (70%)
- Race & ethnicity
- White 70% Hispanic / Latino 15% Two or more races 11% Black 6% Asian 1%
- Hispanic origin (detail)
- Mexican 12%
- Common ancestry
- Slovak 2% Lithuanian 2% Romanian 1%
- Foreign-born
- 4% · Canada, China
- Languages at home
- 94% English-only · Spanish 4% Other Asian/Pacific 1% Other Indo-European 1%
Political lean MEDSL · Shawnee
- 2024 margin
- Toss-up / Even · D 49.3% · R 48.8% · Other 2.0%
- 2008→2024 swing
- +0.8pp no change · 2008: -0.3pp · 2024: 0.5pp
- All cycles
- 2024: D+0.5 2020: D+3.0 2016: R+2.8 2012: R+1.7 2008: R+0.3
Not yet ingested
- Civics
- —
Market trends
- HPI YoY
- ▼ -151.78%
- Current HPI
- 227.637
- Rent YoY
- ▲ 4.39%
- Metro
- Topeka, KS
- State GDP YoY
- —
- F500 in state
- 0
Price history
+287.0% since first listed5 events — show timeline
- 2026-04-04 Listed $149,000 Sunflower MLS as distributed by MLS GRID
- 2016-06-15 Sold (Public Records) — Public Records
- 2014-09-30 Sold (MLS) — Sunflower MLS as distributed by MLS GRID
- 2014-09-08 Listed $35,000 Sunflower MLS as distributed by MLS GRID
- 2000-06-01 Sold (Public Records) $38,500 Public Records
Property tax history
+2.3%/yrLatest (2025): $784 · +8.9% YoY. Source: county tax records.
Cash-flow waterfall
monthlySold comps — $/sqft
last 12 mo · ≤1 miLoading sold comps…