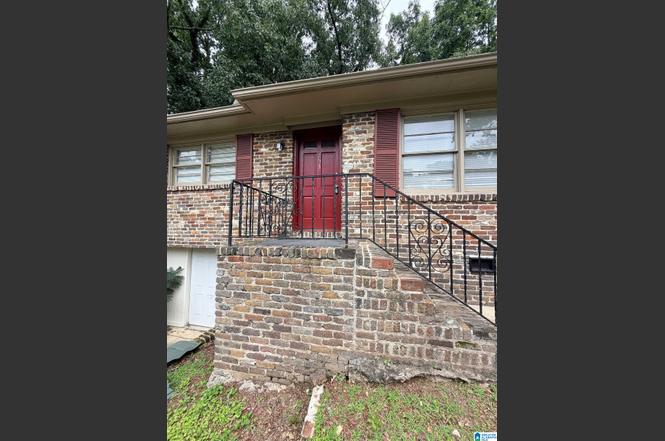
253 Glynn Dr · Birmingham, AL
Flood risk 1/10 · Minimal
- FEMA flood zone
- X (unshaded)
- Chance of flooding over 30 yrs
- 0.0%
- Est. flood insurance / yr
- $473 – $860
Fire risk 3/10 · Minor
- Est. fire insurance / yr
- $916 – $1,700
Heat risk 6/10 · Moderate
- Hot days now (above 105°F)
- 7 days/yr
- Hot days in 30 yrs
- 19 days/yr
Wind risk 6/10 · Moderate
- Chance of severe wind over 30 yrs
- 27.0%
Air-quality risk 5/10 · Moderate
- Unhealthy air days now
- 7 days/yr
- Unhealthy air days in 30 yrs
- 9 days/yr
Risk factors via First Street. Map © Google.
Why this score? — see what drove the B grade
The composite is a weighted blend of 9 inputs, each scored 0–100. Each bar is that input's sub-score; the figure is the points it added to the 100-point composite (weight × sub-score).
- Cash flow +30.0/30.0
- ARV discount +15.0/15.0
- DSCR +10.0/10.0
- 1% rule +9.0/10.0
- Livability +3.4/5.0
- Rent growth +3.3/5.0
- Condition / age +2.5/5.0
- Schools +0.9/10.0
- Appreciation +0.0/10.0
$89,900
🖨 Deal sheet 📄 Offer letter ✓ Due diligence
Listing remarks MLS
OCCUPIED, rental property! Ready for a owner!
Key facts
- Spacious yard
- Outdoor entertaining
- Bright living spaces
Tags
Property features AI
Finance
- Other: Lot size approximately 0.23 acres
- HOA & community: No association fees
Exterior
- Parking: Driveway parking
- Utilities: Public water; Electric water heater; Internet availability unknown
- Home design: Existing single-family property; Basement foundation; Parcel located in the Cloverdale subdivision
- Construction: 4-side brick construction; Basement with poured concrete walls; Partial unfinished basement
- Exterior features: No pool, patio, decks, or garden listed; Not waterfront; Lot view: none
Interior
- Kitchen: Laminate countertops; Electric stove
- Bedrooms: Master bedroom on main level; Two additional bedrooms on main level
- Flooring: Hardwood flooring; Vinyl flooring
- Bathrooms: One full bathroom with tub/shower combo on main level
- Heating & cooling: Central heating; Central cooling
- Interior features: Ceilings: other (see remarks); No interior special features listed
- Laundry & utility: Washer hookup; Electric dryer hookup; Laundry located in the basement (laundry space: other — see remarks)
Neighborhood map
What this means for you Summary
Snapshot
- This is a 3-bed/1.0-bath single-family listed at $90k.
Deal economics
- At list price, monthly cash flow is $355 ($4k/yr) — positive.
- The deal already cash-flows at list — no discount required.
- Meets the 1% rule at list price ($1k rent vs $90k).
- Cap rate 11.0% vs local median 6.2% in Birmingham — top-decile yield for the area; either an underpriced asset or a hidden risk that comps aren't pricing in. Stress-test before assuming the spread holds.
Location & tenants
- Location reads 67/100 on livability (#78 in AL) — a middle-class / working-renter tenant base. Strengths: commute A+, cost of living A+, housing A+; Watch: amenities C-, crime F, employment F.
- Birmingham City (urban): math 4% / reading 20% proficiency, ranked #116 of 129 in AL (top 90%) — low school quality limits family demand, transient renter base, plan for 1-2y turnover; 82% free/reduced lunch — lower-income household profile, screen leases tightly.
- Zoned schools: Martha Gaskins K5 (math 0% / reading 15%, grade F, #598 of 627 statewide, top 96%, 509 students, 87% FRL); Huffman High Schoolmagnet (math 2% / reading 2%, grade F, #291 of 305 statewide, top 100%, 1,147 students, 72% FRL) — zoned schools at 79% FRL track the district average.
- Market conditions: Rents rising (+3.0%/yr); 334 active listings in the ZIP; 34 comparable units currently listed for rent nearby; rentals at typical pace (median 24d on market — plan ~3-4 weeks tenant-placement turnaround); 44% of comp listings sitting > 30 days — soft ceiling on asking rent; 2,114 units permitted in Jefferson County in 2024 (556 in 5+ unit buildings).
Forward outlook
- Local home prices are declining (-3.0%/yr); year-one equity from $622 of loan paydown is wiped out by about $3k of value loss. Plan a longer hold.
- Jefferson County population projected to shrink 4% by 2050 — rents likely to lag national; underwrite the cash flow, not the appreciation.
- At projected returns (-3.0% appreciation + 3.0% rent growth), your $25k cash investment doubles in ~8 years — after that, you're playing with house money.
Negotiation context
- Only 1 days on market — expect competitive offers; lowballing is unlikely to land.
- 3 sale attempts since 11y ago with the ask held roughly flat each time — persistent listings suggest the price (not the market) is what's stuck; bring a comps-based counter.
Risks & watch-outs
- Watch-outs: built in 1957 — expect roof / HVAC / electrical / plumbing capex.
- Climate carrying-cost: major wind risk, 27% chance of damaging wind over 30y; extreme-heat days projected 7→19/yr by 2055 (HVAC capex compounding) — expect insurance premiums to compound above CPI over the hold.
Questions for the listing agent
- Built in 1957 — when were the roof, HVAC, electrical panel, plumbing, and water heater last replaced?
- Is there a deadline driving the sale (1031 exchange, divorce, estate, relocation)? That informs how much negotiation room exists.
- Schools are F-rated, which usually means shorter tenancies and higher turnover. Who's the typical renter profile here, and what's been the actual vacancy rate?
- Crime grade is F in this area — have there been break-ins, vandalism, or insurance claims at this property in the last 3 years? What carrier currently insures it and at what premium?
- What's the average days-on-market for RENTAL listings here right now (not sales)? A rising rental-DOM trend means longer vacancies and softer asking-rent achievability than the comps imply.
- What's the recent tenant-quality profile in this submarket — average credit score on applications, eviction rate, late-payment / NSF rate, and stable-employment percentage? A property-management company in the area should have these aggregated.
- How much new for-sale + rental construction is in the pipeline within 1–3 miles? Heavy new supply typically softens prices + rents 12–24 months out; constrained supply supports both.
Investment metrics
- 1% rule
- 1.40% ✓
- Cap rate
- 11.03%
- Cash-on-cash
- 16.92%
- DSCR
- 1.75
- GRM
- 5.9
CMA / ARV
- ARV (on-the-fly)
- $117,611
- Comps found
- 12
Show comp detail 12 sales within ~0.75 mi
| Address | Dist | Beds/Ba | Sqft | Sold | Price | $/sf | Match |
|---|---|---|---|---|---|---|---|
| 312 Pine St | 0.17mi | 3/1.0 | 1,080 (+0%) | 1mo | $60,000 | $56 | 91 |
| 252 Westwood Dr | 0.09mi | 3/1.5 | 1,124 (+4%) | 6mo | $93,000 | $83 | 82 |
| 408 Ford Way | 0.34mi | 3/1.0 | 1,074 (-0%) | 2mo | $27,500 | $26 | 81 |
| 405 Sunbrook Ave | 0.33mi | 3/1.5 | 1,120 (+4%) | 2mo | $148,000 | $132 | 74 |
| 205 Tucker Ave | 0.31mi | 3/1.0 | 1,012 (-6%) | 5mo | $85,000 | $84 | 71 |
| 201 Carol Dr | 0.55mi | 3/1.0 | 1,096 (+2%) | 2mo | $154,000 | $141 | 70 |
| 252 Meadowdale Ave | 0.21mi | 3/1.0 | 920 (-15%) | 6mo | $89,000 | $97 | 61 |
| 9809 Maple Ln | 0.49mi | 3/1.0 | 1,192 (+10%) | 3mo | $130,000 | $109 | 57 |
| 936 Parkway Dr | 0.71mi | 2/1.0 (-1) | 1,062 (-2%) | 3mo | $104,500 | $98 | 57 |
| 125 Redstone Dr | 0.74mi | 3/1.5 | 1,042 (-3%) | 3mo | $145,000 | $139 | 56 |
| 9817 Virginianna Dr | 0.62mi | 3/1.0 | 989 (-8%) | 4mo | $125,000 | $126 | 53 |
| 173 Redstone Way | 0.62mi | 3/2.0 | 1,182 (+10%) | 1mo | $155,000 | $131 | 50 |
Match score weights: distance 35% · size 25% · config 20% · recency 20%. Top-matched comps best support the ARV.
Projected returns pro-forma
-3.0% appreciation · 3.04% rent growth · sell at horizon
- IRR
- 8.2%
- Equity multiple
- 1.32×
- Total profit
- $8,119
- Equity at exit
- $13,404
- IRR
- 17.5%
- Equity multiple
- 2.45×
- Total profit
- $36,515
- Equity at exit
- $7,773
Cash invested: $25,172 (down + closing). Projections, not guarantees.
Landlord ↔ Tenant lean methodology
- Overall (STATE)
- 90 Strongly Landlord-Friendly
- State Alabama
- 90 Strongly Landlord-Friendly · R+15
- County
- — inherits STATE
- City
- — inherits STATE
ZIP-level market 35215
- Home prices YoY
- -34.4%
- Rents YoY
- 3.0%
- Active inventory
- 334
- Price-to-rent
- 5.9×
Monthly cashflow live
- Estimated rent
- $1,262 high interval (Pro) →
- Mortgage (P&I)
- −$471
- Tax from tax record
- −$133 /mo · $1,601/yr
- Insurance
- −$37
- HOA
- −$0
- Vacancy / Maint / Mgmt
- −$265
- Net cashflow
- $355
Break-even live
UW: 25.0% down · 7.5% · 30yr · 1.5% tax · 5.0% vac · 8.0% maint · 8.0% mgmt
Financing live
Cash to close
- Down payment
- $22,475
- Closing costs
- $2,697
- Reserves months
- —
- Total cash needed
- —
Loan-product check · same deal, 3 products live
Conventional
25% down · 7.5% · 30yr
- Down + closing
- —
- Monthly P&I
- —
- Monthly cashflow
- —
- DSCR
- —
- Eligible?
- —
Personal DTI + credit; lowest rate.
DSCR
20% down · 8.5% · 30yr
- Down + closing
- —
- Monthly P&I
- —
- Monthly cashflow
- —
- DSCR
- —
- Eligible?
- —
No personal income docs; deal must DSCR.
Hard money
10% down · 12.0% · 12mo
- Down + closing
- —
- Monthly P&I
- —
- Monthly cashflow
- —
- DSCR
- —
- Eligible?
- —
Short-term bridge; refi at stabilization.
Rent comps 34 comps
| Address | Beds | Baths | Sqft | Rent | $/sqft | DOM | Units | Dist |
|---|---|---|---|---|---|---|---|---|
| 252 Westwood Dr Birmingham, AL | 3.0 | 1.5 | 1124 | $1,400 | $1.25 | 2d | 1 | 0.06mi |
| 316 Pine St Birmingham, AL | 3.0 | 1.0 | 1232 | $1,100 | $0.89 | 44d | 1 | 0.15mi |
| 252 Meadowdale Ave Birmingham, AL | 3.0 | 1.0 | 920 | $995 | $1.08 | 44d | 1 | 0.18mi |
| 204 McCormick Ave Birmingham, AL | 3.0 | 1.0 | 880 | $980 | $1.11 | 3d | 1 | 0.23mi |
| 221 Lawson Rd Birmingham, AL | 3.0 | 1.5 | 1102 | $1,325 | $1.20 | 24d | 1 | 0.26mi |
| 209 Tucker Ave Birmingham, AL | 3.0 | 1.0 | 1044 | $1,100 | $1.05 | 44d | 1 | 0.28mi |
| 957 Hickory Cir Birmingham, AL | 3.0 | 2.0 | 1364 | $1,195 | $0.88 | 3d | 1 | 0.28mi |
| 9844 Greenlee Rd Birmingham, AL | 3.0 | 1.0 | 1046 | $950 | $0.91 | 44d | 1 | 0.32mi |
| 208 Sam Pate Dr Birmingham, AL | 3.0 | 2.0 | 988 | $1,385 | $1.40 | 2d | 1 | 0.46mi |
| 848 Old Trail Rd Birmingham, AL | 2.0 | 1.5 | 930 | $925 | $0.99 | 24d | 1 | 0.53mi |
| 201 Rose Dr Birmingham, AL | 3.0 | 1.0 | 972 | $1,100 | $1.13 | 16d | 1 | 0.62mi |
| 628 Annie Laura Dr Birmingham, AL | 3.0 | 1.0 | 844 | $1,195 | $1.42 | 44d | 1 | 0.63mi |
| 426 Buckingham Cir Birmingham, AL | 2.0 | 1.5 | 1080 | $1,013 | $0.94 | 44d | 1 | 0.63mi |
| 945 Elizabeth Dr Birmingham, AL | 3.0 | 1.0 | 1227 | $1,125 | $0.92 | 3d | 1 | 0.64mi |
| 241 Mamie Ln Birmingham, AL | 3.0 | 2.0 | 1242 | $1,495 | $1.20 | 3d | 1 | 0.65mi |
| 932 Five Mile Rd Birmingham, AL | 3.0 | 1.5 | 1200 | $1,175 | $0.98 | 19d | 1 | 0.67mi |
| 216 Sanford Dr Birmingham, AL | 3.0 | 1.5 | 1134 | $1,200 | $1.06 | 44d | 1 | 0.77mi |
| 529 Robison Dr Birmingham, AL | 2.0 | 1.0 | 960 | $960 | $1.00 | 21d | 1 | 0.77mi |
| 832 Meadowbrook Dr Birmingham, AL | 3.0 | 2.0 | 1228 | $1,225 | $1.00 | 24d | 1 | 0.81mi |
| 912 Meadowbrook Dr Birmingham, AL | 3.0 | 1.0 | 1178 | $1,100 | $0.93 | 44d | 1 | 0.81mi |
| 940 Meadowbrook Dr Birmingham, AL | 4.0 | 1.0 | 1149 | $1,300 | $1.13 | 44d | 1 | 0.83mi |
| 46 Sunscape Dr Birmingham, AL | 4.0 | 2.0 | 1178 | $1,450 | $1.23 | 44d | 1 | 0.83mi |
| 40 Sunscape Dr Birmingham, AL | 3.0 | 2.0 | 1283 | $1,555 | $1.21 | 2d | 1 | 0.85mi |
| 818 Sunset Dr Birmingham, AL | 3.0 | 1.0 | 992 | $1,000 | $1.01 | 44d | 1 | 0.86mi |
| 217 Killough Dr Birmingham, AL | 3.0 | 2.0 | 1212 | $1,200 | $0.99 | 14d | 1 | 0.89mi |
| 1112 Violet Dr Birmingham, AL | 3.0 | 2.0 | 1414 | $1,600 | $1.13 | 12d | 1 | 1.06mi |
| 603 Camp Ct Birmingham, AL | 3.0 | 1.0 | 936 | $1,300 | $1.39 | 44d | 1 | 1.08mi |
| 520 Camellia Rd Birmingham, AL | 3.0 | 1.0 | 1053 | $1,100 | $1.04 | 3d | 1 | 1.13mi |
| 433 Orchid Rd Birmingham, AL | 3.0 | 1.0 | 1162 | $1,255 | $1.08 | 16d | 1 | 1.22mi |
| 726 Orchard Rd Birmingham, AL | 3.0 | 1.0 | 1120 | $1,095 | $0.98 | 44d | 1 | 1.25mi |
| 9228 Brookhurst Dr Birmingham, AL | 3.0 | 1.0 | 1146 | $999 | $0.87 | 44d | 1 | 1.32mi |
| 736 Gene Reed Rd Birmingham, AL | 3.0 | 2.0 | 1353 | $1,220 | $0.90 | 44d | 1 | 1.37mi |
| 8917 Roebuck Blvd Apt 11 Birmingham, AL | 2.0 | 1.0 | 880 | $725 | $0.82 | 16d | 1 | 1.37mi |
| 1301 5th Pl NW Center Point, AL | 3.0 | 1.0 | 1170 | $1,100 | $0.94 | 3d | 1 | 1.50mi |
Listing history 2 events
-
2026-06-19remarks 637-char remark
-
2026-06-19$89,900 Active 1 DOM
ⓘ Source: listings_history table (triggers on properties + properties_extension) + one-shot
backfill from property_details.listing_events for pre-trigger history.
Tax reassessment forecast AL · Resets to sale price
- Current annual tax
- $1,601 · $133/mo
- Projected year-2 tax
- $1,601 · $133/mo
- Expected delta
- $0/yr ($0/mo · 0.0%)
ⓘ Screening estimate from a state-policy table — verify with the county assessor before closing.
Climate risk First Street
- Flood 1/10 Low FEMA zone X (unshaded) · 0% chance over 30 yrs
- Wildfire 3/10 Moderate
- Heat 6/10 Major 7 d/yr ≥105°F today · 19 d/yr by 30 yrs out
- Wind 6/10 Major 27% chance of damaging wind over 30 yrs
- Air quality 5/10 Major 7 unhealthy d/yr today · 9 by 30 yrs out
Nearby sold comps map
Loading sold comps map…
Walkable amenities ~0.75 mi
Loading nearby amenities…
Taxation est. · year 1
- Rental income
- $15,147
- − Mortgage interest
- −$5,036
- − Property taxes
- −$1,601
- − Insurance
- −$450
- − Repairs & maintenance
- −$1,212
- − Management
- −$1,212
- − Depreciation
- −$2,615
- Taxable income
- $3,023
- Est. tax owed @ 24.0%
- −$725
- After-tax cash flow
- $3,533/yr
For passive investors: Depreciation is non-cash, so a rental often shows a tax loss while cash-flowing — sheltering income. Rental losses are passive: they offset passive income freely, and up to $25,000/yr can offset ordinary (W-2) income if you actively participate and your MAGI is under $100k (phasing out to $0 by $150k); unused losses carry forward. On sale, claimed depreciation is recaptured at up to 25%, and gains may owe capital-gains tax (a 1031 exchange can defer both). Figures are a year-1 estimate at your 24.0% rate — not tax advice; consult a CPA.
Schools (NCES district)
- District
- Birmingham City
- NCES district ID
- 0100390
- Math proficiency
- 4% ▼ -17.00%
- Reading proficiency
- 20% ▼ -4.00%
- Median HH income
- $31,988
- Composite
- 9.49/100
- National rank
- #9850
- State rank
- #116 of 129 in AL
Livability — Birmingham
- Score
- 67/100
- State rank
- #78
- US rank
- #10412
Category grades
Schools grade is shown separately in the Schools card above.
Census & demographics
- Census place
- Birmingham, AL
- County
- Jefferson County · 527,445 people
- City population
- 210,422
- Metro
- Birmingham-Hoover, AL
- Population (ZIP)
- 43,903
- Household income
- $52,793
- Rent vs Own
- Severe rent burden
- 1729.0
Population outlook (Jefferson County) Hauer SSP2
- Today (2025)
- 669,185 people
- By 2030
- 669,694 · +0.1%
- By 2040
- 661,388 · -1.2%
- By 2050
- 643,086 · -3.9%
- By 2075
- 577,267 · -13.7%
- By 2100
- 474,758 · -29.1%
Race, ethnicity, and origin ACS 2023
- Neighborhood character
- Predominantly Black (75%)
- Race & ethnicity
- Black 75% White 15% Hispanic / Latino 7% Two or more races 3%
- Hispanic origin (detail)
- Mexican 4%
- Common ancestry
- Lithuanian 1% Italian 1% Slovak 1%
- Foreign-born
- 4% · Canada
- Languages at home
- 92% English-only · Spanish 7%
Political lean MEDSL · Jefferson
- 2024 margin
- D (+10.4) · D 54.6% · R 44.2% · Other 1.2%
- 2008→2024 swing
- +5.4pp toward D · 2008: 5.1pp · 2024: 10.4pp
- All cycles
- 2024: D+10.4 2020: D+13.2 2016: D+7.2 2012: D+6.0 2008: D+5.1
Not yet ingested
- Civics
- —
Market trends
- HPI YoY
- ▼ -112.97%
- Current HPI
- 215.0607
- Rent YoY
- ▲ 3.04%
- Metro
- Birmingham-Hoover, AL
- State GDP YoY
- ▲ 2.94%
- F500 in state
- 4
Industry mix (Fortune 500 HQ in AL)
| Industry | F500 HQs | Revenue |
|---|---|---|
| Financial Services | 1 | $8B |
|
||
| Healthcare | 1 | $5B |
|
||
Price history
+14.5% since first listed10 events — show timeline
- 2026-06-18 Listed $89,900 Greater Alabama MLS
- 2021-06-09 Sold (Public Records) $82,000 Public Records
- 2021-06-03 Sold (MLS) $82,000 Greater Alabama MLS
- 2021-05-11 Contingent — Greater Alabama MLS
- 2021-05-10 Listed $90,900 Greater Alabama MLS
- 2018-02-02 Sold (Public Records) $75,000 Public Records
- 2015-09-28 Sold (MLS) $70,000 Greater Alabama MLS
- 2015-06-29 Delisted — Greater Alabama MLS
- 2015-06-08 Listed $74,900 Greater Alabama MLS
- 2006-03-09 Sold (Public Records) $78,500 Public Records
Property tax history
+11.3%/yrLatest (2025): $1,601 · +4.2% YoY. Source: county tax records.
Cash-flow waterfall
monthlySold comps — $/sqft
last 12 mo · ≤1 miLoading sold comps…