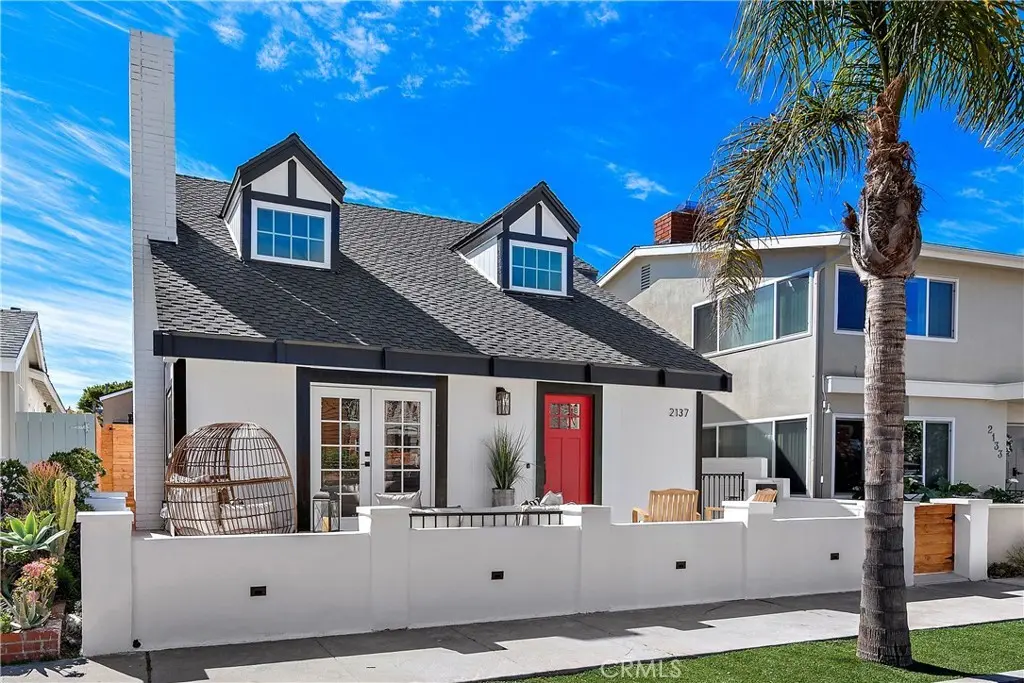
2137 Miramar · Newport Beach, CA
Flood risk 3/10 · Minor
- FEMA flood zone
- X (shaded)
- Chance of flooding over 30 yrs
- 0.18%
- Est. flood insurance / yr
- $507 – $1,088
Fire risk 1/10 · Minimal
- Est. fire insurance / yr
- $659 – $1,223
Heat risk 5/10 · Moderate
- Hot days now (above 83°F)
- 7 days/yr
- Hot days in 30 yrs
- 21 days/yr
Wind risk 1/10 · Minimal
- Chance of severe wind over 30 yrs
- —
Air-quality risk 4/10 · Minor
- Unhealthy air days now
- 6 days/yr
- Unhealthy air days in 30 yrs
- 6 days/yr
Risk factors via First Street. Map © Google.
Why this score? — see what drove the A- grade
The composite is a weighted blend of 9 inputs, each scored 0–100. Each bar is that input's sub-score; the figure is the points it added to the 100-point composite (weight × sub-score).
- Cash flow +30.0/30.0
- 1% rule +10.0/10.0
- DSCR +10.0/10.0
- Appreciation +10.0/10.0
- ARV discount +7.5/15.0
- Rent growth +5.0/5.0
- Schools +4.8/10.0
- Livability +3.8/5.0
- Condition / age +2.5/5.0
$589,999
🖨 Deal sheet 📄 Offer letter ✓ Due diligence
Listing remarks MLS
This is a Co-Ownership opportunity. 1/8th ownership. Adrien is a fully remodeled 1950s bungalow that provides the quintessential Newport Beach experience. Just steps away from Balboa Beach, Newport Bay, and the Wedge, this coastal gem takes serene, beachy vibes to the next level. You'll instantly feel at home in this perfectly manicured south-end neighborhood of the Balboa Penisula. Gorgeous cathedral ceilings, hardwood floors, quality furniture pieces, and exquisite finishes ensure a memorable experience the moment you step through the front door. This 4 bedroom 4 bathroom home that includes a bunkroom accommodates up to 10 guests. Prepare fresh seafood meals while taking in the coastal breeze in Adrien's fully stocked gourmet kitchen. After a long day at the beach wash off in the outdoor shower and head up to the private terrace with outdoor fireplace to watch the breathtaking Southern California sunsets night after night.
Key facts
- Outdoor fireplace
- Private terrace
- Gourmet kitchen
Tags
Neighborhood map
What this means for you Summary
Snapshot
- This is a 4-bed/3.0-bath single-family listed at $590k.
Deal economics
- At list price, monthly cash flow is $4k ($44k/yr) — positive.
- The deal already cash-flows at list — no discount required.
- Meets the 1% rule at list price ($10k rent vs $590k).
- Recommended offer: $519k (12.0% below list) — sets the bar for market timing.
- Cap rate 13.8% vs local median 0.6% in Newport Beach — top-decile yield for the area; either an underpriced asset or a hidden risk that comps aren't pricing in. Stress-test before assuming the spread holds.
Location & tenants
- Location reads 76/100 on livability (#101 in CA, #3,645 nationally) — a middle-class / working-renter tenant base. Strengths: schools A+, amenities A+, employment A+; Watch: health & safety C-, cost of living F.
- Newport-Mesa Unified (urban): math 46% / reading 58% proficiency, ranked #106 of 517 in CA (top 20%) — acceptable for families but not a draw, mixed tenant base, ~2y average lease.
- Market conditions: Rents rising fast (+13.6%/yr); 52 active listings in the ZIP; 40 comparable units currently listed for rent nearby; rentals lingering (median 44d on market — plan ~5-8 weeks vacancy on turnover, expect pricing pressure); 65% of comp listings sitting > 30 days — soft ceiling on asking rent; high-income renter base; 6,974 units permitted in Orange County in 2024 (3,839 in 5+ unit buildings).
- At $9,818/mo this rent would consume 56% of the median local household income ($209k/yr) (locally 72% of renters already pay >50% of income on rent) — very limited rent-growth headroom before tenants either downsize or default.
Forward outlook
- In year one you build about $63k of equity ($4k loan paydown + $59k appreciation (10.0% local appreciation)).
- Orange County population projected at +14% by 2050 — modest demand growth; plan on rents tracking national, not racing it.
- At projected returns (10.0% appreciation + 8.0% rent growth), your $165k cash investment doubles in ~2 years — after that, you're playing with house money.
- By year 2, paydown + projected appreciation supports a ~$101k cash-out refi (75% LTV) — recoverable capital for the next deal without selling this one.
Negotiation context
- It's been on market 272 days — a 12% lower offer ($519k) is reasonable based on typical stale-listing flexibility.
- 12 sale attempts since 5y ago with the ask held roughly flat each time — persistent listings suggest the price (not the market) is what's stuck; bring a comps-based counter.
Risks & watch-outs
- Watch-outs: built in 1950 — expect roof / HVAC / electrical / plumbing capex.
- Climate carrying-cost: extreme-heat days projected 7→21/yr by 2055 (HVAC capex compounding) — expect insurance premiums to compound above CPI over the hold.
Questions for the listing agent
- It's been on market 272 days. Have you received any prior offers? Is the seller open to a 12% concession, seller financing, or rate buy-down credit?
- Built in 1950 — when were the roof, HVAC, electrical panel, plumbing, and water heater last replaced?
- Why hasn't it sold? Are there any deal-killer items the seller is aware of (foundation, flood, title, zoning, code violations)?
- Is there a deadline driving the sale (1031 exchange, divorce, estate, relocation)? That informs how much negotiation room exists.
- Schools are A-rated — typically a magnet for longer-tenancy family renters. What's the average tenant stay here, and is there a school-zone premium baked into asking?
- What's the average days-on-market for RENTAL listings here right now (not sales)? A rising rental-DOM trend means longer vacancies and softer asking-rent achievability than the comps imply.
- What's the recent tenant-quality profile in this submarket — average credit score on applications, eviction rate, late-payment / NSF rate, and stable-employment percentage? A property-management company in the area should have these aggregated.
- How much new for-sale + rental construction is in the pipeline within 1–3 miles? Heavy new supply typically softens prices + rents 12–24 months out; constrained supply supports both.
Investment metrics
- 1% rule
- 1.66% ✓
- Cap rate
- 13.78%
- Cash-on-cash
- 26.72%
- DSCR
- 2.19
- GRM
- 5.0
CMA / ARV
- ARV (median comp)
- $4,032,565
- List price
- $589,999
- Delta
- -85.37%
- Verdict
- UNDERPRICED
- Comps
- 20 within 1.0 mi
Show comp detail 12 sales within ~0.75 mi
| Address | Dist | Beds/Ba | Sqft | Sold | Price | $/sf | Match |
|---|---|---|---|---|---|---|---|
| 2618 Cove St | 0.29mi | 3/3.5 (-1) | 1,897 (-9%) | 2mo | $4,500,000 | $2,372 | 63 |
| 1517 Miramar Dr | 0.44mi | 3/2.0 (-1) | 2,090 (+0%) | 11mo | $3,200,000 | $1,531 | 62 |
| 300 Heliotrope Ave | 0.48mi | 4/4.0 | 2,094 (+0%) | 19mo | $4,370,000 | $2,087 | 58 |
| 516-1/2 Acacia Ave Unit 1/2 | 0.60mi | 3/3.5 (-1) | 2,139 (+2%) | 14mo | $4,200,000 | $1,964 | 50 |
| 121 Onyx Ave | 0.75mi | 3/3.0 (-1) | 1,975 (-5%) | 8mo | $3,400,000 | $1,722 | 44 |
| 237 Heliotrope Ave | 0.43mi | 3/3.0 (-1) | 1,816 (-13%) | 15mo | $4,650,000 | $2,561 | 41 |
| 612 Goldenrod Ave | 0.72mi | 3/4.0 (-1) | 2,041 (-2%) | 16mo | $3,050,000 | $1,494 | 40 |
| 209 E Bayfront | 0.69mi | 4/3.5 | 2,315 (+11%) | 11mo | $8,500,000 | $3,672 | 39 |
| 1727 Galatea Ter | 0.65mi | 3/2.0 (-1) | 2,320 (+11%) | 4mo | $8,505,000 | $3,666 | 38 |
| 518 Angelita Dr | 0.62mi | 4/3.0 | 2,345 (+12%) | 16mo | $4,520,000 | $1,928 | 37 |
| 126 Abalone Ave | 0.69mi | 5/4.5 (+1) | 2,219 (+6%) | 12mo | $5,500,000 | $2,479 | 36 |
| 123 Crystal Ave | 0.67mi | 3/4.5 (-1) | 2,389 (+14%) | 12mo | $7,000,000 | $2,930 | 24 |
Match score weights: distance 35% · size 25% · config 20% · recency 20%. Top-matched comps best support the ARV.
Projected returns pro-forma
10.0% appreciation · 8.0% rent growth · sell at horizon
- IRR
- 47.5%
- Equity multiple
- 4.68×
- Total profit
- $607,664
- Equity at exit
- $531,518
- IRR
- 43.4%
- Equity multiple
- 11.50×
- Total profit
- $1,734,049
- Equity at exit
- $1,146,238
Cash invested: $165,200 (down + closing). Projections, not guarantees.
Landlord ↔ Tenant lean methodology
- Overall (STATE)
- 18 Strongly Tenant-Friendly
- State California
- 18 Strongly Tenant-Friendly · D+13
- County
- — inherits STATE
- City
- — inherits STATE
ZIP-level market 92661
- Home prices YoY
- 4.5%
- Rents YoY
- 13.6%
- Active inventory
- 52
- Price-to-rent
- 5.0×
Monthly cashflow live
- Estimated rent
- $9,818 medium interval (Pro) →
- Mortgage (P&I)
- −$3,094
- Tax est. 1.5%
- −$737 /mo · $8,850/yr
- Insurance
- −$246
- HOA
- −$0
- Vacancy / Maint / Mgmt
- −$2,062
- Net cashflow
- $3,679
Break-even live
UW: 25.0% down · 7.5% · 30yr · 1.5% tax · 5.0% vac · 8.0% maint · 8.0% mgmt
Financing live
Cash to close
- Down payment
- $147,500
- Closing costs
- $17,700
- Reserves months
- —
- Total cash needed
- —
Loan-product check · same deal, 3 products live
Conventional
25% down · 7.5% · 30yr
- Down + closing
- —
- Monthly P&I
- —
- Monthly cashflow
- —
- DSCR
- —
- Eligible?
- —
Personal DTI + credit; lowest rate.
DSCR
20% down · 8.5% · 30yr
- Down + closing
- —
- Monthly P&I
- —
- Monthly cashflow
- —
- DSCR
- —
- Eligible?
- —
No personal income docs; deal must DSCR.
Hard money
10% down · 12.0% · 12mo
- Down + closing
- —
- Monthly P&I
- —
- Monthly cashflow
- —
- DSCR
- —
- Eligible?
- —
Short-term bridge; refi at stabilization.
Rent comps 40 comps
| Address | Beds | Baths | Sqft | Rent | $/sqft | DOM | Units | Dist |
|---|---|---|---|---|---|---|---|---|
| 2035 Miramar Dr Newport Beach, CA | 4.0 | 3.0 | 2028 | $21,000 | $10.36 | 43d | 1 | 0.11mi |
| 2137 Channel Rd Newport Beach, CA | 4.0 | 2.5 | 2632 | $13,750 | $5.22 | 24d | 1 | 0.15mi |
| 2137 Channel Rd Newport Beach, CA | 4.0 | 2.5 | 2598 | $14,000 | $5.39 | 3d | 1 | 0.15mi |
| 2037 E Ocean Blvd Newport Beach, CA | 4.0 | 4.0 | 2943 | $30,000 | $10.19 | 43d | 1 | 0.15mi |
| 2105 E Balboa Blvd Newport Beach, CA | 4.0 | 4.5 | 2985 | $28,500 | $9.55 | 43d | 1 | 0.19mi |
| 2105 E Balboa Blvd Newport Beach, CA | 4.0 | 4.5 | 2985 | $28,500 | $9.55 | 3d | 1 | 0.19mi |
| 2025 E Balboa Blvd Newport Beach, CA | 4.0 | 4.0 | 3000 | $14,000 | $4.67 | 43d | 1 | 0.23mi |
| 2824 Ocean Blvd Corona del Mar, CA | 5.0 | 4.0 | 2800 | $15,995 | $5.71 | 43d | 1 | 0.34mi |
| 507 J St Newport Beach, CA | 4.0 | 3.0 | 1800 | $30,000 | $16.67 | 24d | 1 | 0.36mi |
| 1576 E Ocean Blvd Newport Beach, CA | 4.0 | 3.0 | 2321 | $16,500 | $7.11 | 43d | 1 | 0.37mi |
| 315 Goldenrod Ave Corona del Mar, CA | 4.0 | 3.5 | 2800 | $25,000 | $8.93 | 43d | 1 | 0.44mi |
| 315 1/2 Goldenrod Ave Corona del Mar, CA | 3.0 | 2.5 | 1690 | $9,995 | $5.91 | 7d | 1 | 0.44mi |
| 225 Iris Ave Corona del Mar, CA | 3.0 | 2.0 | 1426 | $15,500 | $10.87 | 43d | 1 | 0.45mi |
| 2801 Bayside Dr Corona del Mar, CA | 4.0 | 4.5 | 2801 | $19,995 | $7.14 | 43d | 1 | 0.46mi |
| 1509 E Bay Ave Newport Beach, CA | 4.0 | 4.5 | 2582 | $45,000 | $17.43 | 43d | 1 | 0.48mi |
| 409 Goldenrod Ave Unit A Corona Del Mar, CA | 3.0 | 2.5 | 1809 | $9,750 | $5.39 | 43d | 1 | 0.50mi |
| 411 Goldenrod Ave Unit B Corona Del Mar, CA | 3.0 | 3.0 | 1900 | $8,575 | $4.51 | 19d | 1 | 0.51mi |
| 1411 E Bay Ave Newport Beach, CA | 4.0 | 4.0 | 2548 | $27,500 | $10.79 | 43d | 1 | 0.53mi |
| 412 Goldenrod Ave Unit B Corona Del Mar, CA | 3.0 | 3.0 | 1419 | $9,000 | $6.34 | 43d | 1 | 0.53mi |
| 411 1/2 Heliotrope Ave Corona del Mar, CA | 3.0 | 3.5 | 1847 | $14,000 | $7.58 | 4d | 1 | 0.54mi |
| 232 Jasmine Ave Corona del Mar, CA | 3.0 | 3.0 | 1720 | $12,800 | $7.44 | 43d | 1 | 0.54mi |
| 435 Dahlia Ave Corona del Mar, CA | 3.0 | 3.0 | 1536 | $6,975 | $4.54 | 43d | 1 | 0.54mi |
| 441 Carnation Ave Corona del Mar, CA | 3.0 | 2.5 | 2084 | $13,000 | $6.24 | 24d | 1 | 0.55mi |
| 319 Jasmine Ave Corona del Mar, CA | 3.0 | 3.5 | 2472 | $16,000 | $6.47 | 6d | 1 | 0.56mi |
| 436 Fernleaf Ave Unit 1/2 Corona Del Mar, CA | 3.0 | 2.0 | 1440 | $5,750 | $3.99 | 24d | 1 | 0.57mi |
| 504 Avocado Ave Corona del Mar, CA | 3.0 | 3.0 | 2006 | $20,000 | $9.97 | 43d | 1 | 0.58mi |
| 212 Marguerite Ave Corona del Mar, CA | 3.0 | 2.5 | 2500 | $25,000 | $10.00 | 43d | 1 | 0.61mi |
| 214 Marguerite Ave Corona del Mar, CA | 3.0 | 3.0 | 1894 | $30,000 | $15.84 | 43d | 1 | 0.62mi |
| 309 Marguerite Ave Unit C Corona del Mar, CA | 3.0 | 2.0 | 1444 | $6,850 | $4.74 | 22d | 1 | 0.62mi |
| 517 Fernleaf Ave Corona del Mar, CA | 4.0 | 3.5 | 2000 | $13,000 | $6.50 | 24d | 1 | 0.63mi |
| 604 Acacia Ave Corona del Mar, CA | 3.0 | 2.5 | 2127 | $18,000 | $8.46 | 43d | 1 | 0.65mi |
| 1214 E Balboa Blvd Newport Beach, CA | 4.0 | 3.5 | 2672 | $22,000 | $8.23 | 43d | 1 | 0.67mi |
| 112 Abalone Ave Newport Beach, CA | 5.0 | 4.0 | 2893 | $12,800 | $4.42 | 43d | 1 | 0.68mi |
| 1901 Altura Dr Corona del Mar, CA | 4.0 | 3.0 | 2616 | $14,250 | $5.45 | 43d | 1 | 0.70mi |
| 707 Begonia Ave Corona del Mar, CA | 3.0 | 3.5 | 2085 | $10,500 | $5.04 | 43d | 1 | 0.72mi |
| 608 1/2 Heliotrope Ave Corona Del Mar, CA | 3.0 | 2.0 | 1475 | $5,575 | $3.78 | 4d | 1 | 0.73mi |
| 512 Jasmine Ave Corona del Mar, CA | 3.0 | 3.5 | 2097 | $19,995 | $9.54 | 43d | 1 | 0.73mi |
| 125 Grand Canal Newport Beach, CA | 5.0 | 4.0 | 2520 | $30,000 | $11.90 | 43d | 1 | 0.75mi |
| 705 1/2 Goldenrod Ave Corona del Mar, CA | 3.0 | 2.5 | 1543 | $7,500 | $4.86 | 12d | 1 | 0.75mi |
| 117 Marine Ave Newport Beach, CA | 5.0 | 5.0 | 2279 | $15,000 | $6.58 | 43d | 1 | 0.75mi |
Listing history 45 events
-
2026-06-18days on market $589,999 Active 272 DOM
-
2026-06-17days on market $589,999 Active 271 DOM
-
2026-06-16days on market $589,999 Active 270 DOM
-
2026-06-15days on market $589,999 Active 269 DOM
-
2026-06-13days on market $589,999 Active 267 DOM
-
2026-06-13days on market $589,999 Active 266 DOM
-
2026-06-09days on market $589,999 Active 263 DOM
-
2026-06-08days on market $589,999 Active 262 DOM
-
2026-06-07days on market $589,999 Active 261 DOM
-
2026-06-04days on market $589,999 Active 258 DOM
-
2026-06-03days on market $589,999 Active 257 DOM
-
2026-06-02days on market $589,999 Active 256 DOM
-
2026-06-01days on market $589,999 Active 255 DOM
-
2026-05-31days on market $589,999 Active 254 DOM
-
2025-09-19$589,999 Active 938-char remark
Show marketing remark (938 chars)
This is a Co-Ownership opportunity. 1/8th ownership. Adrien is a fully remodeled 1950s bungalow that provides the quintessential Newport Beach experience. Just steps away from Balboa Beach, Newport Bay, and the Wedge, this coastal gem takes serene, beachy vibes to the next level. You'll instantly feel at home in this perfectly manicured south-end neighborhood of the Balboa Penisula. Gorgeous cathedral ceilings, hardwood floors, quality furniture pieces, and exquisite finishes ensure a memorable experience the moment you step through the front door. This 4 bedroom 4 bathroom home that includes a bunkroom accommodates up to 10 guests. Prepare fresh seafood meals while taking in the coastal breeze in Adrien's fully stocked gourmet kitchen. After a long day at the beach wash off in the outdoor shower and head up to the private terrace with outdoor fireplace to watch the breathtaking Southern California sunsets night after night.
-
2025-05-09historical
-
2024-10-28price $589,999
-
2024-09-17price $594,000
-
2024-06-12price $599,000
-
2024-05-15$610,000 Active
-
2024-04-20historical
-
2023-12-05price $605,000
-
2023-10-19$628,271 Active
-
2023-07-31soldstatus $596,540 Closed Sale
-
2023-07-15$596,540 Active
-
2023-07-14soldstatus $596,540 Closed Sale
-
2023-06-20soldstatus $596,540 Closed Sale
-
2023-06-20$596,540 Active
-
2022-11-23status Active
-
2022-09-24status Active
-
2022-06-09$596,540 Active
-
2022-06-09historical
-
2022-04-05$596,540 Active
-
2022-04-04soldstatus $4,000,000 Closed
-
2022-04-04soldstatus $4,000,000 Closed Sale
-
2022-04-04soldstatus $4,000,000
-
2022-03-21status Pending Sale
-
2022-03-21historical Contingent - Continue to Show
-
2022-03-02$3,999,000 Active
-
2022-03-02$3,999,000 Active
-
2021-05-28soldstatus $2,700,000 Closed Sale
-
2021-05-01status Pending Sale
-
2021-04-23price $2,950,000
-
2021-04-09$3,200,000 Active
-
1976-05-26soldstatus $100,000
ⓘ Source: listings_history table (triggers on properties + properties_extension) + one-shot
backfill from property_details.listing_events for pre-trigger history.
Climate risk First Street
- Flood 3/10 Moderate FEMA zone X (shaded) · 18% chance over 30 yrs
- Wildfire 1/10 Low
- Heat 5/10 Major 7 d/yr ≥83°F today · 21 d/yr by 30 yrs out
- Wind 1/10 Low
- Air quality 4/10 Moderate 6 unhealthy d/yr today · 6 by 30 yrs out
Nearby sold comps map
Loading sold comps map…
Walkable amenities ~0.75 mi
Loading nearby amenities…
Taxation est. · year 1
- Rental income
- $117,814
- − Mortgage interest
- −$33,049
- − Property taxes
- −$8,850
- − Insurance
- −$2,950
- − Repairs & maintenance
- −$9,425
- − Management
- −$9,425
- − Depreciation
- −$17,164
- Taxable income
- $36,951
- Est. tax owed @ 24.0%
- −$8,868
- After-tax cash flow
- $35,277/yr
For passive investors: Depreciation is non-cash, so a rental often shows a tax loss while cash-flowing — sheltering income. Rental losses are passive: they offset passive income freely, and up to $25,000/yr can offset ordinary (W-2) income if you actively participate and your MAGI is under $100k (phasing out to $0 by $150k); unused losses carry forward. On sale, claimed depreciation is recaptured at up to 25%, and gains may owe capital-gains tax (a 1031 exchange can defer both). Figures are a year-1 estimate at your 24.0% rate — not tax advice; consult a CPA.
Schools (NCES district)
- District
- Newport-Mesa Unified
- NCES district ID
- 0627240
- Math proficiency
- 46% ▼ -6.00%
- Reading proficiency
- 58% ▼ -5.00%
- Median HH income
- $83,922
- Composite
- 47.64/100
- National rank
- #2248
- State rank
- #106 of 517 in CA
Livability — Newport Beach
- Score
- 76/100
- State rank
- #101
- US rank
- #3645
Category grades
Schools grade is shown separately in the Schools card above.
Census & demographics
- Census place
- Newport Beach, CA
- County
- Orange County · 3,096,323 people
- City population
- 83,845
- Metro
- Los Angeles-Long Beach-Anaheim, CA
- Population (ZIP)
- 3,079
- Household income
- $209,231
- Rent vs Own
- Severe rent burden
- 72.0
Population outlook (Orange County) Hauer SSP2
- Today (2025)
- 3,477,456 people
- By 2030
- 3,613,117 · +3.9%
- By 2040
- 3,835,945 · +10.3%
- By 2050
- 3,968,736 · +14.1%
- By 2075
- 4,097,053 · +17.8%
- By 2100
- 3,903,633 · +12.3%
Race, ethnicity, and origin ACS 2023
- Neighborhood character
- Predominantly White (72%)
- Race & ethnicity
- White 72% Two or more races 22% Hispanic / Latino 10% Asian 2%
- Hispanic origin (detail)
- Mexican 9% Puerto Rican 2%
- Common ancestry
- Italian 8% Danish 5% Slovak 4%
- Foreign-born
- 8% · Canada
- Languages at home
- 88% English-only · Spanish 9% German/W. Germanic 2% Other Asian/Pacific 1%
Political lean MEDSL · Orange
- 2024 margin
- Toss-up / Even · D 49.7% · R 47.1% · Other 3.2%
- 2008→2024 swing
- +5.2pp toward D · 2008: -2.6pp · 2024: 2.6pp
- All cycles
- 2024: D+2.6 2020: D+9.0 2016: D+7.7 2012: R+8.3 2008: R+2.6
Not yet ingested
- Civics
- —
Market trends
- HPI YoY
- ▲ 18.17%
- Current HPI
- 425.2623
- Rent YoY
- ▲ 13.56%
- Metro
- Los Angeles-Long Beach-Anaheim, CA
- State GDP YoY
- ▲ 3.21%
- F500 in state
- 116
Industry mix (Fortune 500 HQ in CA)
| Industry | F500 HQs | Revenue |
|---|---|---|
| Technology | 27 | $1,492B |
|
||
| Financial Services | 3 | $174B |
|
||
| Retail | 3 | $44B |
|
||
| Insurance | 3 | $26B |
|
||
| Media / Entertainment | 2 | $115B |
|
||
| Pharmaceuticals / Biotech | 2 | $62B |
|
||
Price history
+490.0% since first listed31 events — show timeline
- 2025-09-19 Listed $589,999 CRMLS
- 2025-05-09 Listing Removed — CRMLS
- 2024-10-28 Price Changed $589,999 CRMLS
- 2024-09-17 Price Changed $594,000 CRMLS
- 2024-06-12 Price Changed $599,000 CRMLS
- 2024-05-15 Listed $610,000 CRMLS
- 2024-04-20 Listing Removed — CRMLS
- 2023-12-05 Price Changed $605,000 CRMLS
- 2023-10-19 Listed $628,271 CRMLS
- 2023-07-31 Sold (MLS) $596,540 CRMLS
- 2023-07-15 Listed $596,540 CRMLS
- 2023-07-14 Sold (MLS) $596,540 CRMLS
- 2023-06-20 Listed $596,540 CRMLS
- 2023-06-20 Sold (MLS) $596,540 CRMLS
- 2022-11-23 Relisted — CRMLS
- 2022-09-24 Relisted — CRMLS
- 2022-06-09 Listing Removed — CRMLS
- 2022-06-09 Listed $596,540 CRMLS
- 2022-04-05 Listed $596,540 CRMLS
- 2022-04-04 Sold (Public Records) $4,000,000 Public Records
- 2022-04-04 Sold (MLS) $4,000,000 CRMLS
- 2022-04-04 Sold (MLS) $4,000,000 SBMLS
- 2022-03-21 Pending — CRMLS
- 2022-03-21 Contingent — SBMLS
- 2022-03-02 Listed $3,999,000 CRMLS
- 2022-03-02 Listed $3,999,000 SBMLS
- 2021-05-28 Sold (MLS) $2,700,000 CRMLS
- 2021-05-01 Pending — CRMLS
- 2021-04-23 Price Changed $2,950,000 CRMLS
- 2021-04-09 Listed $3,200,000 CRMLS
- 1976-05-26 Sold (Public Records) $100,000 Public Records
Property tax history
+19.3%/yrLatest (2025): $44,881 · +1.6% YoY. Source: county tax records.
Cash-flow waterfall
monthlySold comps — $/sqft
last 12 mo · ≤1 miLoading sold comps…