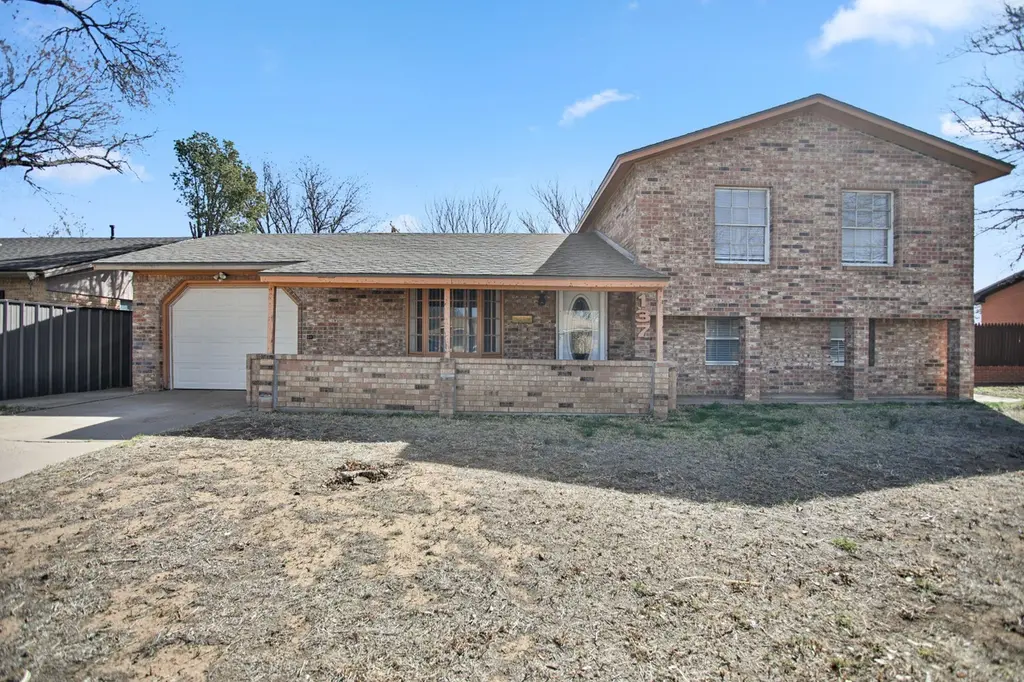
137 Detroit Ave · Levelland, TX
Flood risk 1/10 · Minimal
- FEMA flood zone
- X
- Chance of flooding over 30 yrs
- 0.0%
- Est. flood insurance / yr
- $507 – $1,088
Fire risk 4/10 · Minor
- Est. fire insurance / yr
- $1,222 – $2,270
Heat risk 5/10 · Moderate
- Hot days now (above 99°F)
- 7 days/yr
- Hot days in 30 yrs
- 22 days/yr
Wind risk 2/10 · Minimal
- Chance of severe wind over 30 yrs
- —
Air-quality risk 1/10 · Minimal
- Unhealthy air days now
- 0 days/yr
- Unhealthy air days in 30 yrs
- 0 days/yr
Risk factors via First Street. Map © Google.
Why this score? — see what drove the C grade
The composite is a weighted blend of 9 inputs, each scored 0–100. Each bar is that input's sub-score; the figure is the points it added to the 100-point composite (weight × sub-score).
- Cash flow +24.9/30.0
- DSCR +8.1/10.0
- 1% rule +7.6/10.0
- ARV discount +7.5/15.0
- Livability +3.6/5.0
- Schools +2.8/10.0
- Rent growth +2.5/5.0
- Condition / age +2.5/5.0
- Appreciation +0.0/10.0
$158,995
🖨 Deal sheet (PDF) 📄 Offer letter ✓ Due diligence
Listing remarks
Welcome to 137 Detroit Avenue -- a spacious and inviting two-story home nestled in the established Colonial Heights Addition in Levelland. Offering over 2,200 square feet, this 3-bedroom, 2-bath, 1-car garage home combines character, functionality, and room to grow, making it a fantastic opportunity for a wide range of buyers. Step inside to a bright and welcoming main living area filled with natural light, creating a warm and comfortable atmosphere. The updated kitchen is a standout feature, complete with granite countertops, beautiful wood cabinetry, and ample storage space, all flowing seamlessly into the dining area -- perfect for everyday living or hosting guests. Downstairs, you'll fi
Key facts
- Spacious backyard
- Updated kitchen
- Granite countertops
Tags
Property features AI
Exterior
- Parking: Attached 2-car garage; Concrete / paved driveway
- Utilities: Public water; Public sewer
- Home design: Single-family residence; 2 stories; Brick construction
- Construction: Composition roof; Slab foundation
- Exterior features: Private yard; Barbecue / outdoor grill; Storage
Interior
- Bathrooms: 2 full bathrooms
- Heating & cooling: Central heating (electric); Central air conditioning (electric); Ceiling fans
- Interior features: Ceiling fans; Open floor plan; Wood-burning fireplace in the living room; Finished basement
Neighborhood map
What this means for you Summary
Snapshot
- This is a 3-bed/2.0-bath single-family listed at $159k.
Deal economics
- At list price, monthly cash flow is $341 ($4k/yr) — positive.
- The deal already cash-flows at list — no discount required.
- Meets the 1% rule at list price ($2k rent vs $159k).
- Recommended offer: $157k (1.5% below list) — sets the bar for market timing.
Location & tenants
- Location reads 72/100 on livability (#274 in TX) — a middle-class / working-renter tenant base. Strengths: cost of living A+, housing A+, health & safety A+; Watch: commute F, employment F.
- Levelland ISD (town): math 33% / reading 32% proficiency, ranked #566 of 826 in TX (top 68%) — families likely to look elsewhere, expect single-tenant / working-renter base with shorter leases; 64% free/reduced lunch — lower-income household profile, screen leases tightly.
- Zoned schools: Levelland Middle (math 32% / reading 31%, grade F, #997 of 1,662 statewide, top 61%, 622 students, 79% FRL); Levelland H S (math 67% / reading 55%, grade C+, #258 of 1,632 statewide, top 16%, 745 students, 67% FRL).
- Zoned-school proficiency averages 46% at this address vs 32% district-wide (+14 pts) — the actual schools serving this property are materially stronger than the Levelland ISD average implies; a family-tenant draw the district grade alone would hide.
- Market conditions: 120 active listings in the ZIP; 1 comparable units currently listed for rent nearby; 7 units permitted in Hockley County in 2024 (0 in 5+ unit buildings).
Forward outlook
- Local home prices are declining (-3.0%/yr); year-one equity from $1k of loan paydown is wiped out by about $5k of value loss. Plan a longer hold.
- Hockley County population projected at +21% by 2050 — long-run rental-demand tailwind backs the buy-and-hold thesis.
Negotiation context
- It's been on market 26 days — a 2% lower offer ($157k) is reasonable based on typical stale-listing flexibility.
Risks & watch-outs
- Watch-outs: property tax is 2.6% of price.
- Climate carrying-cost: extreme-heat days projected 7→22/yr by 2055 (HVAC capex compounding) — expect insurance premiums to compound above CPI over the hold.
Questions for the listing agent
- Built in 1964 — when were the roof, HVAC, electrical panel, plumbing, and water heater last replaced?
- Property tax is high relative to price — has the assessment been appealed recently, and will the sale trigger a re-assessment?
- Is there a deadline driving the sale (1031 exchange, divorce, estate, relocation)? That informs how much negotiation room exists.
- Schools are F-rated, which usually means shorter tenancies and higher turnover. Who's the typical renter profile here, and what's been the actual vacancy rate?
- What's the average days-on-market for RENTAL listings here right now (not sales)? A rising rental-DOM trend means longer vacancies and softer asking-rent achievability than the comps imply.
- What's the recent tenant-quality profile in this submarket — average credit score on applications, eviction rate, late-payment / NSF rate, and stable-employment percentage? A property-management company in the area should have these aggregated.
- How much new for-sale + rental construction is in the pipeline within 1–3 miles? Heavy new supply typically softens prices + rents 12–24 months out; constrained supply supports both.
Investment metrics
- 1% rule
- 1.26% ✓
- Cap rate
- 8.87%
- Cash-on-cash
- 9.19%
- DSCR
- 1.41
- GRM
- 6.6
CMA / ARV
- ARV (median comp)
- $332,433
- List price
- $158,995
- Delta
- -52.17%
- Verdict
- UNDERPRICED
- Comps
- 1 within 2.0 mi
Projected returns pro-forma
-3.0% appreciation · 3.0% rent growth · sell at horizon
- IRR
- -2.3%
- Equity multiple
- 0.91×
- Total profit
- $-3,938
- Equity at exit
- $23,707
- IRR
- 7.4%
- Equity multiple
- 1.56×
- Total profit
- $24,998
- Equity at exit
- $13,747
Cash invested: $44,519 (down + closing). Projections, not guarantees.
Landlord ↔ Tenant lean methodology
- Overall (STATE)
- 87 Strongly Landlord-Friendly
- State Texas
- 87 Strongly Landlord-Friendly · R+5
- County
- — inherits STATE
- City
- — inherits STATE
ZIP-level market 79336
- Active inventory
- 120
- Price-to-rent
- 6.6×
Monthly cashflow live
- Estimated rent
- $2,000 medium interval (Pro) →
- Mortgage (P&I)
- −$834
- Tax from tax record
- −$339 /mo · $4,069/yr
- Insurance
- −$66
- HOA
- −$0
- Vacancy / Maint / Mgmt
- −$420
- Net cashflow
- $341
Break-even live
Sensitivity live
| Price | -10% $431 | -5% $386 | +0% $341 | +5% $296 | +10% $251 |
|---|---|---|---|---|---|
| Rent | -10% $183 | -5% $262 | +0% $341 | +5% $420 | +10% $499 |
| Rate | -1.0pp $421 | -0.5pp $381 | base $341 | +0.5pp $300 | +1.0pp $258 |
UW: 25.0% down · 7.5% · 30yr · 1.5% tax · 5.0% vac · 8.0% maint · 8.0% mgmt
Financing live
Cash to close
- Down payment
- $39,749
- Closing costs
- $4,770
- Reserves months
- —
- Total cash needed
- —
Loan-product check · same deal, 3 products live
Conventional
25% down · 7.5% · 30yr
- Down + closing
- —
- Monthly P&I
- —
- Monthly cashflow
- —
- DSCR
- —
- Eligible?
- —
Personal DTI + credit; lowest rate.
DSCR
20% down · 8.5% · 30yr
- Down + closing
- —
- Monthly P&I
- —
- Monthly cashflow
- —
- DSCR
- —
- Eligible?
- —
No personal income docs; deal must DSCR.
Hard money
10% down · 12.0% · 12mo
- Down + closing
- —
- Monthly P&I
- —
- Monthly cashflow
- —
- DSCR
- —
- Eligible?
- —
Short-term bridge; refi at stabilization.
Rent comps 1 comps
| Address | Beds | Baths | Sqft | Rent | $/sqft | DOM | Units | Dist |
|---|---|---|---|---|---|---|---|---|
| 305 Rayburn St Levelland, TX | 3.0 | 2.0 | 1875 | $2,000 | $1.07 | 15d | 1 | 1.48mi |
Listing history 18 events
-
2026-06-21days on market $158,995 Active 26 DOM
-
2026-06-21days on market $158,995 Active 25 DOM
-
2026-06-18days on market $158,995 Active 23 DOM
-
2026-06-17days on market $158,995 Active 22 DOM
-
2026-06-16days on market $158,995 Active 21 DOM
-
2026-06-15days on market $158,995 Active 20 DOM
-
2026-06-13days on market $158,995 Active 18 DOM
-
2026-06-12days on market $158,995 Active 17 DOM
-
2026-06-10days on market $158,995 Active 14 DOM
-
2026-06-08days on market $158,995 Active 13 DOM
-
2026-06-08days on market $158,995 Active 12 DOM
-
2026-06-07days on market $158,995 Active 11 DOM
-
2026-06-03days on market $158,995 Active 8 DOM
-
2026-06-02days on market $158,995 Active 7 DOM
-
2026-06-01days on market $158,995 Active 6 DOM
-
2026-05-31days on market $158,995 Active 5 DOM
-
2026-03-19$159,000 Active 1657-char remark
-
2023-10-06price $169,900
ⓘ Source: listings_history table (triggers on properties + properties_extension) + one-shot
backfill from property_details.listing_events for pre-trigger history.
Tax reassessment forecast TX · Resets to sale price
- Current annual tax
- $4,069 · $339/mo
- Projected year-2 tax
- $4,069 · $339/mo
- Expected delta
- $0/yr ($0/mo · 0.0%)
ⓘ Screening estimate from a state-policy table — verify with the county assessor before closing.
Climate risk First Street
- Flood 1/10 Low FEMA zone X · 0% chance over 30 yrs
- Wildfire 4/10 Moderate
- Heat 5/10 Major 7 d/yr ≥99°F today · 22 d/yr by 30 yrs out
- Wind 2/10 Low
- Air quality 1/10 Low 0 unhealthy d/yr today · 0 by 30 yrs out
Nearby sold comps map
Loading sold comps map…
Walkable amenities ~0.75 mi
Loading nearby amenities…
Taxation est. · year 1
- Rental income
- $24,000
- − Mortgage interest
- −$8,906
- − Property taxes
- −$4,069
- − Insurance
- −$795
- − Repairs & maintenance
- −$1,920
- − Management
- −$1,920
- − Depreciation
- −$4,625
- Taxable income
- $1,764
- Est. tax owed @ 24.0%
- −$423
- After-tax cash flow
- $3,667/yr
For passive investors: Depreciation is non-cash, so a rental often shows a tax loss while cash-flowing — sheltering income. Rental losses are passive: they offset passive income freely, and up to $25,000/yr can offset ordinary (W-2) income if you actively participate and your MAGI is under $100k (phasing out to $0 by $150k); unused losses carry forward. On sale, claimed depreciation is recaptured at up to 25%, and gains may owe capital-gains tax (a 1031 exchange can defer both). Figures are a year-1 estimate at your 24.0% rate — not tax advice; consult a CPA.
Schools (NCES district)
- District
- Levelland ISD
- NCES district ID
- 4827240
- Math proficiency
- 33% ▼ -9.00%
- Reading proficiency
- 32% ▼ -6.00%
- Median HH income
- $47,924
- Composite
- 28.09/100
- National rank
- #6833
- State rank
- #566 of 826 in TX
Livability — Levelland
- Score
- 72/100
- State rank
- #274
- US rank
- #6392
Category grades
Schools grade is shown separately in the Schools card above.
Census & demographics
- Census place
- Levelland, TX
- Population (ZIP)
- 15,265
Population outlook (Hockley County) Hauer SSP2
- Today (2025)
- 25,295 people
- By 2030
- 26,230 · +3.7%
- By 2040
- 28,268 · +11.8%
- By 2050
- 30,536 · +20.7%
- By 2075
- 36,867 · +45.7%
- By 2100
- 40,662 · +60.8%
Race, ethnicity, and origin ACS 2023
- Neighborhood character
- Majority Hispanic (53%)
- Race & ethnicity
- Hispanic / Latino 53% White 42% Two or more races 24% Black 3%
- Hispanic origin (detail)
- Mexican 48%
- Common ancestry
- Slovak 1% Lithuanian 1% Italian 1%
- Foreign-born
- 9% · Canada
- Languages at home
- 72% English-only · Spanish 27%
Political lean MEDSL · Hockley
- 2024 margin
- Solid R (+66.3) · D 16.6% · R 82.8%
- 2008→2024 swing
- -14.0pp toward R · 2008: -52.3pp · 2024: -66.3pp
- All cycles
- 2024: R+66.3 2020: R+62.4 2016: R+62.3 2012: R+57.0 2008: R+52.3
Not yet ingested
- Civics
- —
Market trends
- HPI YoY
- ▼ -169.34%
- Current HPI
- 154.0713
- Rent YoY
- —
- Metro
- —
- State GDP YoY
- ▲ 3.95%
- F500 in state
- 110
Industry mix (Fortune 500 HQ in TX)
| Industry | F500 HQs | Revenue |
|---|---|---|
| Energy | 16 | $1,198B |
|
||
| Technology | 5 | $198B |
|
||
| Engineering / Construction | 4 | $72B |
|
||
| Energy Services | 3 | $60B |
|
||
| Utilities | 3 | $41B |
|
||
| Healthcare | 2 | $330B |
|
||
Price history
-6.4% since first listed2 events — show timeline
- 2026-05-27 Listed $158,995 LARMLS
- 2023-10-06 Price Changed $169,900 LARMLS
Property tax history
+5.0%/yrLatest (2025): $4,069 · +9.2% YoY. Source: county tax records.
Cash-flow waterfall
monthlySold comps — $/sqft
last 12 mo · ≤1 miLoading sold comps…