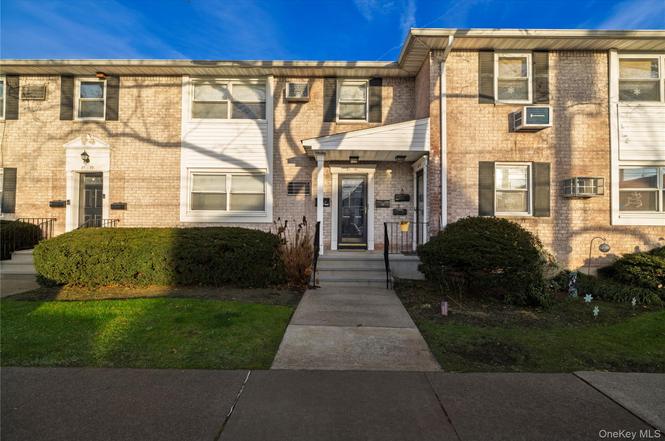
81-41 268 St Unit 293 B · New York, NY
Flood risk 1/10 · Minimal
- FEMA flood zone
- X (unshaded)
- Chance of flooding over 30 yrs
- 0.0%
- Est. flood insurance / yr
- $507 – $1,088
Fire risk 1/10 · Minimal
- Est. fire insurance / yr
- $691 – $1,283
Heat risk 6/10 · Moderate
- Hot days now (above 97°F)
- 7 days/yr
- Hot days in 30 yrs
- 16 days/yr
Wind risk 6/10 · Moderate
- Chance of severe wind over 30 yrs
- 27.0%
Air-quality risk 3/10 · Minor
- Unhealthy air days now
- 4 days/yr
- Unhealthy air days in 30 yrs
- 4 days/yr
Risk factors via First Street. Map © Google.
Why this score? — see what drove the D grade
The composite is a weighted blend of 9 inputs, each scored 0–100. Each bar is that input's sub-score; the figure is the points it added to the 100-point composite (weight × sub-score).
- Cash flow +12.0/30.0
- ARV discount +7.5/15.0
- Schools +5.0/10.0
- Livability +3.8/5.0
- Condition / age +3.8/5.0
- DSCR +3.6/10.0
- 1% rule +3.5/10.0
- Rent growth +2.5/5.0
- Appreciation +0.0/10.0
$305,000
🖨 Deal sheet (PDF) 📄 Offer letter ✓ Due diligence
Listing remarks
A beautiful, well maintained, spacious, upper unit with a private entrance in a great location-LANGDALE GARDENS! Kitchen has stainless steel appliances and a brand new floor. Bedroom has wall to wall closets! Updated bathroom. Spacious combination living room/dining room make this a perfect one bedroom unit. Bonus is the pull down stairs to large attic for lots of storage. A must see! Easy parking and pet friendly. Renting allowed after 2 years. The maintenance includes heat, water, gas, and property taxes. SD#26. Close to all transportation, local and express buses to NYC, highways, shopping and restaurants.
Key facts
- Easy parking
- Private entrance
- New floor
Tags
Neighborhood map
What this means for you Summary
Snapshot
- This is a 1-bed/1.0-bath condo listed at $305k. Condition is rated good.
Deal economics
- At list price, monthly cash flow is $-70 ($-838/yr) — negative.
- To cash-flow at today's rent, offer at most $295k (3.3% below list).
- To meet the 1% rule (rent ≥ 1% of price), the offer needs to be $258k (15.4% below list).
- Recommended offer: $258k (15.4% below list) — sets the bar for 1% rule.
- Cap rate 6.0% vs local median 2.6% in New York — top-decile yield for the area; either an underpriced asset or a hidden risk that comps aren't pricing in. Stress-test before assuming the spread holds.
Location & tenants
- Location reads 75/100 on livability (#268 in NY, #4,188 nationally) — a middle-class / working-renter tenant base. Strengths: amenities A+, commute A+, health & safety A; Watch: crime F, cost of living F.
- Zoned schools: Elm Tree Elementary School (math 27% / reading 52%, grade F, #1,444 of 2,108 statewide, top 71%, 806 students, 94% FRL); Is 227 Louis Armstrong (math 52% / reading 69%, grade B+, #153 of 729 statewide, top 21%, 1,528 students, 68% FRL); Midwood High School (math 94% / reading 96%, grade A+, #83 of 1,100 statewide, top 8%, 4,062 students, 73% FRL).
- Market conditions: 84 active listings in the ZIP; 12 comparable units currently listed for rent nearby; rentals leasing fast (median 0d on market — plan ~1-2 weeks tenant-placement turnaround); 5,302 units permitted in Queens County in 2024 (4,918 in 5+ unit buildings).
Forward outlook
- Local home prices are declining (-3.0%/yr); year-one equity from $2k of loan paydown is wiped out by about $9k of value loss. Plan a longer hold.
- Queens County population projected at +16% by 2050 — long-run rental-demand tailwind backs the buy-and-hold thesis.
Negotiation context
- It's been on market 82 days — a 6% lower offer ($287k) is reasonable based on typical stale-listing flexibility.
Risks & watch-outs
- Watch-outs: built in 1955 — expect roof / HVAC / electrical / plumbing capex.
- Climate carrying-cost: major wind risk, 27% chance of damaging wind over 30y; extreme-heat days projected 7→16/yr by 2055 (HVAC capex compounding) — expect insurance premiums to compound above CPI over the hold.
Questions for the listing agent
- What do current leases actually rent for vs. the listed asking? Can we see a recent rent roll and the last 12 months of T-12 income?
- It's been on market 82 days. Have you received any prior offers? Is the seller open to a 15% concession, seller financing, or rate buy-down credit?
- Built in 1955 — when were the roof, HVAC, electrical panel, plumbing, and water heater last replaced?
- Any open or pending special assessments — roof, HVAC, plumbing, elevator, façade? What's the per-unit balance and payoff schedule, and is the seller paying it off at close or rolling it to the buyer?
- Why hasn't it sold? Are there any deal-killer items the seller is aware of (foundation, flood, title, zoning, code violations)?
- Is there a deadline driving the sale (1031 exchange, divorce, estate, relocation)? That informs how much negotiation room exists.
- Schools are B-rated — typically a magnet for longer-tenancy family renters. What's the average tenant stay here, and is there a school-zone premium baked into asking?
- Crime grade is F in this area — have there been break-ins, vandalism, or insurance claims at this property in the last 3 years? What carrier currently insures it and at what premium?
- The area grade is low — what's the realistic commute time and amenity access for the typical tenant pool here? Any planned neighborhood developments (good or bad) we should know about?
- What's the average days-on-market for RENTAL listings here right now (not sales)? A rising rental-DOM trend means longer vacancies and softer asking-rent achievability than the comps imply.
- What's the recent tenant-quality profile in this submarket — average credit score on applications, eviction rate, late-payment / NSF rate, and stable-employment percentage? A property-management company in the area should have these aggregated.
- How much new apartment / multifamily construction is in the pipeline within 1–3 miles? Heavy new supply (>2% of stock underway) typically softens rents 12–24 months out; light construction supports rent growth.
Investment metrics
- 1% rule
- 0.85% ✗
- Cap rate
- 6.02%
- Cash-on-cash
- -0.98%
- DSCR
- 0.96
- GRM
- 9.9
CMA / ARV
No comps found within radius.
Projected returns pro-forma
-3.0% appreciation · 3.0% rent growth · sell at horizon
- IRR
- -17.9%
- Equity multiple
- 0.37×
- Total profit
- $-53,829
- Equity at exit
- $45,476
- IRR
- -10.0%
- Equity multiple
- 0.39×
- Total profit
- $-52,439
- Equity at exit
- $26,371
Cash invested: $85,400 (down + closing). Projections, not guarantees.
Landlord ↔ Tenant lean methodology
- Overall (CITY)
- 0 Strongly Tenant-Friendly
- State New York
- 15 Strongly Tenant-Friendly · D+10
- County
- — inherits STATE
- City New York
- 0 Strongly Tenant-Friendly · D+34
ZIP-level market 11004
- Active inventory
- 84
- Price-to-rent
- 9.9×
Monthly cashflow live
- Estimated rent
- $2,580 high interval (Pro) →
- Mortgage (P&I)
- −$1,599
- Tax est. 1.5%
- −$381 /mo · $4,575/yr
- Insurance
- −$127
- HOA
- −$0
- Vacancy / Maint / Mgmt
- −$542
- Net cashflow
- $-70
Break-even live
Sensitivity live
| Price | -10% $141 | -5% $36 | +0% $-70 | +5% $-175 | +10% $-281 |
|---|---|---|---|---|---|
| Rent | -10% $-274 | -5% $-172 | +0% $-70 | +5% $32 | +10% $134 |
| Rate | -1.0pp $84 | -0.5pp $8 | base $-70 | +0.5pp $-149 | +1.0pp $-229 |
UW: 25.0% down · 7.5% · 30yr · 1.5% tax · 5.0% vac · 8.0% maint · 8.0% mgmt
Financing live
Cash to close
- Down payment
- $76,250
- Closing costs
- $9,150
- Reserves months
- —
- Total cash needed
- —
Loan-product check · same deal, 3 products live
Conventional
25% down · 7.5% · 30yr
- Down + closing
- —
- Monthly P&I
- —
- Monthly cashflow
- —
- DSCR
- —
- Eligible?
- —
Personal DTI + credit; lowest rate.
DSCR
20% down · 8.5% · 30yr
- Down + closing
- —
- Monthly P&I
- —
- Monthly cashflow
- —
- DSCR
- —
- Eligible?
- —
No personal income docs; deal must DSCR.
Hard money
10% down · 12.0% · 12mo
- Down + closing
- —
- Monthly P&I
- —
- Monthly cashflow
- —
- DSCR
- —
- Eligible?
- —
Short-term bridge; refi at stabilization.
Rent comps 12 comps
| Address | Beds | Baths | Sqft | Rent | $/sqft | DOM | Units | Dist |
|---|---|---|---|---|---|---|---|---|
| 322 Jericho Tpke Floral Park, NY | 2.0 | 1.0 | 700 | $2,800 | $4.00 | 13d | 1 | 0.95mi |
| 318 Jericho Tpke Unit 1R Floral Park, NY | 1.0 | 1.0 | 500 | $1,900 | $3.80 | 18d | 1 | 0.95mi |
| 102 Jericho Tpke Unit 3C New Hyde Park, NY | 1.0 | 1.0 | 685 | $2,000 | $2.92 | 0d | 1 | 0.97mi |
| 260-51 73rd Ave Queens, NY | 1.0 | 1.0 | 518 | $2,200 | $4.25 | 6d | 1 | 0.98mi |
| 402 Jericho Tpke Unit 1 New Hyde Park, NY | 1.0 | 1.0 | 616 | $2,850 | $4.63 | 0d | 1 | 1.01mi |
| 36 Lakeville Rd New Hyde Park, NY | 2.0 | 1.0 | 650 | $3,500 | $5.38 | 0d | 1 | 1.02mi |
| 610 Jericho Tpke New Hyde Park, NY | 2.0 | 1.0 | 525 | $2,900 | $5.52 | 0d | 1 | 1.05mi |
| 77 S Tyson Ave Floral Park, NY | 1.0–2.0 | 1.0–2.0 | 807 | $3,095 | $3.83 | 0d | 1 | 1.18mi |
| 76-37 Commonwealth Blvd Unit 2 Jamaica, NY | 1.0 | 1.0 | 641 | $2,200 | $3.43 | 26d | 1 | 1.21mi |
| 145 Tulip Ave Floral Park, NY | 2.0 | 1.0 | 600 | $2,600 | $4.33 | 0d | 1 | 1.27mi |
| 248-15 89th Ave Unit 2nd Queens, NY | 1.0 | 1.0 | 700 | $2,200 | $3.14 | 2d | 1 | 1.38mi |
| 626 Stewart Ave New Hyde Park, NY | 1.0 | 1.0 | 700 | $2,600 | $3.71 | 0d | 1 | 1.42mi |
HOA detail condo
- Monthly dues
- $0 · $0/yr
- Likely covers
- watergas
- Assessments
- None detected in remarks — confirm with the listing agent.
Listing history 2 events
-
2026-03-03status Pending
-
2025-12-10$305,000 Active
ⓘ Source: listings_history table (triggers on properties + properties_extension) + one-shot
backfill from property_details.listing_events for pre-trigger history.
Climate risk First Street
- Flood 1/10 Low FEMA zone X (unshaded) · 0% chance over 30 yrs
- Wildfire 1/10 Low
- Heat 6/10 Major 7 d/yr ≥97°F today · 16 d/yr by 30 yrs out
- Wind 6/10 Major 27% chance of damaging wind over 30 yrs
- Air quality 3/10 Moderate 4 unhealthy d/yr today · 4 by 30 yrs out
Nearby sold comps map
Loading sold comps map…
Walkable amenities ~0.75 mi
Loading nearby amenities…
Taxation est. · year 1
- Rental income
- $30,957
- − Mortgage interest
- −$17,085
- − Property taxes
- −$4,575
- − Insurance
- −$1,525
- − Repairs & maintenance
- −$2,477
- − Management
- −$2,477
- − Depreciation
- −$8,873
- Taxable loss
- −$6,054
- Est. tax savings @ 24.0%
- +$1,453
- After-tax cash flow
- $615/yr
For passive investors: Depreciation is non-cash, so a rental often shows a tax loss while cash-flowing — sheltering income. Rental losses are passive: they offset passive income freely, and up to $25,000/yr can offset ordinary (W-2) income if you actively participate and your MAGI is under $100k (phasing out to $0 by $150k); unused losses carry forward. On sale, claimed depreciation is recaptured at up to 25%, and gains may owe capital-gains tax (a 1031 exchange can defer both). Figures are a year-1 estimate at your 24.0% rate — not tax advice; consult a CPA.
Condition & rehab AI · 13 photos
This well-maintained, updated townhouse in Langdale Gardens is in good condition with a good condition score of 75. It has stainless steel appliances, a modern kitchen, and a good exterior with well-maintained landscaping. The property is pet-friendly and has easy parking, making it a great investment opportunity.
Value-add opportunities
- Both Painting the exterior brick facade — Enhances curb appeal and can increase both resale and rental value
- Both Landscaping improvements — Enhances curb appeal and can increase both resale and rental value
Renovation cost estimate screening
Value-add ROI direction
- Both Painting the exterior brick facade — Enhances curb appeal and can increase both resale and rental value ↑
- Both Landscaping improvements — Enhances curb appeal and can increase both resale and rental value ↑
ⓘ Cost ranges are severity-bucket heuristics (US national rule-of-thumb). Get contractor quotes + a written scope before underwriting a rehab budget.
Schools (NCES district)
No district data.
Livability — New York
- Score
- 75/100
- State rank
- #268
- US rank
- #4188
Category grades
Schools grade is shown separately in the Schools card above.
Census & demographics
- Census place
- New York, NY
- City population
- 7,731,280
- Population (ZIP)
- 14,296
Population outlook (Queens County) Hauer SSP2
- Today (2025)
- 2,546,320 people
- By 2030
- 2,643,059 · +3.8%
- By 2040
- 2,815,563 · +10.6%
- By 2050
- 2,944,423 · +15.6%
- By 2075
- 3,123,338 · +22.7%
- By 2100
- 3,098,688 · +21.7%
Race, ethnicity, and origin ACS 2023
- Neighborhood character
- Diverse neighborhood (Simpson 0.65)
- Race & ethnicity
- Asian 52% White 27% Hispanic / Latino 10% Two or more races 6% Black 6%
- Hispanic origin (detail)
- Puerto Rican 4% Salvadoran 1%
- Common ancestry
- Romanian 2% Scotch-Irish 1% Danish 1%
- Foreign-born
- 47% · Canada, China, South Korea
- Languages at home
- 45% English-only · Other Indo-European 25% Other Asian/Pacific 10% Spanish 7%
Political lean MEDSL · Queens
- 2024 margin
- Strong D (+24.6) · D 62.3% · R 37.7%
- 2008→2024 swing
- -26.2pp toward R · 2008: 50.8pp · 2024: 24.6pp
- All cycles
- 2024: D+24.6 2020: D+45.2 2016: D+53.4 2012: D+58.5 2008: D+50.8
Not yet ingested
- Civics
- —
Market trends
- HPI YoY
- ▼ -218.37%
- Current HPI
- 162.6149
- Rent YoY
- —
- Metro
- —
- State GDP YoY
- ▲ 2.60%
- F500 in state
- 92
Industry mix (Fortune 500 HQ in NY)
| Industry | F500 HQs | Revenue |
|---|---|---|
| Financial Services | 10 | $950B |
|
||
| Consumer Goods | 9 | $162B |
|
||
| Insurance | 4 | $225B |
|
||
| Telecommunications | 2 | $144B |
|
||
| Pharmaceuticals | 2 | $112B |
|
||
| Media / Entertainment | 2 | $69B |
|
||
Price history
2 events — show timeline
- 2026-03-03 Pending — OneKey® MLS as Distributed by MLS Grid
- 2025-12-10 Listed $305,000 OneKey® MLS as Distributed by MLS Grid
Cash-flow waterfall
monthlySold comps — $/sqft
last 12 mo · ≤1 miLoading sold comps…