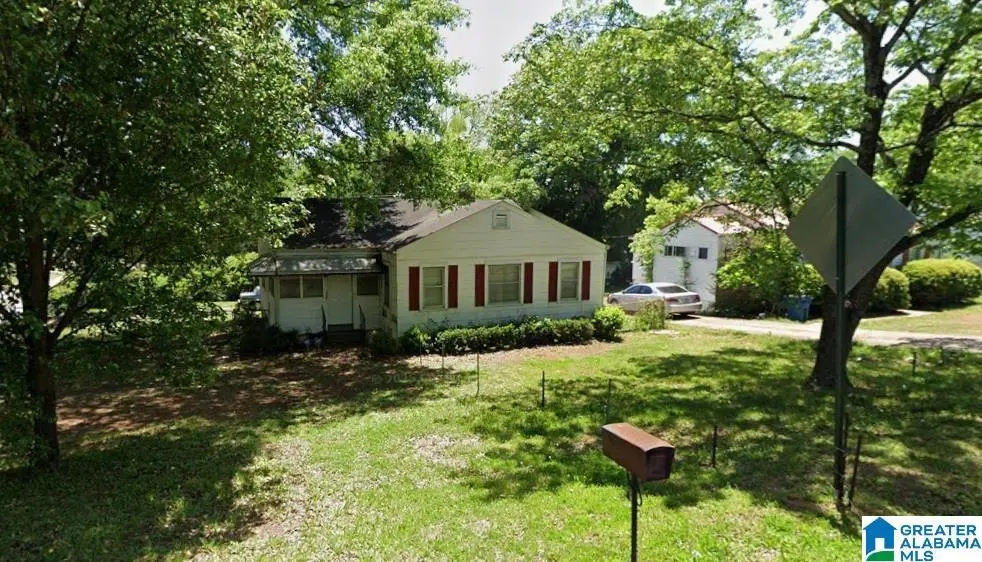
400 Woodward Rd · Midfield, AL
Flood risk 1/10 · Minimal
- FEMA flood zone
- X (unshaded)
- Chance of flooding over 30 yrs
- 0.0%
- Est. flood insurance / yr
- $473 – $860
Fire risk 1/10 · Minimal
- Est. fire insurance / yr
- $916 – $1,700
Heat risk 7/10 · Major
- Hot days now (above 108°F)
- 7 days/yr
- Hot days in 30 yrs
- 20 days/yr
Wind risk 6/10 · Moderate
- Chance of severe wind over 30 yrs
- 27.0%
Air-quality risk 4/10 · Minor
- Unhealthy air days now
- 5 days/yr
- Unhealthy air days in 30 yrs
- 5 days/yr
Risk factors via First Street. Map © Google.
Why this score? — see what drove the C grade
The composite is a weighted blend of 9 inputs, each scored 0–100. Each bar is that input's sub-score; the figure is the points it added to the 100-point composite (weight × sub-score).
- Cash flow +27.1/30.0
- DSCR +9.4/10.0
- 1% rule +7.2/10.0
- Livability +3.2/5.0
- ARV discount +2.8/15.0
- Appreciation +2.6/10.0
- Condition / age +2.5/5.0
- Rent growth +2.1/5.0
- Schools +0.7/10.0
$95,000
🖨 Deal sheet 📄 Offer letter ✓ Due diligence
Listing remarks MLS
WELCOME TO 400 WOODWARD ROAD!!! THIS PROPERTY IS TENANT OCCUPIED AND IS READY FOR A NEW OWNER. THE PROPERTY HAS 3-BEDROOMS, 1-FULL BATH, LIVING ROOM WITH A FIREPLACE, FENCED YARD, A DETACHED GARAGE AND CARPORT!!! IT SITUATED ON A CORNER LOT AND IN WALKING DISTANCE TO THE PARK. THIS PROPERTY IS PRICED TO SELL, SO SCHEDULE YOUR PRIVATE SHOWING TODAY!!!
Key facts
- 0.24 acre lot
- Garage
- Built 1948
Property features AI
Finance
- Other: Lot size approximately 0.24 acres; Subdivision: Belcher Homes
Exterior
- Parking: Rear garage entry; 1-car garage (main level) plus driveway parking
- Utilities: Public water; Connected sewer; Internet service available
- Home design: Existing single-family property; Basement foundation
- Construction: Siding (other) exterior construction
- Exterior features: Fenced yard; No pool, patio, decks, or garden/patio listed; Not waterfront
Interior
- Kitchen: Laminate countertops
- Bedrooms: Three bedrooms on the main level
- Flooring: Carpet
- Bathrooms: One full bathroom with tub/shower combo
- Heating & cooling: Gas heat; Central cooling
- Interior features: Carpet floors; Ceilings: other (see remarks); Wood-burning fireplace in the living room (brick surround); Pull-down attic; Partial, all-unfinished concrete block basement
- Laundry & utility: Laundry in the basement with washer hookup and electric dryer hookup; Electric water heater
Neighborhood map
What this means for you Summary
Snapshot
- This is a 3-bed/1.0-bath single-family listed at $95k.
Deal economics
- At list price, monthly cash flow is $268 ($3k/yr) — positive.
- The deal already cash-flows at list — no discount required.
- Meets the 1% rule at list price ($1k rent vs $95k).
- Recommended offer: $94k (1.5% below list) — sets the bar for market timing.
Location & tenants
- Location reads 64/100 on livability (#164 in AL) — a middle-class / working-renter tenant base. Strengths: commute A+, cost of living A+, housing A+; Watch: amenities F, employment F, health & safety F.
- Midfield City (suburban): math 2% / reading 14% proficiency, ranked #126 of 129 in AL (top 98%) — low school quality limits family demand, transient renter base, plan for 1-2y turnover; 83% free/reduced lunch — lower-income household profile, screen leases tightly.
- Zoned schools: Midfield Elementary School (math 2% / reading 17%, grade F, #568 of 627 statewide, top 94%, 390 students, 84% FRL); Midfield High School (math 2% / reading 2%, grade F, #291 of 305 statewide, top 100%, 340 students, 87% FRL) — zoned schools at 86% FRL track the district average.
- Market conditions: Rents soft (-1.5%/yr); 87 active listings in the ZIP; 40 comparable units currently listed for rent nearby; rentals at typical pace (median 24d on market — plan ~3-4 weeks tenant-placement turnaround); 45% of comp listings sitting > 30 days — soft ceiling on asking rent; 2,114 units permitted in Jefferson County in 2024 (556 in 5+ unit buildings).
Forward outlook
- Local home prices are declining (-3.0%/yr); year-one equity from $657 of loan paydown is wiped out by about $3k of value loss. Plan a longer hold.
- Jefferson County population projected to shrink 4% by 2050 — rents likely to lag national; underwrite the cash flow, not the appreciation.
Negotiation context
- It's been on market 20 days — a 2% lower offer ($94k) is reasonable based on typical stale-listing flexibility.
- 3 sale attempts since 15y ago with the ask held roughly flat each time — persistent listings suggest the price (not the market) is what's stuck; bring a comps-based counter.
Risks & watch-outs
- Watch-outs: built in 1948 — expect roof / HVAC / electrical / plumbing capex.
- Climate carrying-cost: major wind risk, 27% chance of damaging wind over 30y; extreme-heat days projected 7→20/yr by 2055 (HVAC capex compounding) — expect insurance premiums to compound above CPI over the hold.
Questions for the listing agent
- Built in 1948 — when were the roof, HVAC, electrical panel, plumbing, and water heater last replaced?
- Is there a deadline driving the sale (1031 exchange, divorce, estate, relocation)? That informs how much negotiation room exists.
- Schools are F-rated, which usually means shorter tenancies and higher turnover. Who's the typical renter profile here, and what's been the actual vacancy rate?
- What's the average days-on-market for RENTAL listings here right now (not sales)? A rising rental-DOM trend means longer vacancies and softer asking-rent achievability than the comps imply.
- What's the recent tenant-quality profile in this submarket — average credit score on applications, eviction rate, late-payment / NSF rate, and stable-employment percentage? A property-management company in the area should have these aggregated.
- How much new for-sale + rental construction is in the pipeline within 1–3 miles? Heavy new supply typically softens prices + rents 12–24 months out; constrained supply supports both.
Investment metrics
- 1% rule
- 1.22% ✓
- Cap rate
- 9.68%
- Cash-on-cash
- 12.09%
- DSCR
- 1.54
- GRM
- 6.8
CMA / ARV
- ARV (on-the-fly)
- $85,981
- Comps found
- 12
Show comp detail 12 sales within ~0.75 mi
| Address | Dist | Beds/Ba | Sqft | Sold | Price | $/sf | Match |
|---|---|---|---|---|---|---|---|
| 340 Woodward Rd | 0.03mi | 3/1.0 | 1,255 (+4%) | 12mo | $85,000 | $68 | 83 |
| 336 Birwood Ave | 0.13mi | 3/1.0 | 1,093 (-10%) | 10mo | $78,000 | $71 | 69 |
| 1808 Collier Dr | 0.26mi | 2/1.0 (-1) | 1,174 (-3%) | 11mo | $83,000 | $71 | 68 |
| 1412 Woodward Rd | 0.63mi | 3/1.0 | 1,220 (+1%) | 2mo | $65,000 | $53 | 68 |
| 521 Grant St | 0.18mi | 3/2.0 | 1,368 (+13%) | 9mo | $80,000 | $58 | 59 |
| 540 Lovett St | 0.24mi | 3/1.0 | 1,046 (-14%) | 10mo | $119,000 | $114 | 58 |
| 1356 Woodward Rd | 0.75mi | 3/1.0 | 1,164 (-4%) | 1mo | $98,000 | $84 | 58 |
| 927 Woodward Rd | 0.72mi | 3/1.5 | 1,148 (-5%) | 1mo | $40,000 | $35 | 55 |
| 923 Woodward Rd | 0.71mi | 3/1.0 | 1,273 (+5%) | 5mo | $65,000 | $51 | 55 |
| 5045 Juanita Cir | 0.69mi | 3/1.5 | 1,176 (-3%) | 11mo | $110,000 | $94 | 52 |
| 215 1st Ave | 0.68mi | 3/1.0 | 1,296 (+7%) | 11mo | $54,000 | $42 | 47 |
| 349 Midwood Ave | 0.75mi | 4/2.0 (+1) | 1,160 (-4%) | 12mo | $165,000 | $142 | 39 |
Match score weights: distance 35% · size 25% · config 20% · recency 20%. Top-matched comps best support the ARV.
Projected returns pro-forma
-3.0% appreciation · 0.0% rent growth · sell at horizon
- IRR
- -1.8%
- Equity multiple
- 0.94×
- Total profit
- $-1,709
- Equity at exit
- $14,165
- IRR
- 4.4%
- Equity multiple
- 1.28×
- Total profit
- $7,420
- Equity at exit
- $8,214
Cash invested: $26,600 (down + closing). Projections, not guarantees.
Landlord ↔ Tenant lean methodology
- Overall (STATE)
- 90 Strongly Landlord-Friendly
- State Alabama
- 90 Strongly Landlord-Friendly · R+15
- County
- — inherits STATE
- City
- — inherits STATE
ZIP-level market 35228
- Home prices YoY
- -3.5%
- Rents YoY
- -1.5%
- Active inventory
- 87
- Price-to-rent
- 6.8×
Monthly cashflow live
- Estimated rent
- $1,158 high interval (Pro) →
- Mortgage (P&I)
- −$498
- Tax from tax record
- −$109 /mo · $1,308/yr
- Insurance
- −$40
- HOA
- −$0
- Vacancy / Maint / Mgmt
- −$243
- Net cashflow
- $268
Break-even live
UW: 25.0% down · 7.5% · 30yr · 1.5% tax · 5.0% vac · 8.0% maint · 8.0% mgmt
Financing live
Cash to close
- Down payment
- $23,750
- Closing costs
- $2,850
- Reserves months
- —
- Total cash needed
- —
Loan-product check · same deal, 3 products live
Conventional
25% down · 7.5% · 30yr
- Down + closing
- —
- Monthly P&I
- —
- Monthly cashflow
- —
- DSCR
- —
- Eligible?
- —
Personal DTI + credit; lowest rate.
DSCR
20% down · 8.5% · 30yr
- Down + closing
- —
- Monthly P&I
- —
- Monthly cashflow
- —
- DSCR
- —
- Eligible?
- —
No personal income docs; deal must DSCR.
Hard money
10% down · 12.0% · 12mo
- Down + closing
- —
- Monthly P&I
- —
- Monthly cashflow
- —
- DSCR
- —
- Eligible?
- —
Short-term bridge; refi at stabilization.
Rent comps 40 comps
| Address | Beds | Baths | Sqft | Rent | $/sqft | DOM | Units | Dist |
|---|---|---|---|---|---|---|---|---|
| 517 Grant St Birmingham, AL | 3.0 | 1.0 | 912 | $850 | $0.93 | 23d | 1 | 0.16mi |
| 537 Grant St Birmingham, AL | 3.0 | 1.0 | 1444 | $1,200 | $0.83 | 23d | 1 | 0.22mi |
| 1721 Collier Dr Birmingham, AL | 2.0 | 1.0 | 925 | $800 | $0.86 | 43d | 1 | 0.27mi |
| 120 Parkwood St Birmingham, AL | 3.0 | 1.5 | 1224 | $1,150 | $0.94 | 15d | 1 | 0.31mi |
| 1433 Rayfield Dr Birmingham, AL | 3.0 | 1.0 | 1064 | $950 | $0.89 | 43d | 1 | 0.59mi |
| 1412 Woodward Rd Birmingham, AL | 3.0 | 1.0 | 1220 | $1,203 | $0.99 | 15d | 1 | 0.63mi |
| 923 Woodward Rd Birmingham, AL | 3.0 | 1.0 | 1273 | $1,200 | $0.94 | 23d | 1 | 0.71mi |
| 925 Woodward Rd Birmingham, AL | 2.0 | 2.0 | 1104 | $950 | $0.86 | 43d | 1 | 0.71mi |
| 1441 Creel St Birmingham, AL | 3.0 | 2.0 | 1319 | $1,275 | $0.97 | 3d | 1 | 0.72mi |
| 336 McPherson Ave Birmingham, AL | 3.0 | 1.0 | 1094 | $1,100 | $1.01 | 23d | 1 | 0.75mi |
| 1376 Creel Ct Birmingham, AL | 3.0 | 1.0 | 1008 | $1,000 | $0.99 | 43d | 1 | 0.76mi |
| 340 McPherson Ave Birmingham, AL | 2.0 | 1.0 | 924 | $910 | $0.98 | 43d | 1 | 0.76mi |
| 226 3rd Ave Birmingham, AL | 4.0 | 2.0 | 1248 | $1,300 | $1.04 | 43d | 1 | 0.78mi |
| 5624 Cairo Ave Birmingham, AL | 4.0 | 2.0 | 1386 | $1,200 | $0.87 | 43d | 1 | 0.79mi |
| 222 4th Ave Birmingham, AL | 3.0 | 1.0 | 1300 | $1,050 | $0.81 | 43d | 1 | 0.85mi |
| 408 Midway St Birmingham, AL | 3.0 | 1.0 | 1301 | $1,075 | $0.83 | 19d | 1 | 0.86mi |
| 373 Belcher Dr Birmingham, AL | 4.0 | 1.0 | 1255 | $1,100 | $0.88 | 43d | 1 | 0.88mi |
| 800 Fairfax Dr Fairfield, AL | 4.0 | 2.0 | 1200 | $1,650 | $1.38 | 1d | 1 | 0.89mi |
| 412 Fairfax Dr Unit 416-11 Fairfield, AL | 2.0 | 1.5 | 935 | $975 | $1.04 | 2d | 1 | 0.91mi |
| 412 Fairfax Dr Unit 424-10 Fairfield, AL | 3.0 | 1.5 | 1035 | $1,275 | $1.23 | 11d | 1 | 0.91mi |
| 412 Fairfax Dr Unit 444-12 Fairfield, AL | 2.0 | 1.0 | 888 | $910 | $1.02 | 10d | 1 | 0.91mi |
| 412 Fairfax Dr Unit 424-3 Fairfield, AL | 3.0 | 1.5 | 1035 | $1,200 | $1.16 | 10d | 1 | 0.91mi |
| 412 Fairfax Dr Unit 436-11 Fairfield, AL | 2.0 | 1.5 | 935 | $910 | $0.97 | 10d | 1 | 0.91mi |
| 412 Fairfax Dr Unit 436-10 Fairfield, AL | 2.0 | 1.0 | 888 | $890 | $1.00 | 10d | 1 | 0.91mi |
| 412 Fairfax Dr Unit 400-12 Fairfield, AL | 2.0 | 1.0 | 888 | $915 | $1.03 | 10d | 1 | 0.91mi |
| 412 Fairfax Dr Unit 400-1 Fairfield, AL | 2.0 | 1.5 | 935 | $1,175 | $1.26 | 2d | 1 | 0.91mi |
| 733 Glen Ridge Dr Fairfield, AL | 3.0 | 1.0 | 1225 | $1,378 | $1.12 | 1d | 1 | 0.99mi |
| 6629 Grasselli Rd Fairfield, AL | 4.0 | 1.0 | 1114 | $1,295 | $1.16 | 43d | 1 | 1.05mi |
| 1112 S Gale Dr Birmingham, AL | 3.0 | 1.5 | 1053 | $1,175 | $1.12 | 43d | 1 | 1.06mi |
| 36 Wilkes Cir Birmingham, AL | 2.0 | 1.0 | 762 | $875 | $1.15 | 43d | 1 | 1.20mi |
| 913 Daniel Cir Birmingham, AL | 4.0 | 2.0 | 1317 | $1,300 | $0.99 | 43d | 1 | 1.21mi |
| 4029 Walnut Ave SW Birmingham, AL | 2.0 | 1.0 | 1300 | $1,369 | $1.05 | 3d | 1 | 1.21mi |
| 502 64th St Fairfield, AL | 3.0 | 1.0 | 1250 | $695 | $0.56 | 43d | 1 | 1.21mi |
| 125 Jerry Coleman St Fairfield, AL | 2.0 | 1.0 | 715 | $725 | $1.01 | 43d | 1 | 1.22mi |
| 3736 Oak Ave SW Birmingham, AL | 3.0 | 2.0 | 984 | $1,050 | $1.07 | 23d | 1 | 1.22mi |
| 3729 Maple Ave SW Birmingham, AL | 3.0 | 2.0 | 1008 | $1,200 | $1.19 | 43d | 1 | 1.24mi |
| 63 Wilkes Cir Birmingham, AL | 4.0 | 1.0 | 1164 | $1,200 | $1.03 | 43d | 1 | 1.25mi |
| 63 Wilkes Cir Unit 1 Birmingham, AL | 4.0 | 1.0 | 1164 | $1,250 | $1.07 | 43d | 1 | 1.25mi |
| 3729 Pine Ave SW Birmingham, AL | 3.0 | 1.0 | 1067 | $1,100 | $1.03 | 21d | 1 | 1.27mi |
| 80 Wilkes Cir Birmingham, AL | 4.0 | 2.0 | 1078 | $1,200 | $1.11 | 14d | 1 | 1.28mi |
Listing history 15 events
-
2026-06-18days on market $95,000 Active 20 DOM
-
2026-06-17days on market $95,000 Active 19 DOM
-
2026-06-16days on market $95,000 Active 18 DOM
-
2026-06-15days on market $95,000 Active 17 DOM
-
2026-06-13days on market $95,000 Active 15 DOM
-
2026-06-13days on market $95,000 Active 14 DOM
-
2026-06-10days on market $95,000 Active 12 DOM
-
2026-06-09days on market $95,000 Active 11 DOM
-
2026-06-08days on market $95,000 Active 10 DOM
-
2026-06-07days on market $95,000 Active 9 DOM
-
2026-06-05days on market $95,000 Active 6 DOM
-
2026-06-03days on market $95,000 Active 5 DOM
-
2026-06-02days on market $95,000 Active 4 DOM
-
2026-06-01days on market $95,000 Active 3 DOM
-
2026-05-31days on market $95,000 Active 2 DOM
ⓘ Source: listings_history table (triggers on properties + properties_extension) + one-shot
backfill from property_details.listing_events for pre-trigger history.
Tax reassessment forecast AL · Resets to sale price
- Current annual tax
- $1,308 · $109/mo
- Projected year-2 tax
- $1,308 · $109/mo
- Expected delta
- $0/yr ($0/mo · 0.0%)
ⓘ Screening estimate from a state-policy table — verify with the county assessor before closing.
Climate risk First Street
- Flood 1/10 Low FEMA zone X (unshaded) · 0% chance over 30 yrs
- Wildfire 1/10 Low
- Heat 7/10 Severe 7 d/yr ≥108°F today · 20 d/yr by 30 yrs out
- Wind 6/10 Major 27% chance of damaging wind over 30 yrs
- Air quality 4/10 Moderate 5 unhealthy d/yr today · 5 by 30 yrs out
Nearby sold comps map
Loading sold comps map…
Walkable amenities ~0.75 mi
Loading nearby amenities…
Taxation est. · year 1
- Rental income
- $13,895
- − Mortgage interest
- −$5,321
- − Property taxes
- −$1,308
- − Insurance
- −$475
- − Repairs & maintenance
- −$1,112
- − Management
- −$1,112
- − Depreciation
- −$2,764
- Taxable income
- $1,803
- Est. tax owed @ 24.0%
- −$433
- After-tax cash flow
- $2,783/yr
For passive investors: Depreciation is non-cash, so a rental often shows a tax loss while cash-flowing — sheltering income. Rental losses are passive: they offset passive income freely, and up to $25,000/yr can offset ordinary (W-2) income if you actively participate and your MAGI is under $100k (phasing out to $0 by $150k); unused losses carry forward. On sale, claimed depreciation is recaptured at up to 25%, and gains may owe capital-gains tax (a 1031 exchange can defer both). Figures are a year-1 estimate at your 24.0% rate — not tax advice; consult a CPA.
Schools (NCES district)
- District
- Midfield City
- NCES district ID
- 0102350
- Math proficiency
- 2% ▼ -18.00%
- Reading proficiency
- 14% ▼ -5.00%
- Median HH income
- $39,267
- Composite
- 6.89/100
- National rank
- #9978
- State rank
- #126 of 129 in AL
Livability — Midfield
- Score
- 64/100
- State rank
- #164
- US rank
- #14536
Category grades
Schools grade is shown separately in the Schools card above.
Census & demographics
- Census place
- Midfield, AL
- County
- Jefferson County · 527,445 people
- City population
- 10,216
- Metro
- Birmingham-Hoover, AL
- Population (ZIP)
- 10,216
- Household income
- $50,815
- Rent vs Own
- Severe rent burden
- 456.0
Population outlook (Jefferson County) Hauer SSP2
- Today (2025)
- 669,185 people
- By 2030
- 669,694 · +0.1%
- By 2040
- 661,388 · -1.2%
- By 2050
- 643,086 · -3.9%
- By 2075
- 577,267 · -13.7%
- By 2100
- 474,758 · -29.1%
Race, ethnicity, and origin ACS 2023
- Neighborhood character
- Predominantly Black (89%)
- Race & ethnicity
- Black 89% Hispanic / Latino 5% Two or more races 5% White 5%
- Foreign-born
- 2% · Canada
- Languages at home
- 95% English-only · Spanish 5%
Political lean MEDSL · Jefferson
- 2024 margin
- D (+10.4) · D 54.6% · R 44.2% · Other 1.2%
- 2008→2024 swing
- +5.4pp toward D · 2008: 5.1pp · 2024: 10.4pp
- All cycles
- 2024: D+10.4 2020: D+13.2 2016: D+7.2 2012: D+6.0 2008: D+5.1
Not yet ingested
- Civics
- —
Market trends
- HPI YoY
- ▼ -4.84%
- Current HPI
- 134.8633
- Rent YoY
- ▼ -1.47%
- Metro
- Birmingham-Hoover, AL
- State GDP YoY
- ▲ 2.94%
- F500 in state
- 4
Industry mix (Fortune 500 HQ in AL)
| Industry | F500 HQs | Revenue |
|---|---|---|
| Financial Services | 1 | $8B |
|
||
| Healthcare | 1 | $5B |
|
||
Price history
+138.1% since first listed7 events — show timeline
- 2026-05-29 Listed $95,000 Greater Alabama MLS
- 2025-07-01 Sold (Public Records) $85,000 Public Records
- 2025-06-20 Sold (MLS) $85,000 Greater Alabama MLS
- 2025-05-16 Contingent — Greater Alabama MLS
- 2025-04-28 Listed $79,900 Greater Alabama MLS
- 2013-01-31 Sold (MLS) $25,000 Greater Alabama MLS
- 2011-02-11 Listed $39,900 Greater Alabama MLS
Property tax history
+2.7%/yrLatest (2025): $1,308 · +6.9% YoY. Source: county tax records.
Cash-flow waterfall
monthlySold comps — $/sqft
last 12 mo · ≤1 miLoading sold comps…