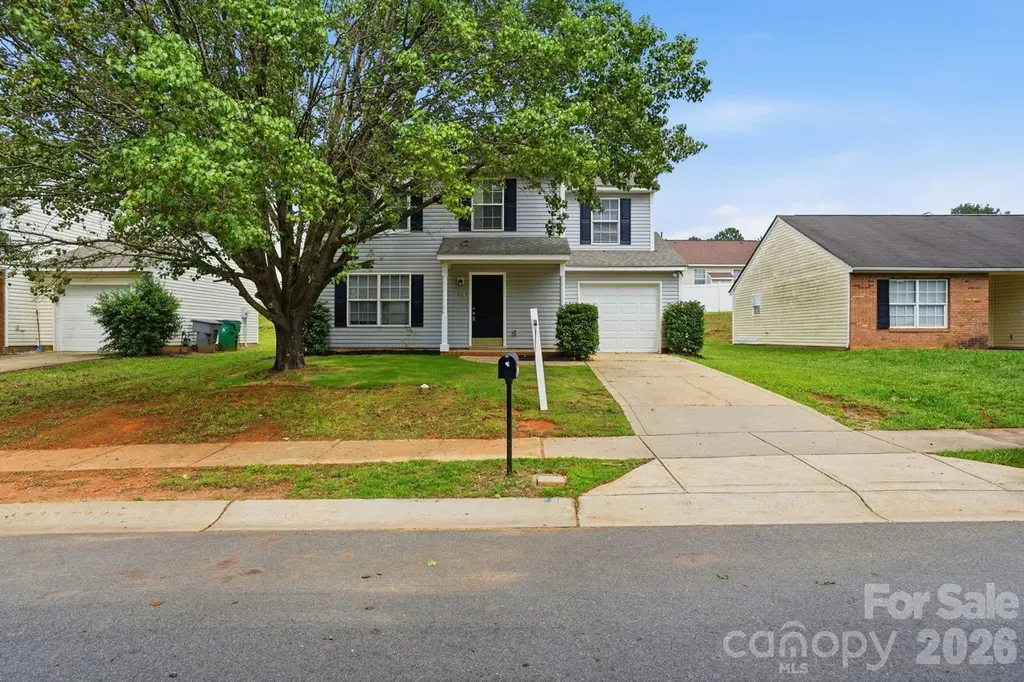
2314 Hope Valley Ln · Charlotte, NC
Flood risk 1/10 · Minimal
- FEMA flood zone
- X (unshaded)
- Chance of flooding over 30 yrs
- 0.0%
- Est. flood insurance / yr
- $507 – $1,088
Fire risk 1/10 · Minimal
- Est. fire insurance / yr
- $906 – $1,684
Heat risk 6/10 · Moderate
- Hot days now (above 104°F)
- 7 days/yr
- Hot days in 30 yrs
- 18 days/yr
Wind risk 5/10 · Moderate
- Chance of severe wind over 30 yrs
- 23.0%
Air-quality risk 4/10 · Minor
- Unhealthy air days now
- 4 days/yr
- Unhealthy air days in 30 yrs
- 5 days/yr
Risk factors via First Street. Map © Google.
Why this score? — see what drove the D+ grade
The composite is a weighted blend of 9 inputs, each scored 0–100. Each bar is that input's sub-score; the figure is the points it added to the 100-point composite (weight × sub-score).
- ARV discount +14.6/15.0
- Cash flow +12.7/30.0
- Livability +3.9/5.0
- DSCR +3.8/10.0
- Schools +3.8/10.0
- 1% rule +3.0/10.0
- Rent growth +2.7/5.0
- Condition / age +2.5/5.0
- Appreciation +0.0/10.0
$254,900
🖨 Deal sheet 📄 Offer letter ✓ Due diligence
Listing remarks
Discover the potential in this spacious home featuring 4 bedrooms, 2.5 bathrooms, and a functional layout designed for comfortable everyday living. The main living areas offer plenty of room for relaxing and entertaining, while the generously sized bedrooms provide flexibility for family, guests, a home office, or hobbies. The well-designed floor plan creates a comfortable flow throughout the home, making it easy to enjoy both everyday activities and special gatherings. Whether you're looking for your next home or an investment opportunity, this property offers plenty of space and potential to make it your own. One or more photo(s) has been virtually staged, AI generated, or rendered.
Key facts
- 4,791 sq ft lot
- Garage
- Built 1999
Property features AI
Finance
- Other: Zoning: N2-B
- HOA & community: No HOA
Exterior
- Parking: Attached garage (garage faces front); Driveway; One garage space; Main-level garage
- Utilities: Water: Other (see remarks); Sewer: Other (see remarks); Power: information not provided
- Home design: Single-family residence; Site-built construction; Two levels; Entry faces front
- Construction: Vinyl exterior; Slab foundation
- Exterior features: Concrete and paved road access; Publicly maintained road
Interior
- Kitchen: Includes dishwasher, electric range, microwave, refrigerator
- Bedrooms: Three bedrooms (all on the upper level)
- Bathrooms: Two full bathrooms (upper level); One half bathroom (main level)
- Interior features: Central heating; Central air; Dishwasher; Electric range; Microwave; Refrigerator
- Laundry & utility: Laundry room located inside the home
Neighborhood map
What this means for you Summary
Snapshot
- This is a 4-bed/2.5-bath single-family listed at $255k.
Deal economics
- At list price, monthly cash flow is $-28 ($-334/yr) — negative.
- To cash-flow at today's rent, offer at most $250k (1.9% below list).
- To meet the 1% rule (rent ≥ 1% of price), the offer needs to be $204k (20.1% below list).
- Recommended offer: $204k (20.1% below list) — sets the bar for 1% rule.
- Cap rate 6.2% vs local median 3.1% in Charlotte — top-decile yield for the area; either an underpriced asset or a hidden risk that comps aren't pricing in. Stress-test before assuming the spread holds.
Location & tenants
- Location reads 78/100 on livability (#26 in NC, #2,502 nationally) — a middle-class / working-renter tenant base. Strengths: amenities A+, commute A+, housing A+; Watch: crime F.
- Charlotte-Mecklenburg Schools (urban): math 42% / reading 46% proficiency, ranked #85 of 178 in NC (top 48%) — families likely to look elsewhere, expect single-tenant / working-renter base with shorter leases.
- Zoned schools: Newell Elementary (math 14% / reading 19%, grade F, #1,307 of 1,410 statewide, top 93%, 699 students, 100% FRL); Julius L. Chambers High School (math 40% / reading 35%, grade F, #411 of 535 statewide, top 77%, 2,224 students, 100% FRL) — zoned schools average 100% FRL vs 49% district-wide (51 pts higher); higher-poverty schools than district average — tighter screening recommended.
- Zoned-school proficiency averages 27% at this address vs 44% district-wide (-17 pts) — the specific schools serving this property underperform the Charlotte-Mecklenburg Schools average; the district grade overstates school quality for this exact location.
- Market conditions: Rents flat; 282 active listings in the ZIP; 39 comparable units currently listed for rent nearby; rentals leasing fast (median 8d on market — plan ~1-2 weeks tenant-placement turnaround); 11,969 units permitted in Mecklenburg County in 2024 (5,377 in 5+ unit buildings).
- This rent runs 42% of the median local income ($58k/yr) — at the standard rent-burdened threshold; future hikes will face affordability resistance.
Forward outlook
- Local home prices are declining (-3.0%/yr); year-one equity from $2k of loan paydown is wiped out by about $8k of value loss. Plan a longer hold.
- Mecklenburg County population projected at +53% by 2050 — long-run rental-demand tailwind backs the buy-and-hold thesis.
Negotiation context
- Only 7 days on market — expect competitive offers; lowballing is unlikely to land.
- Current owner paid $16k; list at $255k implies a 1493% gain — meaningful room to come down on a strong offer.
Risks & watch-outs
- Climate carrying-cost: moderate wind risk, 23% chance of damaging wind over 30y; extreme-heat days projected 7→18/yr by 2055 (HVAC capex compounding) — expect insurance premiums to compound above CPI over the hold.
Questions for the listing agent
- What do current leases actually rent for vs. the listed asking? Can we see a recent rent roll and the last 12 months of T-12 income?
- Is there a deadline driving the sale (1031 exchange, divorce, estate, relocation)? That informs how much negotiation room exists.
- Schools are D-rated, which usually means shorter tenancies and higher turnover. Who's the typical renter profile here, and what's been the actual vacancy rate?
- Crime grade is F in this area — have there been break-ins, vandalism, or insurance claims at this property in the last 3 years? What carrier currently insures it and at what premium?
- The area grade is low — what's the realistic commute time and amenity access for the typical tenant pool here? Any planned neighborhood developments (good or bad) we should know about?
- What's the average days-on-market for RENTAL listings here right now (not sales)? A rising rental-DOM trend means longer vacancies and softer asking-rent achievability than the comps imply.
- What's the recent tenant-quality profile in this submarket — average credit score on applications, eviction rate, late-payment / NSF rate, and stable-employment percentage? A property-management company in the area should have these aggregated.
- How much new for-sale + rental construction is in the pipeline within 1–3 miles? Heavy new supply typically softens prices + rents 12–24 months out; constrained supply supports both.
Investment metrics
- 1% rule
- 0.80% ✗
- Cap rate
- 6.16%
- Cash-on-cash
- -0.47%
- DSCR
- 0.98
- GRM
- 10.4
CMA / ARV
- ARV (on-the-fly)
- $302,624
- Comps found
- 7
Show comp detail 7 sales within ~0.75 mi
| Address | Dist | Beds/Ba | Sqft | Sold | Price | $/sf | Match |
|---|---|---|---|---|---|---|---|
| 303 Cupped Oak Ct | 0.08mi | 3/2.5 (-1) | 1,554 (+1%) | 12mo | $280,000 | $180 | 80 |
| 315 Kingville Dr | 0.06mi | 4/2.5 | 1,578 (+2%) | 18mo | $285,000 | $181 | 78 |
| 6739 Indian Ln | 0.43mi | 3/2.0 (-1) | 1,507 (-2%) | 1mo | $390,000 | $259 | 68 |
| 2303 Hope Valley Ln | 0.03mi | 3/2.5 (-1) | 1,376 (-11%) | 12mo | $280,000 | $203 | 65 |
| 612 Flowe Dr | 0.57mi | 4/2.0 | 1,336 (-14%) | 1mo | $285,000 | $213 | 48 |
| 326 Neal Dr | 0.56mi | 3/2.0 (-1) | 1,350 (-13%) | 3mo | $237,000 | $176 | 43 |
| 1451 Hidden Stream Ct | 0.67mi | 3/2.5 (-1) | 1,400 (-9%) | 20mo | $273,900 | $196 | 32 |
Match score weights: distance 35% · size 25% · config 20% · recency 20%. Top-matched comps best support the ARV.
Projected returns pro-forma
-3.0% appreciation · 0.63% rent growth · sell at horizon
- IRR
- -19.6%
- Equity multiple
- 0.33×
- Total profit
- $-47,871
- Equity at exit
- $38,006
- IRR
- -17.9%
- Equity multiple
- 0.12×
- Total profit
- $-62,728
- Equity at exit
- $22,039
Cash invested: $71,372 (down + closing). Projections, not guarantees.
Landlord ↔ Tenant lean methodology
- Overall (STATE)
- 85 Strongly Landlord-Friendly
- State North Carolina
- 85 Strongly Landlord-Friendly · R+3
- County
- — inherits STATE
- City
- — inherits STATE
ZIP-level market 28213
- Home prices YoY
- -24.9%
- Rents YoY
- 0.6%
- Active inventory
- 282
- Price-to-rent
- 10.4×
Monthly cashflow live
- Estimated rent
- $2,037 high interval (Pro) →
- Mortgage (P&I)
- −$1,337
- Tax from tax record
- −$194 /mo · $2,333/yr
- Insurance
- −$106
- HOA
- −$0
- Vacancy / Maint / Mgmt
- −$428
- Net cashflow
- $-28
Break-even live
UW: 25.0% down · 7.5% · 30yr · 1.5% tax · 5.0% vac · 8.0% maint · 8.0% mgmt
Financing live
Cash to close
- Down payment
- $63,725
- Closing costs
- $7,647
- Reserves months
- —
- Total cash needed
- —
Loan-product check · same deal, 3 products live
Conventional
25% down · 7.5% · 30yr
- Down + closing
- —
- Monthly P&I
- —
- Monthly cashflow
- —
- DSCR
- —
- Eligible?
- —
Personal DTI + credit; lowest rate.
DSCR
20% down · 8.5% · 30yr
- Down + closing
- —
- Monthly P&I
- —
- Monthly cashflow
- —
- DSCR
- —
- Eligible?
- —
No personal income docs; deal must DSCR.
Hard money
10% down · 12.0% · 12mo
- Down + closing
- —
- Monthly P&I
- —
- Monthly cashflow
- —
- DSCR
- —
- Eligible?
- —
Short-term bridge; refi at stabilization.
Rent comps 39 comps
| Address | Beds | Baths | Sqft | Rent | $/sqft | DOM | Units | Dist |
|---|---|---|---|---|---|---|---|---|
| 326 Kingville Dr Charlotte, NC | 3.0 | 2.5 | 1344 | $1,890 | $1.41 | 3d | 1 | 0.06mi |
| 340 Graham Meadow Dr Charlotte, NC | 3.0 | 2.0 | 1052 | $1,770 | $1.68 | 16d | 1 | 0.10mi |
| 6812 Malagant Ln Charlotte, NC | 3.0 | 2.0 | 1056 | $1,700 | $1.61 | 24d | 1 | 0.11mi |
| 2508 April Liu Ln Charlotte, NC | 1.0–3.0 | 1.0–2.5 | 1122 | $1,932 | $1.72 | 2d | 32 | 0.22mi |
| 8108 Grace Farms Dr Charlotte, NC | 1.0–3.0 | 1.0–2.0 | 1084 | $2,427 | $2.24 | 5d | 22 | 0.24mi |
| 419 Orchard Trace Ln #3 Charlotte, NC | 3.0 | 2.0 | 1056 | $1,450 | $1.37 | 16d | 1 | 0.27mi |
| 2003 Canterwood Dr Charlotte, NC | 1.0–3.0 | 1.0–2.0 | 990 | $2,308 | $2.33 | 2d | 12 | 0.34mi |
| 336 Blackhawk Rd Charlotte, NC | 1.0–3.0 | 1.0–2.5 | 997 | $2,315 | $2.32 | 2d | 16 | 0.44mi |
| 511 Derrydowne Dr Charlotte, NC | 3.0 | 1.5 | 1216 | $1,625 | $1.34 | 22d | 1 | 0.60mi |
| 6126 Amberly Ln Charlotte, NC | 3.0 | 2.0 | 1115 | $2,050 | $1.84 | 20d | 1 | 0.69mi |
| 6126 Amberly Ln Charlotte, NC | 3.0 | 2.0 | 1115 | $2,050 | $1.84 | 16d | 1 | 0.69mi |
| 626 Neal Dr Charlotte, NC | 4.0 | 2.0 | 2106 | $2,295 | $1.09 | 2d | 1 | 0.69mi |
| 5340 Periwinkle Hill Ave Charlotte, NC | 1.0–3.0 | 1.0–2.0 | 1033 | $2,186 | $2.12 | 2d | 41 | 0.71mi |
| 115 Spring Knoll Dr Charlotte, NC | 4.0 | 2.5 | 2013 | $2,499 | $1.24 | 8d | 1 | 0.73mi |
| 1300 Hunter Oaks Ln Charlotte, NC | 1.0–3.0 | 1.0–2.0 | 910 | $1,500 | $1.65 | 5d | 6 | 0.77mi |
| 1305 Hunter Oaks Ln Unit 115 Charlotte, NC | 3.0 | 2.0 | 1076 | $1,500 | $1.39 | 24d | 1 | 0.78mi |
| 5025 Wembley Central Ln Charlotte, NC | 1.0–3.0 | 1.0–2.0 | 1202 | $2,560 | $2.13 | 2d | 17 | 0.79mi |
| 7201 Canyon Dr Charlotte, NC | 3.0 | 2.0 | 1513 | $1,895 | $1.25 | 16d | 1 | 0.79mi |
| 1305 Hunter Oaks Ln Unit 1303-01 Charlotte, NC | 3.0 | 2.0 | 1076 | $1,500 | $1.39 | 5d | 1 | 0.81mi |
| 1144 Thayer Glen Ct Charlotte, NC | 4.0 | 2.5 | 1929 | $2,250 | $1.17 | 15d | 1 | 0.86mi |
| 7128 Amarillo Dr Charlotte, NC | 4.0 | 2.0 | 2232 | $2,275 | $1.02 | 24d | 1 | 0.88mi |
| 908 Bilmark Ave Charlotte, NC | 3.0 | 1.5 | 1150 | $1,625 | $1.41 | 24d | 1 | 0.88mi |
| 5401 Snow White Ln Charlotte, NC | 3.0 | 1.0 | 1264 | $1,670 | $1.32 | 4d | 1 | 0.97mi |
| 5200 Oxford Pond Dr Charlotte, NC | 1.0–3.0 | 1.0–2.5 | 1057 | $2,512 | $2.38 | 3d | 23 | 0.97mi |
| 815 Echo Glen Rd Charlotte, NC | 3.0 | 1.5 | 1125 | $1,495 | $1.33 | 15d | 1 | 1.09mi |
| 1841 Prospect Dr Charlotte, NC | 1.0–3.0 | 1.0–2.0 | 915 | $1,604 | $1.75 | 8d | 25 | 1.13mi |
| 1240 Merrick St Charlotte, NC | 2.0–4.0 | 2.0 | 1204 | $1,624 | $1.35 | 24d | 1 | 1.17mi |
| 413 Nathaniel Way Charlotte, NC | 3.0 | 3.5 | 1526 | $2,495 | $1.63 | 24d | 1 | 1.22mi |
| 308 Ferebee Pl Charlotte, NC | 3.0 | 3.5 | 1576 | $2,050 | $1.30 | 8d | 1 | 1.22mi |
| 308 Ferebee Pl Charlotte, NC | 3.0 | 3.5 | 1576 | $2,050 | $1.30 | 20d | 1 | 1.22mi |
| 2341 Jons Creek Ln Charlotte, NC | 3.0 | 2.5 | 1525 | $2,114 | $1.39 | 3d | 36 | 1.24mi |
| 305 Prine Pl Charlotte, NC | 3.0 | 1.0–2.0 | 1019 | $2,491 | $2.44 | 2d | 34 | 1.27mi |
| 6225 Branch Hill Cir Charlotte, NC | 3.0 | 2.0 | 1710 | $1,940 | $1.13 | 24d | 1 | 1.29mi |
| 7531 Double Springs Ct Charlotte, NC | 3.0 | 2.0 | 1417 | $1,850 | $1.31 | 18d | 1 | 1.30mi |
| 7352 Wingstone Ln Charlotte, NC | 3.0 | 2.0 | 1400 | $1,835 | $1.31 | 16d | 1 | 1.37mi |
| 614 Kentbrook Dr Charlotte, NC | 3.0 | 1.5 | 1104 | $1,600 | $1.45 | 5d | 1 | 1.39mi |
| 411 Lambeth Dr Charlotte, NC | 1.0–3.0 | 1.0–1.5 | 826 | $1,675 | $2.03 | 14d | 1 | 1.44mi |
| 2019 Aberdale Farm Ln Charlotte, NC | 2.0–4.0 | 2.0 | 1119 | $1,650 | $1.47 | 5d | 1 | 1.45mi |
| 1018 Catalyst Blvd Charlotte, NC | 2.0–3.0 | 2.5–3.5 | 1433 | $3,134 | $2.19 | 2d | 14 | 1.50mi |
Listing history 6 events
-
2026-06-13statusdays on market $254,900 Pending 7 DOM
-
2026-06-09days on market $254,900 Active 6 DOM
-
2026-06-08days on market $254,900 Active 5 DOM
-
2026-06-07days on market $254,900 Active 4 DOM
-
2026-06-04remarks 693-char remark
-
2026-06-04$254,900 Active 1 DOM
ⓘ Source: listings_history table (triggers on properties + properties_extension) + one-shot
backfill from property_details.listing_events for pre-trigger history.
Tax reassessment forecast NC · Resets to sale price
- Current annual tax
- $2,333 · $194/mo
- Projected year-2 tax
- $2,333 · $194/mo
- Expected delta
- $0/yr ($0/mo · 0.0%)
ⓘ Screening estimate from a state-policy table — verify with the county assessor before closing.
Climate risk First Street
- Flood 1/10 Low FEMA zone X (unshaded) · 0% chance over 30 yrs
- Wildfire 1/10 Low
- Heat 6/10 Major 7 d/yr ≥104°F today · 18 d/yr by 30 yrs out
- Wind 5/10 Major 23% chance of damaging wind over 30 yrs
- Air quality 4/10 Moderate 4 unhealthy d/yr today · 5 by 30 yrs out
Nearby sold comps map
Loading sold comps map…
Walkable amenities ~0.75 mi
Loading nearby amenities…
Taxation est. · year 1
- Rental income
- $24,448
- − Mortgage interest
- −$14,278
- − Property taxes
- −$2,333
- − Insurance
- −$1,274
- − Repairs & maintenance
- −$1,956
- − Management
- −$1,956
- − Depreciation
- −$7,415
- Taxable loss
- −$4,765
- Est. tax savings @ 24.0%
- +$1,144
- After-tax cash flow
- $809/yr
For passive investors: Depreciation is non-cash, so a rental often shows a tax loss while cash-flowing — sheltering income. Rental losses are passive: they offset passive income freely, and up to $25,000/yr can offset ordinary (W-2) income if you actively participate and your MAGI is under $100k (phasing out to $0 by $150k); unused losses carry forward. On sale, claimed depreciation is recaptured at up to 25%, and gains may owe capital-gains tax (a 1031 exchange can defer both). Figures are a year-1 estimate at your 24.0% rate — not tax advice; consult a CPA.
Schools (NCES district)
- District
- Charlotte-Mecklenburg Schools
- NCES district ID
- 3702970
- Math proficiency
- 42% ▼ -6.00%
- Reading proficiency
- 46% ▲ 1.00%
- Median HH income
- $57,175
- Composite
- 38.49/100
- National rank
- #4183
- State rank
- #85 of 178 in NC
Livability — Charlotte
- Score
- 78/100
- State rank
- #26
- US rank
- #2502
Category grades
Schools grade is shown separately in the Schools card above.
Census & demographics
- Census place
- Charlotte, NC
- County
- Mecklenburg County · 1,167,319 people
- City population
- 920,422
- Metro
- Charlotte-Concord-Gastonia, NC-SC
- Population (ZIP)
- 45,904
- Household income
- $58,146
- Rent vs Own
- Severe rent burden
- 3547.0
Population outlook (Mecklenburg County) Hauer SSP2
- Today (2025)
- 1,305,740 people
- By 2030
- 1,442,752 · +10.5%
- By 2040
- 1,722,441 · +31.9%
- By 2050
- 1,999,450 · +53.1%
- By 2075
- 2,642,495 · +102.4%
- By 2100
- 3,106,755 · +137.9%
Race, ethnicity, and origin ACS 2023
- Neighborhood character
- Diverse neighborhood (Simpson 0.66)
- Race & ethnicity
- Black 48% Hispanic / Latino 27% White 18% Two or more races 9% Asian 4%
- Hispanic origin (detail)
- Mexican 13% Puerto Rican 1% Dominican 2%
- Common ancestry
- Romanian 1% Lithuanian 1% Italian 1%
- Foreign-born
- 22% · Canada, Vietnam, China
- Languages at home
- 70% English-only · Spanish 23% Other Indo-European 1% Arabic 1%
Political lean MEDSL · Mecklenburg
- 2024 margin
- Solid D (+32.9) · D 65.6% · R 32.7% · Other 1.6%
- 2008→2024 swing
- +8.5pp toward D · 2008: 24.4pp · 2024: 32.9pp
- All cycles
- 2024: D+32.9 2020: D+35.1 2016: D+29.9 2012: D+22.5 2008: D+24.4
Not yet ingested
- Civics
- —
Market trends
- HPI YoY
- ▼ -88.12%
- Current HPI
- 265.9966
- Rent YoY
- ▲ 0.63%
- Metro
- Charlotte-Concord-Gastonia, NC-SC
- State GDP YoY
- ▲ 3.28%
- F500 in state
- 26
Industry mix (Fortune 500 HQ in NC)
| Industry | F500 HQs | Revenue |
|---|---|---|
| Financial Services | 2 | $213B |
|
||
| Retail | 2 | $95B |
|
||
| Industrial Conglomerate | 1 | $38B |
|
||
| Metals / Steel | 1 | $35B |
|
||
| Utilities | 1 | $30B |
|
||
| Industrial Machinery | 1 | $19B |
|
||
Price history
+116.0% since first listed3 events — show timeline
- 2026-06-03 Listed $254,900 CANOPYMLS as Distributed by MLS Grid
- 2021-05-21 Sold (Public Records) $16,000 Public Records
- 2000-03-29 Sold (Public Records) $118,000 Public Records
Property tax history
+8.2%/yrLatest (2025): $2,333 · +2.1% YoY. Source: county tax records.
Cash-flow waterfall
monthlySold comps — $/sqft
last 12 mo · ≤1 miLoading sold comps…