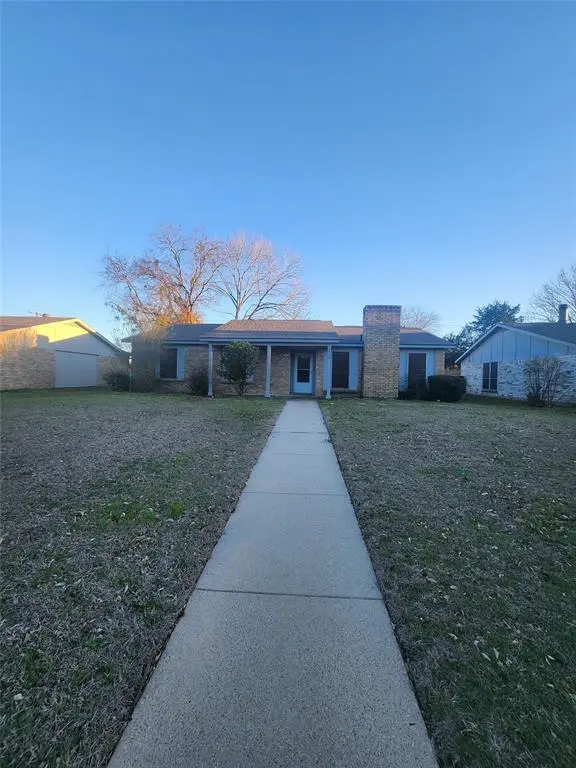
1310 Oakbluff Dr · Lancaster, TX
Flood risk 1/10 · Minimal
- FEMA flood zone
- X (unshaded)
- Chance of flooding over 30 yrs
- 0.0%
- Est. flood insurance / yr
- $507 – $1,088
Fire risk 4/10 · Minor
- Est. fire insurance / yr
- $1,222 – $2,270
Heat risk 8/10 · Major
- Hot days now (above 110°F)
- 7 days/yr
- Hot days in 30 yrs
- 25 days/yr
Wind risk 6/10 · Moderate
- Chance of severe wind over 30 yrs
- 27.0%
Air-quality risk 2/10 · Minimal
- Unhealthy air days now
- 2 days/yr
- Unhealthy air days in 30 yrs
- 2 days/yr
Risk factors via First Street. Map © Google.
Why this score? — see what drove the D+ grade
The composite is a weighted blend of 9 inputs, each scored 0–100. Each bar is that input's sub-score; the figure is the points it added to the 100-point composite (weight × sub-score).
- Cash flow +13.4/30.0
- ARV discount +9.7/15.0
- Appreciation +6.8/10.0
- 1% rule +4.1/10.0
- DSCR +4.0/10.0
- Rent growth +3.2/5.0
- Livability +3.1/5.0
- Condition / age +2.5/5.0
- Schools +2.1/10.0
$239,900
🖨 Deal sheet 📄 Offer letter ✓ Due diligence
Listing remarks MLS
Welcome to your new home! This charming 3-bedroom, 2-bathroom home with a 1-car garage is nestled in an established neighborhood and offers the perfect balance of comfort and convenience. Located close to shopping, dining, schools, and major highways, you’ll enjoy being just minutes from everything you need. Inside, the home features a freshly painted interior, updated fixtures, and a clean, inviting atmosphere that creates a warm, homey feel. The open layout makes it perfect for family living and entertaining. Step outside to a fenced backyard that’s ideal for kids, pets, and outdoor gatherings. The property also includes an alleyway with rear parking for added convenience. This is a great family home and is available for immediate move-in. ?? Don’t miss your chance—schedule a showing today!
Key facts
- Rear parking
- Open layout
- Fenced backyard
Tags
Neighborhood map
What this means for you Summary
Snapshot
- This is a 3-bed/2.0-bath single-family listed at $240k.
Deal economics
- At list price, monthly cash flow is $3 ($32/yr) — positive.
- The deal already cash-flows at list — no discount required.
- To meet the 1% rule (rent ≥ 1% of price), the offer needs to be $219k (8.7% below list).
- Recommended offer: $211k (12.0% below list) — sets the bar for market timing.
- Cap rate 6.3% vs local median 4.8% in Lancaster — top-decile yield for the area; either an underpriced asset or a hidden risk that comps aren't pricing in. Stress-test before assuming the spread holds.
Location & tenants
- Location reads 62/100 on livability (#926 in TX) — a middle-class / working-renter tenant base. Strengths: cost of living A+, housing A+; Watch: employment C-, schools D, crime F.
- Lancaster ISD (suburban): math 19% / reading 29% proficiency, ranked #714 of 826 in TX (top 86%) — low school quality limits family demand, transient renter base, plan for 1-2y turnover; 78% free/reduced lunch — lower-income household profile, screen leases tightly.
- Market conditions: Rents rising (+3.0%/yr); 103 active listings in the ZIP; 24 comparable units currently listed for rent nearby; rentals at typical pace (median 22d on market — plan ~3-4 weeks tenant-placement turnaround); 12,577 units permitted in Dallas County in 2024 (6,829 in 5+ unit buildings).
- This rent runs 39% of the median local income ($68k/yr) — at the standard rent-burdened threshold; future hikes will face affordability resistance.
Forward outlook
- In year one you build about $10k of equity ($2k loan paydown + $9k appreciation (3.6% local appreciation)).
- Dallas County population projected at +35% by 2050 — long-run rental-demand tailwind backs the buy-and-hold thesis.
- At projected returns (3.6% appreciation + 3.0% rent growth), your $67k cash investment doubles in ~6 years — after that, you're playing with house money.
- By year 4, paydown + projected appreciation supports a ~$35k cash-out refi (75% LTV) — recoverable capital for the next deal without selling this one.
Negotiation context
- It's been on market 290 days — a 12% lower offer ($211k) is reasonable based on typical stale-listing flexibility.
- 5 sale attempts since 24y ago with the ask held roughly flat each time — persistent listings suggest the price (not the market) is what's stuck; bring a comps-based counter.
- Current owner paid $61k; list at $240k implies a 296% gain — meaningful room to come down on a strong offer.
Risks & watch-outs
- Climate carrying-cost: major wind risk, 27% chance of damaging wind over 30y; extreme-heat days projected 7→25/yr by 2055 (HVAC capex compounding) — expect insurance premiums to compound above CPI over the hold.
Questions for the listing agent
- It's been on market 290 days. Have you received any prior offers? Is the seller open to a 12% concession, seller financing, or rate buy-down credit?
- Built in 1978 — when were the roof, HVAC, electrical panel, plumbing, and water heater last replaced?
- Why hasn't it sold? Are there any deal-killer items the seller is aware of (foundation, flood, title, zoning, code violations)?
- Is there a deadline driving the sale (1031 exchange, divorce, estate, relocation)? That informs how much negotiation room exists.
- Schools are D-rated, which usually means shorter tenancies and higher turnover. Who's the typical renter profile here, and what's been the actual vacancy rate?
- Crime grade is F in this area — have there been break-ins, vandalism, or insurance claims at this property in the last 3 years? What carrier currently insures it and at what premium?
- The area grade is low — what's the realistic commute time and amenity access for the typical tenant pool here? Any planned neighborhood developments (good or bad) we should know about?
- What's the average days-on-market for RENTAL listings here right now (not sales)? A rising rental-DOM trend means longer vacancies and softer asking-rent achievability than the comps imply.
- What's the recent tenant-quality profile in this submarket — average credit score on applications, eviction rate, late-payment / NSF rate, and stable-employment percentage? A property-management company in the area should have these aggregated.
- How much new for-sale + rental construction is in the pipeline within 1–3 miles? Heavy new supply typically softens prices + rents 12–24 months out; constrained supply supports both.
Investment metrics
- 1% rule
- 0.91% ✗
- Cap rate
- 6.31%
- Cash-on-cash
- 0.05%
- DSCR
- 1.00
- GRM
- 9.1
CMA / ARV
- ARV (median comp)
- $252,140
- List price
- $239,900
- Delta
- -4.85%
- Verdict
- FAIR
- Comps
- 20 within 1.0 mi
Show comp detail 9 sales within ~0.75 mi
| Address | Dist | Beds/Ba | Sqft | Sold | Price | $/sf | Match |
|---|---|---|---|---|---|---|---|
| 1301 Oakbluff Dr | 0.04mi | 3/2.0 | 1,289 (0%) | 24mo | $262,500 | $204 | 78 |
| 1310 Rosewood Ln | 0.17mi | 3/2.0 | 1,402 (+9%) | 4mo | $279,900 | $200 | 74 |
| 1009 Meadow Creek Dr | 0.35mi | 3/2.0 | 1,348 (+5%) | 9mo | $259,900 | $193 | 68 |
| 1318 Meadow Creek Dr | 0.30mi | 3/2.0 | 1,384 (+7%) | 12mo | $289,000 | $209 | 64 |
| 1133 Rosewood Ln | 0.31mi | 3/2.0 | 1,402 (+9%) | 11mo | $274,900 | $196 | 62 |
| 1109 Greenbriar Ln | 0.31mi | 3/2.0 | 1,412 (+10%) | 12mo | $236,000 | $167 | 59 |
| 510 Monarch Dr | 0.49mi | 3/2.0 | 1,240 (-4%) | 14mo | $241,900 | $195 | 59 |
| 517 Monarch Dr | 0.51mi | 3/2.0 | 1,240 (-4%) | 13mo | $225,000 | $181 | 59 |
| 871 Magnolia Ln | 0.74mi | 3/2.0 | 1,447 (+12%) | 5mo | $235,000 | $162 | 41 |
Match score weights: distance 35% · size 25% · config 20% · recency 20%. Top-matched comps best support the ARV.
Projected returns pro-forma
3.57% appreciation · 2.96% rent growth · sell at horizon
- IRR
- 9.2%
- Equity multiple
- 1.54×
- Total profit
- $36,431
- Equity at exit
- $115,717
- IRR
- 11.3%
- Equity multiple
- 2.79×
- Total profit
- $120,557
- Equity at exit
- $184,690
Cash invested: $67,172 (down + closing). Projections, not guarantees.
Landlord ↔ Tenant lean methodology
- Overall (STATE)
- 87 Strongly Landlord-Friendly
- State Texas
- 87 Strongly Landlord-Friendly · R+5
- County
- — inherits STATE
- City
- — inherits STATE
ZIP-level market 75146
- Home prices YoY
- 1.1%
- Rents YoY
- 3.0%
- Active inventory
- 103
- Price-to-rent
- 9.1×
Monthly cashflow live
- Estimated rent
- $2,190 high interval (Pro) →
- Mortgage (P&I)
- −$1,258
- Tax from tax record
- −$369 /mo · $4,433/yr
- Insurance
- −$100
- HOA
- −$0
- Vacancy / Maint / Mgmt
- −$460
- Net cashflow
- $3
Break-even live
UW: 25.0% down · 7.5% · 30yr · 1.5% tax · 5.0% vac · 8.0% maint · 8.0% mgmt
Financing live
Cash to close
- Down payment
- $59,975
- Closing costs
- $7,197
- Reserves months
- —
- Total cash needed
- —
Loan-product check · same deal, 3 products live
Conventional
25% down · 7.5% · 30yr
- Down + closing
- —
- Monthly P&I
- —
- Monthly cashflow
- —
- DSCR
- —
- Eligible?
- —
Personal DTI + credit; lowest rate.
DSCR
20% down · 8.5% · 30yr
- Down + closing
- —
- Monthly P&I
- —
- Monthly cashflow
- —
- DSCR
- —
- Eligible?
- —
No personal income docs; deal must DSCR.
Hard money
10% down · 12.0% · 12mo
- Down + closing
- —
- Monthly P&I
- —
- Monthly cashflow
- —
- DSCR
- —
- Eligible?
- —
Short-term bridge; refi at stabilization.
Rent comps 24 comps
| Address | Beds | Baths | Sqft | Rent | $/sqft | DOM | Units | Dist |
|---|---|---|---|---|---|---|---|---|
| 1225 Oakbluff Dr Lancaster, TX | 3.0 | 2.0 | 1335 | $1,895 | $1.42 | 4d | 1 | 0.12mi |
| 1373 Oakbluff Dr Lancaster, TX | 3.0 | 2.0 | 1289 | $1,850 | $1.44 | 3d | 1 | 0.19mi |
| 1308 Devine Dr Lancaster, TX | 4.0 | 2.0 | 1568 | $2,350 | $1.50 | 44d | 1 | 0.29mi |
| 1125 Greenbriar Ln Lancaster, TX | 3.0 | 2.0 | 1744 | $1,825 | $1.05 | 7d | 1 | 0.30mi |
| 610 Canvas Ct Lancaster, TX | 4.0 | 2.0 | 1859 | $2,276 | $1.22 | 7d | 1 | 0.34mi |
| 610 Canvas Ct Lancaster, TX | 4.0 | 2.0 | 1859 | $2,210 | $1.19 | 2d | 1 | 0.34mi |
| 1218 Jewell Ln Lancaster, TX | 4.0 | 2.0 | 1854 | $2,071 | $1.12 | 7d | 1 | 0.40mi |
| 1934 Mosley Dr Lancaster, TX | 4.0 | 2.0 | 1754 | $2,099 | $1.20 | 24d | 1 | 0.63mi |
| 1255 W Pleasant Run Rd Lancaster, TX | 1.0–2.0 | 1.0–2.0 | 802 | $1,450 | $1.81 | 7d | 10 | 0.70mi |
| 422 Ash Ln Lancaster, TX | 3.0 | 2.0 | 1651 | $1,995 | $1.21 | 24d | 1 | 0.74mi |
| 830 Bordner Dr Lancaster, TX | 3.0 | 2.0 | 1821 | $2,300 | $1.26 | 13d | 1 | 0.77mi |
| 1424 Chapman Dr Lancaster, TX | 3.0 | 2.0 | 1820 | $2,099 | $1.15 | 24d | 1 | 0.98mi |
| 1555 Willowbrook St Lancaster, TX | 3.0 | 2.0 | 1544 | $1,759 | $1.14 | 22d | 1 | 1.05mi |
| 1532 Linda Ln Lancaster, TX | 3.0 | 2.0 | 1380 | $2,000 | $1.45 | 24d | 1 | 1.05mi |
| 1533 Prescott Dr Lancaster, TX | 3.0 | 2.0 | 1500 | $1,975 | $1.32 | 4d | 1 | 1.06mi |
| 1326 Johns Ave Lancaster, TX | 4.0 | 2.0 | 1236 | $2,100 | $1.70 | 44d | 1 | 1.09mi |
| 577 W 6th St Lancaster, TX | 3.0 | 1.0 | 954 | $1,600 | $1.68 | 44d | 1 | 1.10mi |
| 1811 Kings Cross Dr Lancaster, TX | 4.0 | 2.0 | 1812 | $2,200 | $1.21 | 24d | 1 | 1.17mi |
| 721 Lindenwood Dr Lancaster, TX | 3.0 | 2.0 | 1606 | $1,895 | $1.18 | 7d | 1 | 1.30mi |
| 721 Lindenwood Dr Lancaster, TX | 3.0 | 2.0 | 1606 | $1,895 | $1.18 | 15d | 1 | 1.30mi |
| 509 Arbor Ln Lancaster, TX | 3.0 | 2.0 | 1494 | $1,875 | $1.26 | 44d | 1 | 1.37mi |
| 1750 Oneal St Lancaster, TX | 3.0 | 2.0 | 1460 | $2,100 | $1.44 | 44d | 1 | 1.39mi |
| 1226 Linkwood Ln Lancaster, TX | 4.0 | 2.0 | 1700 | $2,500 | $1.47 | 2d | 1 | 1.41mi |
| 1748 Cansler Ln Lancaster, TX | 4.0 | 2.0 | 1806 | $2,195 | $1.22 | 44d | 1 | 1.43mi |
Listing history 30 events
-
2026-06-18days on market $239,900 Active 290 DOM
-
2026-06-17days on market $239,900 Active 289 DOM
-
2026-06-16days on market $239,900 Active 288 DOM
-
2026-06-15days on market $239,900 Active 287 DOM
-
2026-06-13days on market $239,900 Active 285 DOM
-
2026-06-09days on market $239,900 Active 281 DOM
-
2026-06-08days on market $239,900 Active 280 DOM
-
2026-06-07days on market $239,900 Active 279 DOM
-
2026-06-04days on market $239,900 Active 276 DOM
-
2026-06-03days on market $239,900 Active 275 DOM
-
2026-06-02days on market $239,900 Active 274 DOM
-
2026-06-01days on market $239,900 Active 273 DOM
-
2026-05-31days on market $239,900 Active 272 DOM
-
2025-09-01$239,900 Active 839-char remark
Show marketing remark (839 chars)
Welcome to your new home! This charming 3-bedroom, 2-bathroom home with a 1-car garage is nestled in an established neighborhood and offers the perfect balance of comfort and convenience. Located close to shopping, dining, schools, and major highways, you’ll enjoy being just minutes from everything you need. Inside, the home features a freshly painted interior, updated fixtures, and a clean, inviting atmosphere that creates a warm, homey feel. The open layout makes it perfect for family living and entertaining. Step outside to a fenced backyard that’s ideal for kids, pets, and outdoor gatherings. The property also includes an alleyway with rear parking for added convenience. This is a great family home and is available for immediate move-in. ?? Don’t miss your chance—schedule a showing today!
-
2013-09-06soldstatus
-
2013-09-05soldstatus Closed 147-char remark
Show marketing remark (147 chars)
GREAT OLDER HOME WITH REAR ENTRY GARAGE, WOODBURNING FIREPLACE AND OPEN KITCHEN AREA. QUIET NEIGHBORHOOD. BUYER TO VERIFY MEASUREMENTS AND SCHOOLS.
-
2013-08-23historical Active Option Contract 147-char remark
Show marketing remark (147 chars)
GREAT OLDER HOME WITH REAR ENTRY GARAGE, WOODBURNING FIREPLACE AND OPEN KITCHEN AREA. QUIET NEIGHBORHOOD. BUYER TO VERIFY MEASUREMENTS AND SCHOOLS.
-
2013-08-14$73,900 Active 147-char remark
Show marketing remark (147 chars)
GREAT OLDER HOME WITH REAR ENTRY GARAGE, WOODBURNING FIREPLACE AND OPEN KITCHEN AREA. QUIET NEIGHBORHOOD. BUYER TO VERIFY MEASUREMENTS AND SCHOOLS.
-
2011-01-06historical
-
2010-12-31historical Active Kick-Out
-
2010-05-13$64,500 Active
-
2007-09-04soldstatus
-
2007-07-23historical
-
2007-03-30$72,000
-
2007-03-07soldstatus
-
2002-12-16soldstatus
-
2002-11-01historical
-
2002-08-11$83,000
-
2000-03-14soldstatus
-
1997-10-08soldstatus $60,515
ⓘ Source: listings_history table (triggers on properties + properties_extension) + one-shot
backfill from property_details.listing_events for pre-trigger history.
Tax reassessment forecast TX · Resets to sale price
- Current annual tax
- $4,433 · $369/mo
- Projected year-2 tax
- $4,433 · $369/mo
- Expected delta
- $0/yr ($0/mo · 0.0%)
ⓘ Screening estimate from a state-policy table — verify with the county assessor before closing.
Climate risk First Street
- Flood 1/10 Low FEMA zone X (unshaded) · 0% chance over 30 yrs
- Wildfire 4/10 Moderate
- Heat 8/10 Severe 7 d/yr ≥110°F today · 25 d/yr by 30 yrs out
- Wind 6/10 Major 27% chance of damaging wind over 30 yrs
- Air quality 2/10 Low 2 unhealthy d/yr today · 2 by 30 yrs out
Nearby sold comps map
Loading sold comps map…
Walkable amenities ~0.75 mi
Loading nearby amenities…
Taxation est. · year 1
- Rental income
- $26,279
- − Mortgage interest
- −$13,438
- − Property taxes
- −$4,433
- − Insurance
- −$1,200
- − Repairs & maintenance
- −$2,102
- − Management
- −$2,102
- − Depreciation
- −$6,979
- Taxable loss
- −$3,975
- Est. tax savings @ 24.0%
- +$954
- After-tax cash flow
- $985/yr
For passive investors: Depreciation is non-cash, so a rental often shows a tax loss while cash-flowing — sheltering income. Rental losses are passive: they offset passive income freely, and up to $25,000/yr can offset ordinary (W-2) income if you actively participate and your MAGI is under $100k (phasing out to $0 by $150k); unused losses carry forward. On sale, claimed depreciation is recaptured at up to 25%, and gains may owe capital-gains tax (a 1031 exchange can defer both). Figures are a year-1 estimate at your 24.0% rate — not tax advice; consult a CPA.
Schools (NCES district)
- District
- Lancaster ISD
- NCES district ID
- 4826670
- Math proficiency
- 19% ▼ -29.00%
- Reading proficiency
- 29% ▼ -11.00%
- Median HH income
- $52,275
- Composite
- 21.41/100
- National rank
- #8349
- State rank
- #714 of 826 in TX
Livability — Lancaster
- Score
- 62/100
- State rank
- #926
- US rank
- #16461
Category grades
Schools grade is shown separately in the Schools card above.
Census & demographics
- Census place
- Lancaster, TX
- County
- Dallas County · 2,612,404 people
- City population
- 44,142
- Metro
- Dallas-Fort Worth-Arlington, TX
- Population (ZIP)
- 25,097
- Household income
- $68,071
- Rent vs Own
- Severe rent burden
- 1462.0
Population outlook (Dallas County) Hauer SSP2
- Today (2025)
- 2,979,839 people
- By 2030
- 3,191,823 · +7.1%
- By 2040
- 3,619,611 · +21.5%
- By 2050
- 4,026,915 · +35.1%
- By 2075
- 4,957,073 · +66.4%
- By 2100
- 5,508,725 · +84.9%
Race, ethnicity, and origin ACS 2023
- Neighborhood character
- Diverse neighborhood (Simpson 0.57)
- Race & ethnicity
- Black 60% Hispanic / Latino 26% Two or more races 12% White 11%
- Hispanic origin (detail)
- Mexican 20% Puerto Rican 2%
- Common ancestry
- Italian 2%
- Foreign-born
- 7% · Canada
- Languages at home
- 80% English-only · Spanish 20%
Political lean MEDSL · Dallas
- 2024 margin
- Strong D (+22.2) · D 60.2% · R 38.0% · Other 1.8%
- 2008→2024 swing
- +6.9pp toward D · 2008: 15.3pp · 2024: 22.2pp
- All cycles
- 2024: D+22.2 2020: D+31.6 2016: D+26.2 2012: D+15.4 2008: D+15.3
Not yet ingested
- Civics
- —
Market trends
- HPI YoY
- ▲ 3.57%
- Current HPI
- 316.7295
- Rent YoY
- ▲ 2.96%
- Metro
- Dallas-Fort Worth-Arlington, TX
- State GDP YoY
- ▲ 3.95%
- F500 in state
- 110
Industry mix (Fortune 500 HQ in TX)
| Industry | F500 HQs | Revenue |
|---|---|---|
| Energy | 16 | $1,198B |
|
||
| Technology | 5 | $198B |
|
||
| Engineering / Construction | 4 | $72B |
|
||
| Energy Services | 3 | $60B |
|
||
| Utilities | 3 | $41B |
|
||
| Healthcare | 2 | $330B |
|
||
Price history
+296.4% since first listed17 events — show timeline
- 2025-09-01 Listed $239,900 NTREIS
- 2013-09-06 Sold (Public Records) — Public Records
- 2013-09-05 Sold (MLS) — NTREIS
- 2013-08-23 Contingent — NTREIS
- 2013-08-14 Listed $73,900 NTREIS
- 2011-01-06 Listing Removed — NTREIS
- 2010-12-31 Contingent — NTREIS
- 2010-05-13 Listed $64,500 NTREIS
- 2007-09-04 Sold (MLS) — NTREIS
- 2007-07-23 Listing Removed — NTREIS
- 2007-03-30 Listed $72,000 NTREIS
- 2007-03-07 Sold (Public Records) — Public Records
- 2002-12-16 Sold (Public Records) — Public Records
- 2002-11-01 Listing Removed — NTREIS
- 2002-08-11 Listed $83,000 NTREIS
- 2000-03-14 Sold (Public Records) — Public Records
- 1997-10-08 Sold (Public Records) $60,515 Public Records
Property tax history
+5.9%/yrLatest (2025): $4,433 · -0.2% YoY. Source: county tax records.
Cash-flow waterfall
monthlySold comps — $/sqft
last 12 mo · ≤1 miLoading sold comps…