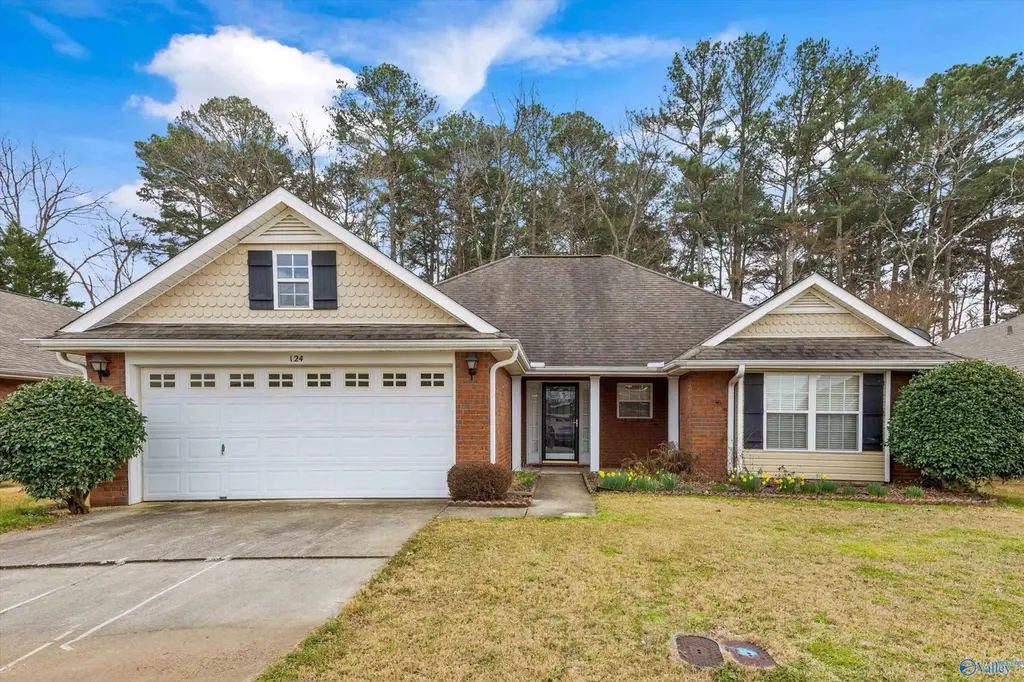
124 Imogene Way · Huntsville, AL
Flood risk 1/10 · Minimal
- FEMA flood zone
- X (unshaded)
- Chance of flooding over 30 yrs
- 0.0%
- Est. flood insurance / yr
- $507 – $1,088
Fire risk 3/10 · Minor
- Est. fire insurance / yr
- $916 – $1,700
Heat risk 5/10 · Moderate
- Hot days now (above 106°F)
- 7 days/yr
- Hot days in 30 yrs
- 19 days/yr
Wind risk 4/10 · Minor
- Chance of severe wind over 30 yrs
- 15.0%
Air-quality risk 2/10 · Minimal
- Unhealthy air days now
- 0 days/yr
- Unhealthy air days in 30 yrs
- 2 days/yr
Risk factors via First Street. Map © Google.
Why this score? — see what drove the D- grade
The composite is a weighted blend of 9 inputs, each scored 0–100. Each bar is that input's sub-score; the figure is the points it added to the 100-point composite (weight × sub-score).
- Appreciation +10.0/10.0
- ARV discount +8.8/15.0
- Cash flow +6.6/30.0
- Livability +4.1/5.0
- Rent growth +2.9/5.0
- Schools +2.9/10.0
- Condition / age +2.5/5.0
- DSCR +0.8/10.0
- 1% rule +0.5/10.0
$320,000
🖨 Deal sheet (PDF) 📄 Offer letter ✓ Due diligence
Listing remarks MLS
NEW FLOORING! Charming one-story home in Madison featuring a comfortable and inviting layout. The kitchen and dining area showcase new flooring, adding a fresh update to these functional spaces. This home offers a warm and welcoming feel with well-defined living areas and plenty of charm throughout. Several key systems have been updated for added peace of mind, including a water heater approximately 4 years old, HVAC around 5 years old, and a roof approximately 10 years old. Step outside to enjoy the fenced-in backyard, perfect for pets, outdoor gatherings, or relaxing evenings. This home offers a great opportunity for comfortable living in a desirable area!
Key facts
- New flooring
- Updated key systems
- Fenced-in backyard
Tags
Neighborhood map
What this means for you Summary
Snapshot
- This is a 3-bed/1.0-bath single-family listed at $320k.
Deal economics
- At list price, monthly cash flow is $-530 ($-6k/yr) — negative.
- To cash-flow at today's rent, offer at most $226k (29.3% below list).
- To meet the 1% rule (rent ≥ 1% of price), the offer needs to be $178k (44.5% below list).
- Recommended offer: $178k (44.5% below list) — sets the bar for 1% rule.
Location & tenants
- Location reads 82/100 on livability (#3 in AL, #1,082 nationally) — a professional / high-income tenant draw. Strengths: commute A+, cost of living A+, housing A+; Watch: crime F.
- Huntsville City (urban): math 21% / reading 46% proficiency, ranked #48 of 129 in AL (top 37%) — families likely to look elsewhere, expect single-tenant / working-renter base with shorter leases.
- Market conditions: Rents rising (+1.6%/yr); 382 active listings in the ZIP; 22 comparable units currently listed for rent nearby; rentals at typical pace (median 25d on market — plan ~3-4 weeks tenant-placement turnaround); high-income renter base; 4,709 units permitted in Madison County in 2024 (1,186 in 5+ unit buildings).
Forward outlook
- In year one you build about $34k of equity ($2k loan paydown + $32k appreciation (10.0% local appreciation)).
- Madison County population projected at +18% by 2050 — long-run rental-demand tailwind backs the buy-and-hold thesis.
- By year 2, paydown + projected appreciation supports a ~$55k cash-out refi (75% LTV) — recoverable capital for the next deal without selling this one.
Negotiation context
- It's been on market 98 days — a 9% lower offer ($291k) is reasonable based on typical stale-listing flexibility.
Risks & watch-outs
- Climate carrying-cost: extreme-heat days projected 7→19/yr by 2055 (HVAC capex compounding) — expect insurance premiums to compound above CPI over the hold.
Questions for the listing agent
- What do current leases actually rent for vs. the listed asking? Can we see a recent rent roll and the last 12 months of T-12 income?
- It's been on market 98 days. Have you received any prior offers? Is the seller open to a 45% concession, seller financing, or rate buy-down credit?
- What does the HOA fee cover, when was the last increase, and are there any pending special assessments or reserve-fund shortfalls?
- Why hasn't it sold? Are there any deal-killer items the seller is aware of (foundation, flood, title, zoning, code violations)?
- Is there a deadline driving the sale (1031 exchange, divorce, estate, relocation)? That informs how much negotiation room exists.
- Crime grade is F in this area — have there been break-ins, vandalism, or insurance claims at this property in the last 3 years? What carrier currently insures it and at what premium?
- The area grade is low — what's the realistic commute time and amenity access for the typical tenant pool here? Any planned neighborhood developments (good or bad) we should know about?
- What's the average days-on-market for RENTAL listings here right now (not sales)? A rising rental-DOM trend means longer vacancies and softer asking-rent achievability than the comps imply.
- What's the recent tenant-quality profile in this submarket — average credit score on applications, eviction rate, late-payment / NSF rate, and stable-employment percentage? A property-management company in the area should have these aggregated.
- How much new for-sale + rental construction is in the pipeline within 1–3 miles? Heavy new supply typically softens prices + rents 12–24 months out; constrained supply supports both.
Investment metrics
- 1% rule
- 0.55% ✗
- Cap rate
- 4.31%
- Cash-on-cash
- -7.10%
- DSCR
- 0.68
- GRM
- 15.0
CMA / ARV
- ARV (median comp)
- $329,649
- List price
- $320,000
- Delta
- -2.93%
- Verdict
- FAIR
- Comps
- 20 within 1.0 mi
Show comp detail 12 sales within ~0.75 mi
| Address | Dist | Beds/Ba | Sqft | Sold | Price | $/sf | Match |
|---|---|---|---|---|---|---|---|
| 114 Artesian Ln NW | 0.16mi | 3/2.0 | 1,650 (-0%) | 6mo | $312,000 | $189 | 84 |
| 120 NW Imogene Way | 0.02mi | 3/2.0 | 1,582 (-4%) | 9mo | $316,500 | $200 | 80 |
| 101 Imogene Way | 0.12mi | 3/2.0 | 1,704 (+3%) | 7mo | $355,000 | $208 | 79 |
| 112 Wittington Ln | 0.12mi | 3/2.0 | 1,682 (+2%) | 11mo | $313,000 | $186 | 78 |
| 302 Sweetwood Ln | 0.37mi | 3/2.5 | 1,694 (+3%) | 6mo | $260,000 | $153 | 67 |
| 300 Sweetwood Ln | 0.38mi | 3/2.5 | 1,702 (+3%) | 8mo | $257,000 | $151 | 64 |
| 212 Postwood Ct | 0.66mi | 3/2.5 | 1,667 (+1%) | 7mo | $289,900 | $174 | 56 |
| 209 River Oaks Dr | 0.68mi | 3/2.5 | 1,583 (-4%) | 2mo | $325,000 | $205 | 54 |
| 101 Maple Valley Dr | 0.75mi | 3/2.0 | 1,534 (-7%) | 4mo | $245,000 | $160 | 46 |
| 226 River Oaks Dr | 0.58mi | 3/2.0 | 1,499 (-9%) | 10mo | $294,900 | $197 | 45 |
| 201 Sandy Wood Ct | 0.66mi | 3/2.0 | 1,450 (-12%) | 1mo | $292,500 | $202 | 44 |
| 6418 Midtowne Ln | 0.75mi | 3/3.0 | 1,558 (-6%) | 11mo | $365,000 | $234 | 39 |
Match score weights: distance 35% · size 25% · config 20% · recency 20%. Top-matched comps best support the ARV.
Projected returns pro-forma
10.0% appreciation · 1.58% rent growth · sell at horizon
- IRR
- 18.9%
- Equity multiple
- 2.54×
- Total profit
- $137,873
- Equity at exit
- $288,281
- IRR
- 17.3%
- Equity multiple
- 5.77×
- Total profit
- $427,489
- Equity at exit
- $621,690
Cash invested: $89,600 (down + closing). Projections, not guarantees.
Landlord ↔ Tenant lean methodology
- Overall (STATE)
- 90 Strongly Landlord-Friendly
- State Alabama
- 90 Strongly Landlord-Friendly · R+15
- County
- — inherits STATE
- City
- — inherits STATE
ZIP-level market 35758
- Home prices YoY
- 4.2%
- Rents YoY
- 1.6%
- Active inventory
- 382
- Price-to-rent
- 15.0×
Monthly cashflow live
- Estimated rent
- $1,775 high interval (Pro) →
- Mortgage (P&I)
- −$1,678
- Tax from tax record
- −$109 /mo · $1,309/yr
- Insurance
- −$133
- HOA
- −$12
- Vacancy / Maint / Mgmt
- −$373
- Net cashflow
- $-530
Break-even live
Sensitivity live
| Price | -10% $-349 | -5% $-440 | +0% $-530 | +5% $-621 | +10% $-711 |
|---|---|---|---|---|---|
| Rent | -10% $-670 | -5% $-600 | +0% $-530 | +5% $-460 | +10% $-390 |
| Rate | -1.0pp $-369 | -0.5pp $-449 | base $-530 | +0.5pp $-613 | +1.0pp $-697 |
UW: 25.0% down · 7.5% · 30yr · 1.5% tax · 5.0% vac · 8.0% maint · 8.0% mgmt
Financing live
Cash to close
- Down payment
- $80,000
- Closing costs
- $9,600
- Reserves months
- —
- Total cash needed
- —
Loan-product check · same deal, 3 products live
Conventional
25% down · 7.5% · 30yr
- Down + closing
- —
- Monthly P&I
- —
- Monthly cashflow
- —
- DSCR
- —
- Eligible?
- —
Personal DTI + credit; lowest rate.
DSCR
20% down · 8.5% · 30yr
- Down + closing
- —
- Monthly P&I
- —
- Monthly cashflow
- —
- DSCR
- —
- Eligible?
- —
No personal income docs; deal must DSCR.
Hard money
10% down · 12.0% · 12mo
- Down + closing
- —
- Monthly P&I
- —
- Monthly cashflow
- —
- DSCR
- —
- Eligible?
- —
Short-term bridge; refi at stabilization.
Rent comps 22 comps
| Address | Beds | Baths | Sqft | Rent | $/sqft | DOM | Units | Dist |
|---|---|---|---|---|---|---|---|---|
| 126 Imogene Way Madison, AL | 4.0 | 2.0 | 1858 | $1,850 | $1.00 | 45d | 1 | 0.04mi |
| 102 Wittington Ln Madison, AL | 3.0 | 2.0 | 1635 | $1,750 | $1.07 | 45d | 1 | 0.10mi |
| 117 Millside Ln Madison, AL | 3.0 | 2.0 | 1624 | $1,750 | $1.08 | 45d | 1 | 0.12mi |
| 139 Potters Wheel Madison, AL | 3.0 | 2.0 | 1624 | $1,675 | $1.03 | 45d | 1 | 0.19mi |
| 278 Postwood Ct Madison, AL | 3.0 | 2.5 | 1403 | $1,650 | $1.18 | 15d | 1 | 0.47mi |
| 247 Postwood Ct Madison, AL | 3.0 | 2.5 | 1787 | $1,675 | $0.94 | 15d | 1 | 0.50mi |
| 1763 Slaughter Rd NW Madison, AL | 1.0–3.0 | 1.0–3.0 | 1078 | $1,859 | $1.72 | 15d | 36 | 0.51mi |
| 236 River Oaks Dr Madison, AL | 3.0 | 2.0 | 1240 | $1,600 | $1.29 | 45d | 1 | 0.55mi |
| 6941 Hwy 72 W Huntsville, AL | 1.0–3.0 | 1.0–2.0 | 1113 | $1,531 | $1.38 | 15d | 21 | 0.69mi |
| 107 Highwood Ct Madison, AL | 4.0 | 2.5 | 1579 | $1,595 | $1.01 | 24d | 1 | 0.81mi |
| 1111 Pegasus Dr NW Huntsville, AL | 4.0 | 4.5 | 1886 | $2,800 | $1.48 | 24d | 1 | 0.97mi |
| 1450 Paramount Dr Huntsville, AL | 1.0–3.0 | 1.0–2.0 | 997 | $1,310 | $1.31 | 15d | 16 | 1.00mi |
| 100 River Oaks Dr Madison, AL | 3.0 | 2.0 | 1126 | $1,600 | $1.42 | 24d | 1 | 1.02mi |
| 30 Gates Mill St Huntsville, AL | 1.0–2.0 | 1.0–2.0 | 1002 | $1,683 | $1.68 | 15d | 39 | 1.09mi |
| 196 Jeff Rd NW Huntsville, AL | 1.0–3.0 | 1.0–3.5 | 1200 | $1,729 | $1.44 | 15d | 21 | 1.16mi |
| 30 Pine St NW Huntsville, AL | 3.0 | 2.5 | 1412 | $2,595 | $1.84 | 24d | 1 | 1.18mi |
| 21 Stone Mason Way NW Huntsville, AL | 4.0 | 3.5 | 1778 | $2,700 | $1.52 | 45d | 1 | 1.19mi |
| 20 Town Center Dr NW Huntsville, AL | 1.0–3.0 | 1.0–2.0 | 1089 | $2,750 | $2.53 | 15d | 113 | 1.25mi |
| 445 Providence Main St NW #310 Huntsville, AL | 2.0 | 2.0 | 1494 | $1,900 | $1.27 | 45d | 1 | 1.35mi |
| 403 Barrington Hills Dr Madison, AL | 4.0 | 2.0 | 1820 | $1,950 | $1.07 | 22d | 1 | 1.35mi |
| 6500 Walden Run Huntsville, AL | 1.0–3.0 | 1.0–2.0 | 1060 | $1,795 | $1.69 | 15d | 104 | 1.40mi |
| 685 Providence Main St NW Huntsville, AL | 1.0–3.0 | 1.0–2.0 | 1083 | $1,523 | $1.41 | 15d | 53 | 1.48mi |
HOA detail
- Monthly dues
- $12 · $144/yr
- Likely covers
- water
Listing history 16 events
-
2026-06-18days on market $320,000 Active 98 DOM
-
2026-06-17days on market $320,000 Active 97 DOM
-
2026-06-16days on market $320,000 Active 96 DOM
-
2026-06-15days on market $320,000 Active 95 DOM
-
2026-06-14days on market $320,000 Active 93 DOM
-
2026-06-10days on market $320,000 Active 90 DOM
-
2026-06-09days on market $320,000 Active 89 DOM
-
2026-06-08days on market $320,000 Active 88 DOM
-
2026-06-07days on market $320,000 Active 87 DOM
-
2026-06-03days on market $320,000 Active 83 DOM
-
2026-06-02days on market $320,000 Active 82 DOM
-
2026-06-01days on market $320,000 Active 81 DOM
-
2026-05-31days on market $320,000 Active 80 DOM
-
2026-05-30days on market $320,000 Active 79 DOM
-
2026-04-27price $320,000 666-char remark
Show marketing remark (666 chars)
NEW FLOORING! Charming one-story home in Madison featuring a comfortable and inviting layout. The kitchen and dining area showcase new flooring, adding a fresh update to these functional spaces. This home offers a warm and welcoming feel with well-defined living areas and plenty of charm throughout. Several key systems have been updated for added peace of mind, including a water heater approximately 4 years old, HVAC around 5 years old, and a roof approximately 10 years old. Step outside to enjoy the fenced-in backyard, perfect for pets, outdoor gatherings, or relaxing evenings. This home offers a great opportunity for comfortable living in a desirable area!
-
2026-03-12$330,000 Active 666-char remark
Show marketing remark (666 chars)
NEW FLOORING! Charming one-story home in Madison featuring a comfortable and inviting layout. The kitchen and dining area showcase new flooring, adding a fresh update to these functional spaces. This home offers a warm and welcoming feel with well-defined living areas and plenty of charm throughout. Several key systems have been updated for added peace of mind, including a water heater approximately 4 years old, HVAC around 5 years old, and a roof approximately 10 years old. Step outside to enjoy the fenced-in backyard, perfect for pets, outdoor gatherings, or relaxing evenings. This home offers a great opportunity for comfortable living in a desirable area!
ⓘ Source: listings_history table (triggers on properties + properties_extension) + one-shot
backfill from property_details.listing_events for pre-trigger history.
Tax reassessment forecast AL · Resets to sale price
- Current annual tax
- $1,309 · $109/mo
- Projected year-2 tax
- $1,312 · $109/mo
- Expected delta
- +$3/yr ($0/mo · 0.2%)
ⓘ Screening estimate from a state-policy table — verify with the county assessor before closing.
Climate risk First Street
- Flood 1/10 Low FEMA zone X (unshaded) · 0% chance over 30 yrs
- Wildfire 3/10 Moderate
- Heat 5/10 Major 7 d/yr ≥106°F today · 19 d/yr by 30 yrs out
- Wind 4/10 Moderate 15% chance of damaging wind over 30 yrs
- Air quality 2/10 Low 0 unhealthy d/yr today · 2 by 30 yrs out
Nearby sold comps map
Loading sold comps map…
Walkable amenities ~0.75 mi
Loading nearby amenities…
Taxation est. · year 1
- Rental income
- $21,303
- − Mortgage interest
- −$17,925
- − Property taxes
- −$1,309
- − Insurance
- −$1,600
- − Repairs & maintenance
- −$1,704
- − Management
- −$1,704
- − HOA
- −$144
- − Depreciation
- −$9,309
- Taxable loss
- −$12,393
- Est. tax savings @ 24.0%
- +$2,974
- After-tax cash flow
- $-3,387/yr
For passive investors: Depreciation is non-cash, so a rental often shows a tax loss while cash-flowing — sheltering income. Rental losses are passive: they offset passive income freely, and up to $25,000/yr can offset ordinary (W-2) income if you actively participate and your MAGI is under $100k (phasing out to $0 by $150k); unused losses carry forward. On sale, claimed depreciation is recaptured at up to 25%, and gains may owe capital-gains tax (a 1031 exchange can defer both). Figures are a year-1 estimate at your 24.0% rate — not tax advice; consult a CPA.
Schools (NCES district)
- District
- Huntsville City
- NCES district ID
- 0101800
- Math proficiency
- 21% ▼ -23.00%
- Reading proficiency
- 46% ▬ 0.00%
- Median HH income
- $48,264
- Composite
- 28.84/100
- National rank
- #6647
- State rank
- #48 of 129 in AL
Livability — Huntsville
- Score
- 82/100
- State rank
- #3
- US rank
- #1082
Category grades
Schools grade is shown separately in the Schools card above.
Census & demographics
- Census place
- Huntsville, AL
- County
- Madison County · 380,832 people
- City population
- 220,435
- Metro
- Huntsville, AL
- Population (ZIP)
- 50,266
- Household income
- $117,380
- Rent vs Own
- Severe rent burden
- 875.0
Population outlook (Madison County) Hauer SSP2
- Today (2025)
- 392,086 people
- By 2030
- 409,788 · +4.5%
- By 2040
- 440,557 · +12.4%
- By 2050
- 460,990 · +17.6%
- By 2075
- 502,872 · +28.3%
- By 2100
- 513,623 · +31.0%
Race, ethnicity, and origin ACS 2023
- Neighborhood character
- Predominantly White (68%)
- Race & ethnicity
- White 68% Black 14% Hispanic / Latino 8% Asian 7% Two or more races 7%
- Hispanic origin (detail)
- Mexican 3% Puerto Rican 2%
- Common ancestry
- Slovak 3% Italian 2% Lithuanian 2%
- Foreign-born
- 9% · Canada, South Korea, Vietnam
- Languages at home
- 87% English-only · Spanish 5% Other Asian/Pacific 2% Chinese 1%
Political lean MEDSL · Madison
- 2024 margin
- Lean R (+9.0) · D 44.7% · R 53.7% · Other 1.6%
- 2008→2024 swing
- +6.0pp toward D · 2008: -14.9pp · 2024: -9.0pp
- All cycles
- 2024: R+9.0 2020: R+8.0 2016: R+16.8 2012: R+18.7 2008: R+14.9
Not yet ingested
- Civics
- —
Market trends
- HPI YoY
- ▲ 14.46%
- Current HPI
- 355.2784
- Rent YoY
- ▲ 1.58%
- Metro
- Huntsville, AL
- State GDP YoY
- ▲ 2.94%
- F500 in state
- 4
Industry mix (Fortune 500 HQ in AL)
| Industry | F500 HQs | Revenue |
|---|---|---|
| Financial Services | 1 | $8B |
|
||
| Healthcare | 1 | $5B |
|
||
Price history
-3.0% since first listed2 events — show timeline
- 2026-04-27 Price Changed $320,000 VMLS
- 2026-03-12 Listed $330,000 VMLS
Property tax history
+6.0%/yrLatest (2024): $1,309 · +1.7% YoY. Source: county tax records.
Cash-flow waterfall
monthlySold comps — $/sqft
last 12 mo · ≤1 miLoading sold comps…