 🏷️ Likely Rental
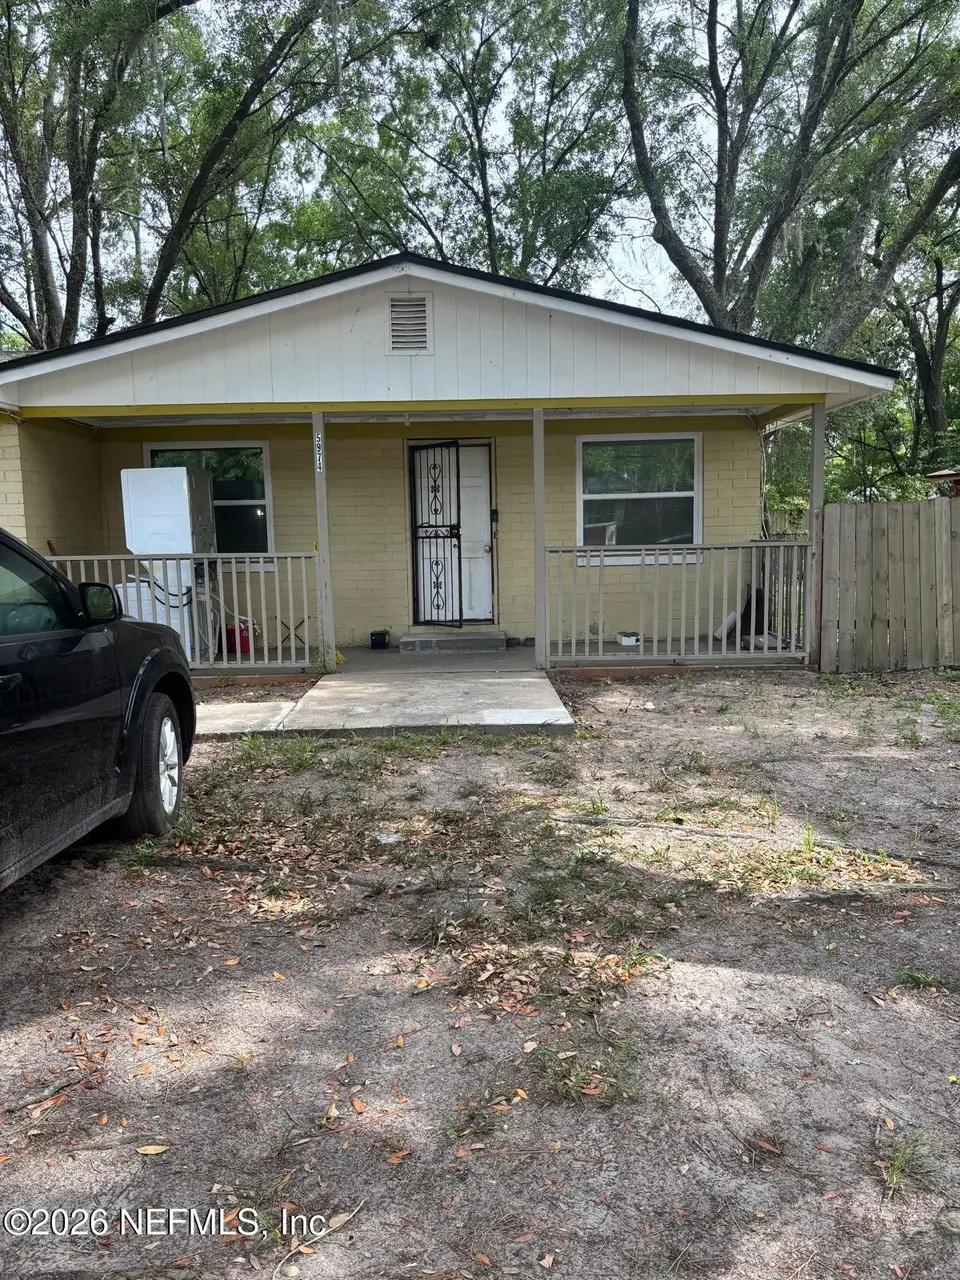
5974 Charles D Evers Dr · Jacksonville, FL
Flood risk 1/10 · Minimal
- FEMA flood zone
- X (unshaded)
- Chance of flooding over 30 yrs
- 0.0%
- Est. flood insurance / yr
- $507 – $1,088
Fire risk 5/10 · Moderate
- Est. fire insurance / yr
- $947 – $1,759
Heat risk 9/10 · Severe
- Hot days now (above 107°F)
- 7 days/yr
- Hot days in 30 yrs
- 20 days/yr
Wind risk 9/10 · Severe
- Chance of severe wind over 30 yrs
- 99.0%
Air-quality risk 4/10 · Minor
- Unhealthy air days now
- 6 days/yr
- Unhealthy air days in 30 yrs
- 6 days/yr
Risk factors via First Street. Map © Google.
Why this score? — see what drove the C+ grade
The composite is a weighted blend of 9 inputs, each scored 0–100. Each bar is that input's sub-score; the figure is the points it added to the 100-point composite (weight × sub-score).
- Cash flow +20.7/30.0
- ARV discount +15.0/15.0
- DSCR +6.6/10.0
- 1% rule +5.2/10.0
- Livability +4.2/5.0
- Schools +3.9/10.0
- Condition / age +2.5/5.0
- Rent growth +2.4/5.0
- Appreciation +0.0/10.0
$201,999
🖨 Deal sheet (PDF) 📄 Offer letter ✓ Due diligence
Listing remarks MLS
Partially renovated, needs new roof. Currently have a family living there paying $1,080 on a month to month lease with a 60 day request to vacate. Mosly vinyl floring with carpets in the closets. Waher and dryer belongs to tenants, not included in sale. Partial window treatments belong to tenant. Great neighborhood and very friendly neighbors.
Key facts
- Built 1972
- Listed 12 days
Property features AI
Finance
- HOA & community: Not a senior community
Exterior
- Parking: Off-street parking
- Utilities: Cable available; Electricity available
- Home design: Single Family Residence
- Exterior features: No private pool; Residential single-family use
Interior
- Bedrooms: 5 bedrooms
- Bathrooms: 2 full bathrooms
- Heating & cooling: Central heating; Central air conditioning
- Interior features: Electric range
Neighborhood map
What this means for you Summary
Snapshot
- This is a 5-bed/2.0-bath single-family listed at $202k.
Deal economics
- At list price, monthly cash flow is $274 ($3k/yr) — positive.
- The deal already cash-flows at list — no discount required.
- Meets the 1% rule at list price ($2k rent vs $202k).
- Cap rate 7.9% vs local median 3.9% in Jacksonville — top-decile yield for the area; either an underpriced asset or a hidden risk that comps aren't pricing in. Stress-test before assuming the spread holds.
Location & tenants
- Location reads 83/100 on livability (#50 in FL, #911 nationally) — a professional / high-income tenant draw. Strengths: amenities A+, commute A+, housing A+.
- Duval (urban): math 46% / reading 45% proficiency, ranked #48 of 73 in FL (top 66%) — families likely to look elsewhere, expect single-tenant / working-renter base with shorter leases.
- Zoned schools: Grasp Academy (math 18% / reading 14%, grade F, #2,130 of 2,144 statewide, top 99%, 271 students, 52% FRL); Jean Ribault Middle School (math 28% / reading 24%, grade F, #506 of 571 statewide, top 89%, 679 students, 78% FRL); Jean Ribault High School (math 22% / reading 25%, grade F, #533 of 667 statewide, top 80%, 1,385 students, 71% FRL) — zoned schools average 67% FRL vs 49% district-wide (17 pts higher); higher-poverty schools than district average — tighter screening recommended.
- Zoned-school proficiency averages 22% at this address vs 46% district-wide (-24 pts) — the specific schools serving this property underperform the Duval average; the district grade overstates school quality for this exact location.
- Market conditions: Rents soft (-0.2%/yr); 549 active listings in the ZIP; 6 comparable units currently listed for rent nearby; rentals at typical pace (median 25d on market — plan ~3-4 weeks tenant-placement turnaround); 6,503 units permitted in Duval County in 2024 (1,131 in 5+ unit buildings).
- This rent runs 34% of the median local income ($72k/yr) — at the standard rent-burdened threshold; future hikes will face affordability resistance.
Forward outlook
- Local home prices are declining (-3.0%/yr); year-one equity from $1k of loan paydown is wiped out by about $6k of value loss. Plan a longer hold.
- Duval County population projected at +19% by 2050 — long-run rental-demand tailwind backs the buy-and-hold thesis.
Negotiation context
- Only 12 days on market — expect competitive offers; lowballing is unlikely to land.
- 5 sale attempts since 9y ago with the ask held roughly flat each time — persistent listings suggest the price (not the market) is what's stuck; bring a comps-based counter.
- Current owner paid $20k; list at $202k implies a 936% gain — meaningful room to come down on a strong offer.
Risks & watch-outs
- Climate carrying-cost: severe wind risk, 99% chance of damaging wind over 30y; moderate wildfire risk; extreme-heat days projected 7→20/yr by 2055 (HVAC capex compounding) — expect insurance premiums to compound above CPI over the hold.
Questions for the listing agent
- Built in 1972 — when were the roof, HVAC, electrical panel, plumbing, and water heater last replaced?
- Is there a deadline driving the sale (1031 exchange, divorce, estate, relocation)? That informs how much negotiation room exists.
- Schools are B-rated — typically a magnet for longer-tenancy family renters. What's the average tenant stay here, and is there a school-zone premium baked into asking?
- What's the average days-on-market for RENTAL listings here right now (not sales)? A rising rental-DOM trend means longer vacancies and softer asking-rent achievability than the comps imply.
- What's the recent tenant-quality profile in this submarket — average credit score on applications, eviction rate, late-payment / NSF rate, and stable-employment percentage? A property-management company in the area should have these aggregated.
- How much new for-sale + rental construction is in the pipeline within 1–3 miles? Heavy new supply typically softens prices + rents 12–24 months out; constrained supply supports both.
Investment metrics
- 1% rule
- 1.02% ✓
- Cap rate
- 7.92%
- Cash-on-cash
- 5.82%
- DSCR
- 1.26
- GRM
- 8.2
CMA / ARV
- ARV (on-the-fly)
- $257,416
- Comps found
- 12
Show comp detail 12 sales within ~0.75 mi
| Address | Dist | Beds/Ba | Sqft | Sold | Price | $/sf | Match |
|---|---|---|---|---|---|---|---|
| 7476 Queensgate Cir | 0.45mi | 4/2.0 (-1) | 1,600 (+14%) | 5mo | $280,000 | $175 | 46 |
| 7500 Queensgate Cir | 0.46mi | 4/2.0 (-1) | 1,607 (+15%) | 4mo | $299,990 | $187 | 45 |
| 7388 Simms Dr | 0.68mi | 4/2.0 (-1) | 1,525 (+9%) | 5mo | $250,000 | $164 | 44 |
| 7496 Queensgate Cir | 0.46mi | 4/2.0 (-1) | 1,607 (+15%) | 7mo | $290,990 | $181 | 43 |
| 7427 Queensgate Cir | 0.43mi | 4/2.0 (-1) | 1,607 (+15%) | 10mo | $304,990 | $190 | 42 |
| 7471 Queensgate Cir | 0.48mi | 4/2.0 (-1) | 1,607 (+15%) | 8mo | $292,990 | $182 | 41 |
| 7411 Queensgate Cir | 0.39mi | 4/2.0 (-1) | 1,607 (+15%) | 13mo | $292,990 | $182 | 41 |
| 7367 Queensgate Cir | 0.40mi | 4/2.0 (-1) | 1,607 (+15%) | 13mo | $280,990 | $175 | 40 |
| 7479 Queensgate Cir | 0.48mi | 4/2.0 (-1) | 1,607 (+15%) | 9mo | $305,990 | $190 | 40 |
| 7443 Queensgate Cir | 0.46mi | 4/2.0 (-1) | 1,607 (+15%) | 10mo | $314,990 | $196 | 40 |
| 7347 Queensgate Cir | 0.43mi | 4/2.0 (-1) | 1,607 (+15%) | 12mo | $307,990 | $192 | 40 |
| 7364 Queensgate Cir | 0.44mi | 4/2.0 (-1) | 1,607 (+15%) | 12mo | $295,990 | $184 | 40 |
Match score weights: distance 35% · size 25% · config 20% · recency 20%. Top-matched comps best support the ARV.
Projected returns pro-forma
-3.0% appreciation · 0.0% rent growth · sell at horizon
- IRR
- -10.7%
- Equity multiple
- 0.62×
- Total profit
- $-21,316
- Equity at exit
- $30,119
- IRR
- -6.1%
- Equity multiple
- 0.66×
- Total profit
- $-19,435
- Equity at exit
- $17,465
Cash invested: $56,560 (down + closing). Projections, not guarantees.
Landlord ↔ Tenant lean methodology
- Overall (STATE)
- 87 Strongly Landlord-Friendly
- State Florida
- 87 Strongly Landlord-Friendly · R+3
- County
- — inherits STATE
- City
- — inherits STATE
ZIP-level market 32219
- Home prices YoY
- -22.3%
- Rents YoY
- -0.2%
- Active inventory
- 549
- Price-to-rent
- 8.2×
Monthly cashflow live
- Estimated rent
- $2,065 high interval (Pro) →
- Mortgage (P&I)
- −$1,059
- Tax from tax record
- −$214 /mo · $2,564/yr
- Insurance
- −$84
- HOA
- −$0
- Vacancy / Maint / Mgmt
- −$434
- Net cashflow
- $274
Break-even live
Sensitivity live
| Price | -10% $388 | -5% $331 | +0% $274 | +5% $217 | +10% $160 |
|---|---|---|---|---|---|
| Rent | -10% $111 | -5% $193 | +0% $274 | +5% $356 | +10% $437 |
| Rate | -1.0pp $376 | -0.5pp $326 | base $274 | +0.5pp $222 | +1.0pp $169 |
UW: 25.0% down · 7.5% · 30yr · 1.5% tax · 5.0% vac · 8.0% maint · 8.0% mgmt
Financing live
Cash to close
- Down payment
- $50,500
- Closing costs
- $6,060
- Reserves months
- —
- Total cash needed
- —
Loan-product check · same deal, 3 products live
Conventional
25% down · 7.5% · 30yr
- Down + closing
- —
- Monthly P&I
- —
- Monthly cashflow
- —
- DSCR
- —
- Eligible?
- —
Personal DTI + credit; lowest rate.
DSCR
20% down · 8.5% · 30yr
- Down + closing
- —
- Monthly P&I
- —
- Monthly cashflow
- —
- DSCR
- —
- Eligible?
- —
No personal income docs; deal must DSCR.
Hard money
10% down · 12.0% · 12mo
- Down + closing
- —
- Monthly P&I
- —
- Monthly cashflow
- —
- DSCR
- —
- Eligible?
- —
Short-term bridge; refi at stabilization.
Rent comps 6 comps
| Address | Beds | Baths | Sqft | Rent | $/sqft | DOM | Units | Dist |
|---|---|---|---|---|---|---|---|---|
| 8036 Mattox Ave Jacksonville, FL | 4.0 | 2.0 | 1160 | $1,480 | $1.28 | 18d | 1 | 0.57mi |
| 8367 Tubman Ct Jacksonville, FL | 4.0 | 1.5 | 1398 | $1,790 | $1.28 | 19d | 1 | 0.92mi |
| 8645 Samona Dr W Jacksonville, FL | 4.0 | 1.0 | 1196 | $1,250 | $1.05 | 25d | 1 | 1.13mi |
| 9340 Sibbald Rd Jacksonville, FL | 4.0 | 2.0 | 1228 | $1,606 | $1.31 | 5d | 1 | 1.25mi |
| 8534 Addison Rd Jacksonville, FL | 4.0 | 2.0 | 1410 | $1,995 | $1.41 | 25d | 1 | 1.42mi |
| 8509 Addison Rd Jacksonville, FL | 4.0 | 2.0 | 1494 | $1,675 | $1.12 | 25d | 1 | 1.45mi |
Listing history 9 events
-
2026-06-21days on market $201,999 Active 12 DOM
-
2026-06-18days on market $201,999 Active 9 DOM
-
2026-06-17days on market $201,999 Active 8 DOM
-
2026-06-16days on market $201,999 Active 7 DOM
-
2026-06-15days on market $201,999 Active 6 DOM
-
2026-06-13days on market $201,999 Active 4 DOM
-
2026-06-13days on market $201,999 Active 3 DOM
-
2026-06-10remarks 699-char remark
-
2026-06-10$201,999 Active 1 DOM
ⓘ Source: listings_history table (triggers on properties + properties_extension) + one-shot
backfill from property_details.listing_events for pre-trigger history.
Tax reassessment forecast FL · Resets to sale price
- Current annual tax
- $2,564 · $214/mo
- Projected year-2 tax
- $2,564 · $214/mo
- Expected delta
- $0/yr ($0/mo · 0.0%)
ⓘ Screening estimate from a state-policy table — verify with the county assessor before closing.
Climate risk First Street
- Flood 1/10 Low FEMA zone X (unshaded) · 0% chance over 30 yrs
- Wildfire 5/10 Major
- Heat 9/10 Extreme 7 d/yr ≥107°F today · 20 d/yr by 30 yrs out
- Wind 9/10 Extreme 99% chance of damaging wind over 30 yrs
- Air quality 4/10 Moderate 6 unhealthy d/yr today · 6 by 30 yrs out
Nearby sold comps map
Loading sold comps map…
Walkable amenities ~0.75 mi
Loading nearby amenities…
Taxation est. · year 1
- Rental income
- $24,779
- − Mortgage interest
- −$11,315
- − Property taxes
- −$2,564
- − Insurance
- −$1,010
- − Repairs & maintenance
- −$1,982
- − Management
- −$1,982
- − Depreciation
- −$5,876
- Taxable income
- $49
- Est. tax owed @ 24.0%
- −$12
- After-tax cash flow
- $3,278/yr
For passive investors: Depreciation is non-cash, so a rental often shows a tax loss while cash-flowing — sheltering income. Rental losses are passive: they offset passive income freely, and up to $25,000/yr can offset ordinary (W-2) income if you actively participate and your MAGI is under $100k (phasing out to $0 by $150k); unused losses carry forward. On sale, claimed depreciation is recaptured at up to 25%, and gains may owe capital-gains tax (a 1031 exchange can defer both). Figures are a year-1 estimate at your 24.0% rate — not tax advice; consult a CPA.
Schools (NCES district)
- District
- Duval
- NCES district ID
- 1200480
- Math proficiency
- 46% ▼ -11.00%
- Reading proficiency
- 45% ▼ -4.00%
- Median HH income
- $48,987
- Composite
- 38.97/100
- National rank
- #4076
- State rank
- #48 of 73 in FL
Livability — Jacksonville
- Score
- 83/100
- State rank
- #50
- US rank
- #911
Category grades
Schools grade is shown separately in the Schools card above.
Census & demographics
- Census place
- Jacksonville, FL
- County
- Duval County · 1,015,274 people
- City population
- 979,034
- Metro
- Jacksonville, FL
- Population (ZIP)
- 14,302
- Household income
- $72,184
- Rent vs Own
- Severe rent burden
- 173.0
Population outlook (Duval County) Hauer SSP2
- Today (2025)
- 1,013,010 people
- By 2030
- 1,059,228 · +4.6%
- By 2040
- 1,141,439 · +12.7%
- By 2050
- 1,205,258 · +19.0%
- By 2075
- 1,324,282 · +30.7%
- By 2100
- 1,319,620 · +30.3%
Race, ethnicity, and origin ACS 2023
- Neighborhood character
- Majority Black (55%)
- Race & ethnicity
- Black 55% White 39% Hispanic / Latino 4% Two or more races 3%
- Common ancestry
- Italian 2% Romanian 1% Hispanic 1%
- Foreign-born
- 4% · Canada, Jamaica
- Languages at home
- 95% English-only · Spanish 3% French/Haitian/Cajun 0%
Political lean MEDSL · Duval
- 2024 margin
- Toss-up / Even · D 48.7% · R 50.1% · Other 1.2%
- 2008→2024 swing
- +0.4pp no change · 2008: -1.9pp · 2024: -1.5pp
- All cycles
- 2024: R+1.5 2020: D+3.8 2016: R+1.5 2012: R+3.6 2008: R+1.9
Not yet ingested
- Civics
- —
Market trends
- HPI YoY
- ▼ -75.90%
- Current HPI
- 263.8901
- Rent YoY
- ▼ -0.25%
- Metro
- Jacksonville, FL
- State GDP YoY
- ▲ 3.28%
- F500 in state
- 36
Industry mix (Fortune 500 HQ in FL)
| Industry | F500 HQs | Revenue |
|---|---|---|
| Industrial Technology | 2 | $29B |
|
||
| Insurance | 2 | $17B |
|
||
| Retail | 1 | $60B |
|
||
| Technology Distribution | 1 | $58B |
|
||
| Homebuilding | 1 | $35B |
|
||
| Technology Manufacturing | 1 | $35B |
|
||
Price history
+935.9% since first listed11 events — show timeline
- 2026-06-09 Listed $201,999 realMLS
- 2023-08-24 Relisted — realMLS
- 2023-08-24 Listing Removed — realMLS
- 2023-03-27 Pending — realMLS
- 2022-10-03 Listed $195,000 realMLS
- 2017-12-01 Listing Removed — realMLS
- 2017-10-11 Price Changed $89,500 realMLS
- 2017-09-23 Relisted — realMLS
- 2017-09-21 Listed $98,000 realMLS
- 2017-09-20 Listing Removed — realMLS
- 1972-03-29 Sold (Public Records) $19,500 Public Records
Property tax history
+12.8%/yrLatest (2025): $2,564 · +17.5% YoY. Source: county tax records.
Cash-flow waterfall
monthlySold comps — $/sqft
last 12 mo · ≤1 miLoading sold comps…