 Duplex
114 Harris Rd · Charlottesville, VA
Flood risk 1/10 · Minimal
- FEMA flood zone
- X (unshaded)
- Chance of flooding over 30 yrs
- 0.0%
- Est. flood insurance / yr
- $473 – $860
Fire risk 4/10 · Minor
- Est. fire insurance / yr
- $666 – $1,236
Heat risk 6/10 · Moderate
- Hot days now (above 102°F)
- 7 days/yr
- Hot days in 30 yrs
- 17 days/yr
Wind risk 2/10 · Minimal
- Chance of severe wind over 30 yrs
- 2.0%
Air-quality risk 1/10 · Minimal
- Unhealthy air days now
- 0 days/yr
- Unhealthy air days in 30 yrs
- 0 days/yr
Risk factors via First Street. Map © Google.
Why this score? — see what drove the D grade
The composite is a weighted blend of 9 inputs, each scored 0–100. Each bar is that input's sub-score; the figure is the points it added to the 100-point composite (weight × sub-score).
- Cash flow +13.0/30.0
- ARV discount +7.5/15.0
- Schools +4.4/10.0
- Livability +4.2/5.0
- DSCR +3.9/10.0
- Rent growth +3.6/5.0
- 1% rule +3.1/10.0
- Condition / age +2.5/5.0
- Appreciation +0.0/10.0
$530,000
🖨 Deal sheet (PDF) 📄 Offer letter ✓ Due diligence
Multi-family units
County records classify this as Multi-Family (2-4 Unit). Listing-text estimate: 2 units. confirmed
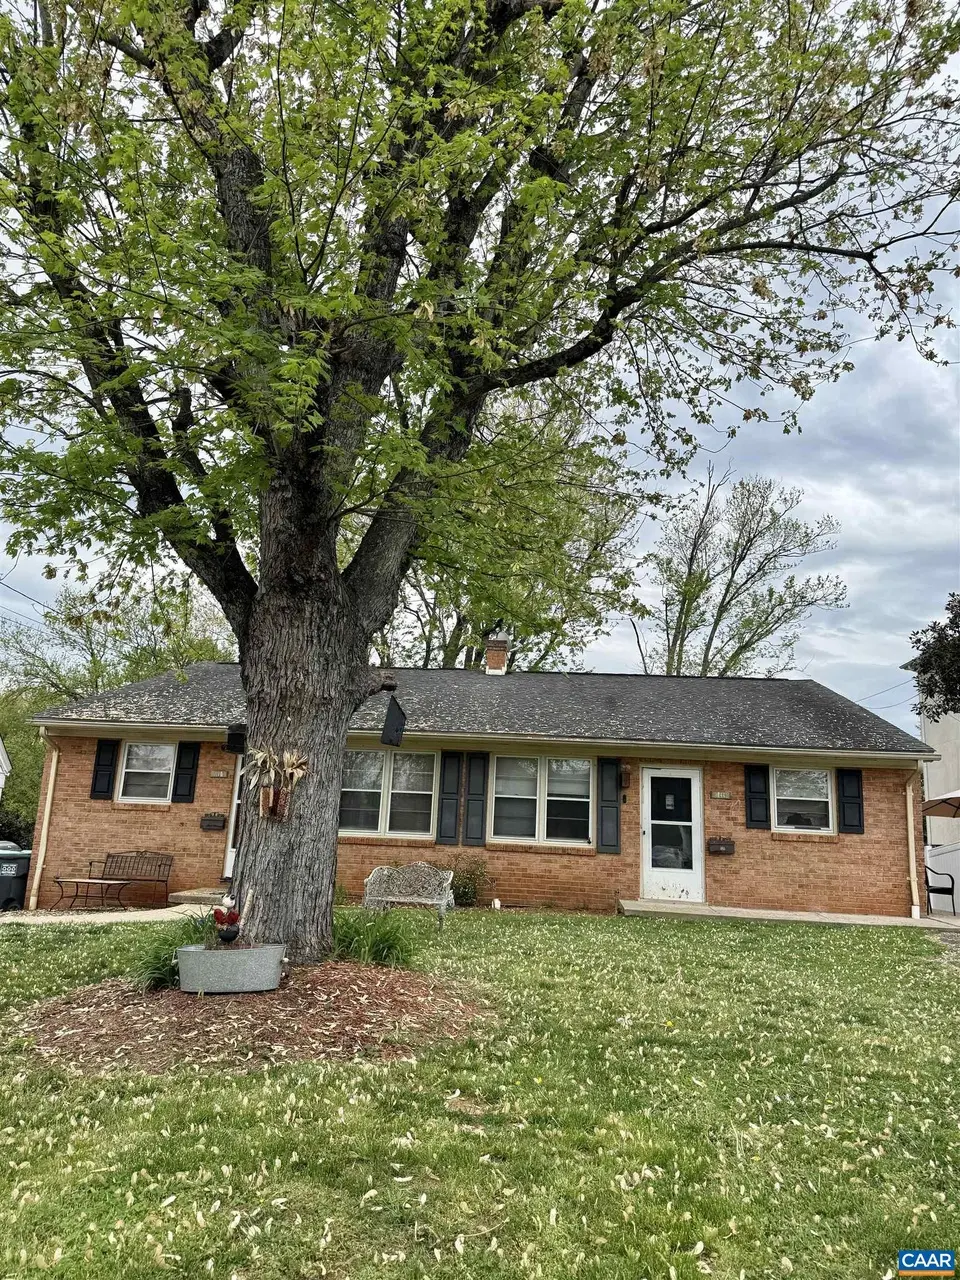
Listing remarks
Well-maintained brick duplex offering one-level living in a desirable location. Each unit features 3 spacious bedrooms and 1 full bathroom with unfinished walkout basements in both units, providing opportunities for future expansion or additional storage. Solid construction make this a strong investment opportunity or an ideal option for owner-occupants. Located in the sought-after Fry’s Spring area, close to local amenities, parks, and the University, this property offers both convenience and long-term value.
Key facts
- Brick duplex
- One-level living
- 8,712 sq ft lot
Tags
Property features AI
Finance
- Financial info: Owner pays insurance
Exterior
- Utilities: Public water; Public sewer
- Home design: Duplex (multi-family property)
- Construction: Block foundation
- Exterior features: Lot approximately 0.2 acres; Cable availability
Interior
- Bedrooms: Each unit has 3 bedrooms
- Bathrooms: Each unit has 1 bathroom
- Heating & cooling: Heat pump heating; Central air conditioning
- Interior features: Two-unit property
Neighborhood map
What this means for you Summary
Snapshot
- This is a 2 × 3-bed/1.0-bath units multifamily listed at $530k.
Deal economics
- At list price, monthly cash flow is $-33 ($-393/yr) — negative. Per door: $-16/mo.
- To cash-flow at today's rent, offer at most $524k (1.1% below list).
- To meet the 1% rule (rent ≥ 1% of price), the offer needs to be $431k (18.7% below list).
- Recommended offer: $431k (18.7% below list) — sets the bar for 1% rule.
- Cap rate 6.2% vs local median 2.9% in Charlottesville — top-decile yield for the area; either an underpriced asset or a hidden risk that comps aren't pricing in. Stress-test before assuming the spread holds.
Location & tenants
- Location reads 84/100 on livability (#27 in VA, #707 nationally) — a professional / high-income tenant draw. Strengths: amenities A+, commute A+, health & safety A+; Watch: cost of living D, crime D-.
- Charlottesville Cty Public School District (urban): math 42% / reading 61% proficiency, ranked #97 of 131 in VA (top 74%) — acceptable for families but not a draw, mixed tenant base, ~2y average lease.
- Zoned schools: Jackson-Via Elementary (math 47% / reading 52%, grade D, #742 of 1,108 statewide, top 70%, 344 students, 79% FRL); Walker Upper Elementary (math 31% / reading 53%, grade D-, #295 of 342 statewide, top 87%, 616 students, 72% FRL); Charlottesville High (math 53% / reading 84%, grade B, #178 of 319 statewide, top 56%, 1,359 students, 72% FRL) — zoned schools average 74% FRL vs 50% district-wide (24 pts higher); higher-poverty schools than district average — tighter screening recommended.
- Market conditions: Rents rising fast (+4.5%/yr); 225 active listings in the ZIP; 16 comparable units currently listed for rent nearby; rentals at typical pace (median 23d on market — plan ~3-4 weeks tenant-placement turnaround); 34 units permitted in Charlottesville city in 2024 (18 in 5+ unit buildings).
- At $4,311/mo this rent would consume 75% of the median local household income ($69k/yr) (locally 3060% of renters already pay >50% of income on rent) — very limited rent-growth headroom before tenants either downsize or default.
Forward outlook
- Local home prices are declining (-3.0%/yr); year-one equity from $4k of loan paydown is wiped out by about $16k of value loss. Plan a longer hold.
- Charlottesville County population projected at +30% by 2050 — long-run rental-demand tailwind backs the buy-and-hold thesis.
Negotiation context
- It's been on market 40 days — a 3% lower offer ($514k) is reasonable based on typical stale-listing flexibility.
- 2 sale attempts; this cycle's ask has dropped $30k (5%) from the opening price — seller is motivated, your offer sets the floor, not the list.
Risks & watch-outs
- Climate carrying-cost: extreme-heat days projected 7→17/yr by 2055 (HVAC capex compounding) — expect insurance premiums to compound above CPI over the hold.
Questions for the listing agent
- What do current leases actually rent for vs. the listed asking? Can we see a recent rent roll and the last 12 months of T-12 income?
- It's been on market 40 days. Have you received any prior offers? Is the seller open to a 19% concession, seller financing, or rate buy-down credit?
- Can we see the unit-by-unit rent roll, current vacancy, and any below-market leases? What's the average tenancy length?
- What capital expenditures (roof, boiler, parking lot, exteriors) have been made in the last 5 years, and what's planned in the next 2?
- Built in 1967 — when were the roof, HVAC, electrical panel, plumbing, and water heater last replaced?
- Is there a deadline driving the sale (1031 exchange, divorce, estate, relocation)? That informs how much negotiation room exists.
- Schools are A-rated — typically a magnet for longer-tenancy family renters. What's the average tenant stay here, and is there a school-zone premium baked into asking?
- Crime grade is D in this area — have there been break-ins, vandalism, or insurance claims at this property in the last 3 years? What carrier currently insures it and at what premium?
- The area grade is low — what's the realistic commute time and amenity access for the typical tenant pool here? Any planned neighborhood developments (good or bad) we should know about?
- What's the average days-on-market for RENTAL listings here right now (not sales)? A rising rental-DOM trend means longer vacancies and softer asking-rent achievability than the comps imply.
- What's the recent tenant-quality profile in this submarket — average credit score on applications, eviction rate, late-payment / NSF rate, and stable-employment percentage? A property-management company in the area should have these aggregated.
- How much new apartment / multifamily construction is in the pipeline within 1–3 miles? Heavy new supply (>2% of stock underway) typically softens rents 12–24 months out; light construction supports rent growth.
Investment metrics
- 1% rule
- 0.81% ✗
- Cap rate
- 6.22%
- Cash-on-cash
- -0.27%
- DSCR
- 0.99
- GRM
- 10.2
CMA / ARV
No comps found within radius.
Projected returns pro-forma
-3.0% appreciation · 4.49% rent growth · sell at horizon
- IRR
- -15.2%
- Equity multiple
- 0.45×
- Total profit
- $-81,485
- Equity at exit
- $79,025
- IRR
- -4.5%
- Equity multiple
- 0.69×
- Total profit
- $-46,197
- Equity at exit
- $45,825
Cash invested: $148,400 (down + closing). Projections, not guarantees.
Landlord ↔ Tenant lean methodology
- Overall (STATE)
- 55 Moderately Landlord-Leaning
- State Virginia
- 55 Moderately Landlord-Leaning · D+2
- County
- — inherits STATE
- City
- — inherits STATE
ZIP-level market 22903
- Rents YoY
- 4.5%
- Active inventory
- 225
- Price-to-rent
- 20.5×
Monthly cashflow live
- Estimated rent
- $4,311 high interval (Pro) →
- Mortgage (P&I)
- −$2,779
- Tax from tax record
- −$438 /mo · $5,259/yr
- Insurance
- −$221
- HOA
- −$0
- Vacancy / Maint / Mgmt
- −$905
- Net cashflow
- $-33
Break-even live
Sensitivity live
| Price | -10% $267 | -5% $117 | +0% $-33 | +5% $-183 | +10% $-333 |
|---|---|---|---|---|---|
| Rent | -10% $-373 | -5% $-203 | +0% $-33 | +5% $137 | +10% $308 |
| Rate | -1.0pp $234 | -0.5pp $102 | base $-33 | +0.5pp $-170 | +1.0pp $-310 |
2-unit breakdown (identical units grouped — click to expand)
| Units | Beds | Baths | Est. rent |
|---|---|---|---|
| 2× units | 3 | 1 | $4,312 |
| #1 | 3 | 1 | $2,156 |
| #2 | 3 | 1 | $2,156 |
| Total (2 units) | $4,311 | ||
UW: 25.0% down · 7.5% · 30yr · 1.5% tax · 5.0% vac · 8.0% maint · 8.0% mgmt
Financing live
Cash to close
- Down payment
- $132,500
- Closing costs
- $15,900
- Reserves months
- —
- Total cash needed
- —
Loan-product check · same deal, 3 products live
Conventional
25% down · 7.5% · 30yr
- Down + closing
- —
- Monthly P&I
- —
- Monthly cashflow
- —
- DSCR
- —
- Eligible?
- —
Personal DTI + credit; lowest rate.
DSCR
20% down · 8.5% · 30yr
- Down + closing
- —
- Monthly P&I
- —
- Monthly cashflow
- —
- DSCR
- —
- Eligible?
- —
No personal income docs; deal must DSCR.
Hard money
10% down · 12.0% · 12mo
- Down + closing
- —
- Monthly P&I
- —
- Monthly cashflow
- —
- DSCR
- —
- Eligible?
- —
Short-term bridge; refi at stabilization.
Rent comps 16 comps
| Address | Beds | Baths | Sqft | Rent | $/sqft | DOM | Units | Dist |
|---|---|---|---|---|---|---|---|---|
| 119 Keene Ct Charlottesville, VA | 4.0 | 3.5 | 2083 | $2,995 | $1.44 | 23d | 1 | 0.12mi |
| 2525 Woodland Dr Unit A Charlottesville, VA | 4.0 | 2.0 | 1860 | $2,950 | $1.59 | 15d | 1 | 0.29mi |
| 2709 Eton Rd Charlottesville, VA | 3.0 | 1.0 | 1228 | $2,100 | $1.71 | 15d | 1 | 0.49mi |
| 100 Dalton Ln Charlottesville, VA | 1.0–3.0 | 1.0–3.5 | 1154 | $2,803 | $2.43 | 15d | 13 | 0.63mi |
| 100 Wahoo Way Charlottesville, VA | 2.0–3.0 | 2.0–3.0 | 1159 | $2,272 | $1.96 | 15d | 45 | 0.71mi |
| 206 Stribling Ave Unit B Charlottesville, VA | 3.0 | 2.0 | 1260 | $2,200 | $1.75 | 23d | 1 | 0.77mi |
| 161 Brookwood Dr Charlottesville, VA | 3.0 | 2.5 | 1550 | $2,495 | $1.61 | 23d | 1 | 0.78mi |
| 901 Royer Dr Charlottesville, VA | 4.0 | 2.5 | 2262 | $2,850 | $1.26 | 45d | 1 | 0.80mi |
| 1046 Tupelo Ct Charlottesville, VA | 3.0 | 3.0 | 1601 | $2,595 | $1.62 | 15d | 1 | 0.81mi |
| 2302 Fontaine Avenue Ext Unit B Charlottesville, VA | 5.0 | 2.0 | 1972 | $3,750 | $1.90 | 15d | 1 | 0.84mi |
| 1720 Treetop Dr Charlottesville, VA | 2.0–3.0 | 2.0–3.0 | 1244 | $2,650 | $2.13 | 23d | 14 | 0.98mi |
| 1845 Candlewood Ct #104 Charlottesville, VA | 3.0 | 3.0 | 1369 | $2,495 | $1.82 | 23d | 1 | 1.01mi |
| 103 Linden St Charlottesville, VA | 4.0 | 2.5 | 2616 | $2,895 | $1.11 | 23d | 1 | 1.11mi |
| 503 Rockland Ave Charlottesville, VA | 4.0 | 1.0 | 1784 | $2,000 | $1.12 | 15d | 1 | 1.30mi |
| 3018 Horizon Rd Charlottesville, VA | 3.0 | 4.0 | 2595 | $2,950 | $1.14 | 23d | 1 | 1.47mi |
| 500 Ridge St Unit A Charlottesville, VA | 3.0 | 1.0 | 1574 | $2,100 | $1.33 | 23d | 1 | 1.48mi |
Listing history 9 events
-
2026-06-07statusdays on market $530,000 Pending 40 DOM
-
2026-06-02days on market $530,000 Active 36 DOM
-
2026-06-01days on market $530,000 Active 35 DOM
-
2026-05-31days on market $530,000 Active 34 DOM
-
2026-05-30days on market $530,000 Active 33 DOM
-
2026-05-14price $530,000
-
2026-04-30status Active
-
2026-04-30historical
-
2026-04-26$559,900 Active
ⓘ Source: listings_history table (triggers on properties + properties_extension) + one-shot
backfill from property_details.listing_events for pre-trigger history.
Tax reassessment forecast VA · Resets to sale price
- Current annual tax
- $5,259 · $438/mo
- Projected year-2 tax
- $5,259 · $438/mo
- Expected delta
- $0/yr ($0/mo · 0.0%)
ⓘ Screening estimate from a state-policy table — verify with the county assessor before closing.
Climate risk First Street
- Flood 1/10 Low FEMA zone X (unshaded) · 0% chance over 30 yrs
- Wildfire 4/10 Moderate
- Heat 6/10 Major 7 d/yr ≥102°F today · 17 d/yr by 30 yrs out
- Wind 2/10 Low 2% chance of damaging wind over 30 yrs
- Air quality 1/10 Low 0 unhealthy d/yr today · 0 by 30 yrs out
Nearby sold comps map
Loading sold comps map…
Walkable amenities ~0.75 mi
Loading nearby amenities…
Taxation est. · year 1
- Rental income
- $51,732
- − Mortgage interest
- −$29,688
- − Property taxes
- −$5,259
- − Insurance
- −$2,650
- − Repairs & maintenance
- −$4,139
- − Management
- −$4,139
- − Depreciation
- −$15,418
- Taxable loss
- −$9,561
- Est. tax savings @ 24.0%
- +$2,295
- After-tax cash flow
- $1,901/yr
For passive investors: Depreciation is non-cash, so a rental often shows a tax loss while cash-flowing — sheltering income. Rental losses are passive: they offset passive income freely, and up to $25,000/yr can offset ordinary (W-2) income if you actively participate and your MAGI is under $100k (phasing out to $0 by $150k); unused losses carry forward. On sale, claimed depreciation is recaptured at up to 25%, and gains may owe capital-gains tax (a 1031 exchange can defer both). Figures are a year-1 estimate at your 24.0% rate — not tax advice; consult a CPA.
Schools (NCES district)
- District
- Charlottesville Cty Public School District
- NCES district ID
- 5100780
- Math proficiency
- 42% ▼ -30.00%
- Reading proficiency
- 61% ▼ -10.00%
- Median HH income
- $47,211
- Composite
- 43.68/100
- National rank
- #2957
- State rank
- #97 of 131 in VA
Livability — Charlottesville
- Score
- 84/100
- State rank
- #27
- US rank
- #707
Category grades
Schools grade is shown separately in the Schools card above.
Census & demographics
- Census place
- Charlottesville, VA
- County
- Albemarle County · 129,350 people
- City population
- 120,202
- Metro
- Charlottesville, VA
- Population (ZIP)
- 40,372
- Household income
- $69,340
- Rent vs Own
- Severe rent burden
- 3060.0
Population outlook (Charlottesville County) Hauer SSP2
- Today (2025)
- 53,816 people
- By 2030
- 57,857 · +7.5%
- By 2040
- 63,933 · +18.8%
- By 2050
- 69,676 · +29.5%
- By 2075
- 77,018 · +43.1%
- By 2100
- 82,078 · +52.5%
Race, ethnicity, and origin ACS 2023
- Neighborhood character
- Majority White (65%)
- Race & ethnicity
- White 65% Black 15% Asian 9% Hispanic / Latino 7% Two or more races 7%
- Hispanic origin (detail)
- Mexican 2%
- Common ancestry
- Romanian 3% Italian 2% Slovak 2%
- Foreign-born
- 13% · Canada, China, South Korea
- Languages at home
- 83% English-only · Spanish 4% Other Indo-European 3% Chinese 3%
Political lean MEDSL · Charlottesville
- 2024 margin
- Solid D (+68.7) · D 83.4% · R 14.7% · Other 1.9%
- 2008→2024 swing
- +10.7pp toward D · 2008: 58.0pp · 2024: 68.7pp
- All cycles
- 2024: D+68.7 2020: D+72.7 2016: D+67.1 2012: D+53.4 2008: D+58.0
Not yet ingested
- Civics
- —
Market trends
- HPI YoY
- ▼ -448.28%
- Current HPI
- 306.8503
- Rent YoY
- ▲ 4.49%
- Metro
- Charlottesville, VA
- State GDP YoY
- ▲ 2.40%
- F500 in state
- 50
Industry mix (Fortune 500 HQ in VA)
| Industry | F500 HQs | Revenue |
|---|---|---|
| Aerospace / Defense | 4 | $236B |
|
||
| Technology / Defense | 3 | $32B |
|
||
| Financial Services | 2 | $176B |
|
||
| Utilities | 2 | $27B |
|
||
| Insurance | 2 | $25B |
|
||
| Technology | 2 | $15B |
|
||
Price history
-5.3% since first listed4 events — show timeline
- 2026-05-14 Price Changed $530,000 CAAR
- 2026-04-30 Relisted — CAAR
- 2026-04-30 Listing Removed — CAAR
- 2026-04-26 Listed $559,900 CAAR
Property tax history
+8.2%/yrLatest (2026): $5,259 · +19.2% YoY. Source: county tax records.
Cash-flow waterfall
monthlySold comps — $/sqft
last 12 mo · ≤1 miLoading sold comps…