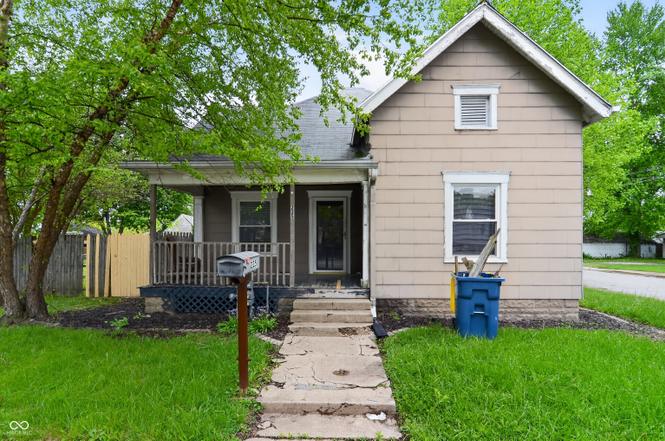
225 S State St · Greenfield, IN
Flood risk 1/10 · Minimal
- FEMA flood zone
- X (unshaded)
- Chance of flooding over 30 yrs
- 0.0%
- Est. flood insurance / yr
- $507 – $1,088
Fire risk 1/10 · Minimal
- Est. fire insurance / yr
- $717 – $1,331
Heat risk 3/10 · Minor
- Hot days now (above 102°F)
- 7 days/yr
- Hot days in 30 yrs
- 18 days/yr
Wind risk 2/10 · Minimal
- Chance of severe wind over 30 yrs
- 1.0%
Air-quality risk 2/10 · Minimal
- Unhealthy air days now
- 1 days/yr
- Unhealthy air days in 30 yrs
- 2 days/yr
Risk factors via First Street. Map © Google.
Why this score? — see what drove the D+ grade
The composite is a weighted blend of 9 inputs, each scored 0–100. Each bar is that input's sub-score; the figure is the points it added to the 100-point composite (weight × sub-score).
- Cash flow +14.9/30.0
- ARV discount +10.1/15.0
- DSCR +4.5/10.0
- Schools +4.0/10.0
- 1% rule +3.7/10.0
- Livability +3.7/5.0
- Rent growth +3.2/5.0
- Condition / age +2.5/5.0
- Appreciation +0.0/10.0
$159,900
🖨 Deal sheet (PDF) 📄 Offer letter ✓ Due diligence
Listing remarks MLS
Don’t let the outside deceive you. You’ll be surprised of some of the interior updates, nice Kitchen, Quaint dining room, cozy living room situated on cornet lot with 1 Car Detached garage
Key facts
- Functional kitchen
- Wainscot wall
- Private yard
Tags
Property features AI
Exterior
- Parking: Detached garage (1 car, ~324 sqft)
- Security: Carbon monoxide detector(s); Smoke detector(s); Smoke alarm
- Utilities: Public water; Municipal sewer connected; Natural gas connected; Cable available; Solid waste service available
- Home design: Single family residence; One story; Residential property
- Construction: Stone construction; Slab foundation
- Exterior features: Covered patio; Patio; Sidewalks; Mature trees; Has a view
Interior
- Kitchen: Microwave; Refrigerator; Breakfast bar
- Bedrooms: 2 bedrooms (both on main level)
- Bathrooms: 1 full bathroom (main level)
- Heating & cooling: Forced air heating (natural gas); Central air conditioning
- Interior features: Attic access; Breakfast bar; Walk-in closet(s); Living room fireplace; Smoke alarm; Carbon monoxide detector(s); Smoke detector(s)
- Laundry & utility: Main level laundry
Neighborhood map
What this means for you Summary
Snapshot
- This is a 2-bed/1.0-bath single-family listed at $160k.
Deal economics
- At list price, monthly cash flow is $46 ($552/yr) — positive.
- The deal already cash-flows at list — no discount required.
- To meet the 1% rule (rent ≥ 1% of price), the offer needs to be $140k (12.5% below list).
- Recommended offer: $140k (12.5% below list) — sets the bar for 1% rule.
- Cap rate 6.6% vs local median 4.7% in Greenfield — top-decile yield for the area; either an underpriced asset or a hidden risk that comps aren't pricing in. Stress-test before assuming the spread holds.
Location & tenants
- Location reads 73/100 on livability (#88 in IN) — a middle-class / working-renter tenant base. Strengths: cost of living A+, housing A+; Watch: amenities F, commute F.
- Greenfield-Central Community Schools (other): math 47% / reading 45% proficiency, ranked #83 of 301 in IN (top 28%) — families likely to look elsewhere, expect single-tenant / working-renter base with shorter leases.
- Zoned schools: Weston Elementary School (math 57% / reading 32%, grade F, #379 of 994 statewide, top 41%, 327 students, 44% FRL); Greenfield-Central High School (math 37% / reading 65%, grade D+, #115 of 369 statewide, top 31%, 1,462 students, 35% FRL).
- Market conditions: Rents rising (+2.9%/yr); 481 active listings in the ZIP; 5 comparable units currently listed for rent nearby; rentals leasing fast (median 5d on market — plan ~1-2 weeks tenant-placement turnaround); solid renter incomes; 1,091 units permitted in Hancock County in 2024 (0 in 5+ unit buildings).
Forward outlook
- Local home prices are declining (-3.0%/yr); year-one equity from $1k of loan paydown is wiped out by about $5k of value loss. Plan a longer hold.
- Hancock County population projected at +7% by 2050 — modest demand growth; plan on rents tracking national, not racing it.
Negotiation context
- Only 3 days on market — expect competitive offers; lowballing is unlikely to land.
- 6 sale attempts since 22y ago with the ask held roughly flat each time — persistent listings suggest the price (not the market) is what's stuck; bring a comps-based counter.
- Current owner paid $48k; list at $160k implies a 233% gain — meaningful room to come down on a strong offer.
Risks & watch-outs
- Watch-outs: built in 1900 — expect roof / HVAC / electrical / plumbing capex.
Questions for the listing agent
- Built in 1900 — when were the roof, HVAC, electrical panel, plumbing, and water heater last replaced?
- Is there a deadline driving the sale (1031 exchange, divorce, estate, relocation)? That informs how much negotiation room exists.
- Schools are B-rated — typically a magnet for longer-tenancy family renters. What's the average tenant stay here, and is there a school-zone premium baked into asking?
- The area grade is low — what's the realistic commute time and amenity access for the typical tenant pool here? Any planned neighborhood developments (good or bad) we should know about?
- What's the average days-on-market for RENTAL listings here right now (not sales)? A rising rental-DOM trend means longer vacancies and softer asking-rent achievability than the comps imply.
- What's the recent tenant-quality profile in this submarket — average credit score on applications, eviction rate, late-payment / NSF rate, and stable-employment percentage? A property-management company in the area should have these aggregated.
- How much new for-sale + rental construction is in the pipeline within 1–3 miles? Heavy new supply typically softens prices + rents 12–24 months out; constrained supply supports both.
Investment metrics
- 1% rule
- 0.87% ✗
- Cap rate
- 6.64%
- Cash-on-cash
- 1.23%
- DSCR
- 1.05
- GRM
- 9.5
CMA / ARV
- ARV (on-the-fly)
- $169,576
- Comps found
- 12
Show comp detail 12 sales within ~0.75 mi
| Address | Dist | Beds/Ba | Sqft | Sold | Price | $/sf | Match |
|---|---|---|---|---|---|---|---|
| 216 W South St | 0.22mi | 2/1.0 | 887 (-2%) | 2mo | $126,000 | $142 | 86 |
| 425 S Pennsylvania St | 0.17mi | 2/1.0 | 869 (-4%) | 3mo | $75,000 | $86 | 84 |
| 111 Tague St | 0.24mi | 2/1.0 | 912 (+1%) | 7mo | $170,000 | $186 | 81 |
| 514 Riley Ave | 0.29mi | 2/1.0 | 925 (+2%) | 8mo | $159,000 | $172 | 76 |
| 718 S State St | 0.39mi | 3/1.0 (+1) | 864 (-4%) | 1mo | $184,000 | $213 | 69 |
| 115 N Spring St | 0.32mi | 2/1.0 | 950 (+5%) | 13mo | $187,000 | $197 | 65 |
| 131 Howard St | 0.59mi | 2/1.0 | 864 (-4%) | 3mo | $162,000 | $188 | 63 |
| 318 Tague St | 0.34mi | 3/1.0 (+1) | 864 (-4%) | 14mo | $150,000 | $174 | 61 |
| 508 Mount St | 0.17mi | 3/1.0 (+1) | 990 (+10%) | 12mo | $195,000 | $197 | 60 |
| 509 W Pierson St | 0.46mi | 3/1.0 (+1) | 864 (-4%) | 13mo | $185,000 | $214 | 55 |
| 506 Tague St | 0.48mi | 2/1.0 | 984 (+9%) | 15mo | $182,500 | $185 | 50 |
| 852 Walnut St | 0.71mi | 3/1.5 (+1) | 960 (+6%) | 12mo | $190,000 | $198 | 39 |
Match score weights: distance 35% · size 25% · config 20% · recency 20%. Top-matched comps best support the ARV.
Projected returns pro-forma
-3.0% appreciation · 2.88% rent growth · sell at horizon
- IRR
- -14.5%
- Equity multiple
- 0.48×
- Total profit
- $-23,159
- Equity at exit
- $23,842
- IRR
- -6.0%
- Equity multiple
- 0.62×
- Total profit
- $-17,117
- Equity at exit
- $13,825
Cash invested: $44,772 (down + closing). Projections, not guarantees.
Landlord ↔ Tenant lean methodology
- Overall (STATE)
- 90 Strongly Landlord-Friendly
- State Indiana
- 90 Strongly Landlord-Friendly · R+11
- County
- — inherits STATE
- City
- — inherits STATE
ZIP-level market 46140
- Rents YoY
- 2.9%
- Active inventory
- 481
- Price-to-rent
- 9.5×
Monthly cashflow live
- Estimated rent
- $1,399 high interval (Pro) →
- Mortgage (P&I)
- −$839
- Tax from tax record
- −$154 /mo · $1,846/yr
- Insurance
- −$67
- HOA
- −$0
- Vacancy / Maint / Mgmt
- −$294
- Net cashflow
- $46
Break-even live
Sensitivity live
| Price | -10% $136 | -5% $91 | +0% $46 | +5% $1 | +10% $-45 |
|---|---|---|---|---|---|
| Rent | -10% $-65 | -5% $-9 | +0% $46 | +5% $101 | +10% $156 |
| Rate | -1.0pp $126 | -0.5pp $87 | base $46 | +0.5pp $5 | +1.0pp $-38 |
UW: 25.0% down · 7.5% · 30yr · 1.5% tax · 5.0% vac · 8.0% maint · 8.0% mgmt
Financing live
Cash to close
- Down payment
- $39,975
- Closing costs
- $4,797
- Reserves months
- —
- Total cash needed
- —
Loan-product check · same deal, 3 products live
Conventional
25% down · 7.5% · 30yr
- Down + closing
- —
- Monthly P&I
- —
- Monthly cashflow
- —
- DSCR
- —
- Eligible?
- —
Personal DTI + credit; lowest rate.
DSCR
20% down · 8.5% · 30yr
- Down + closing
- —
- Monthly P&I
- —
- Monthly cashflow
- —
- DSCR
- —
- Eligible?
- —
No personal income docs; deal must DSCR.
Hard money
10% down · 12.0% · 12mo
- Down + closing
- —
- Monthly P&I
- —
- Monthly cashflow
- —
- DSCR
- —
- Eligible?
- —
Short-term bridge; refi at stabilization.
Rent comps 5 comps
| Address | Beds | Baths | Sqft | Rent | $/sqft | DOM | Units | Dist |
|---|---|---|---|---|---|---|---|---|
| 22 Wilson St Greenfield, IN | 2.0 | 1.0 | 600 | $925 | $1.54 | 13d | 1 | 0.50mi |
| 220 Walker St Greenfield, IN | 3.0 | 1.0 | 1101 | $1,400 | $1.27 | 5d | 1 | 0.58mi |
| 432 Baldwin St Greenfield, IN | 2.0 | 1.0 | 788 | $1,425 | $1.81 | 24d | 1 | 0.62mi |
| 210 Flagstone Dr Greenfield, IN | 1.0–3.0 | 1.0–2.5 | 1084 | $1,718 | $1.58 | 2d | 17 | 1.11mi |
| 917 E McKenzie Rd Greenfield, IN | 1.0–2.0 | 1.0–1.5 | 918 | $1,199 | $1.31 | 2d | 4 | 1.31mi |
Listing history 3 events
-
2026-06-21days on market $159,900 Active 3 DOM
-
2026-06-19remarks 699-char remark
-
2026-06-19$159,900 Active 1 DOM
ⓘ Source: listings_history table (triggers on properties + properties_extension) + one-shot
backfill from property_details.listing_events for pre-trigger history.
Tax reassessment forecast IN · Partial reset (capped growth)
- Current annual tax
- $1,846 · $154/mo
- Projected year-2 tax
- $1,846 · $154/mo
- Expected delta
- $0/yr ($0/mo · 0.0%)
ⓘ Screening estimate from a state-policy table — verify with the county assessor before closing.
Climate risk First Street
- Flood 1/10 Low FEMA zone X (unshaded) · 0% chance over 30 yrs
- Wildfire 1/10 Low
- Heat 3/10 Moderate 7 d/yr ≥102°F today · 18 d/yr by 30 yrs out
- Wind 2/10 Low 100% chance of damaging wind over 30 yrs
- Air quality 2/10 Low 1 unhealthy d/yr today · 2 by 30 yrs out
Nearby sold comps map
Loading sold comps map…
Walkable amenities ~0.75 mi
Loading nearby amenities…
Taxation est. · year 1
- Rental income
- $16,783
- − Mortgage interest
- −$8,957
- − Property taxes
- −$1,846
- − Insurance
- −$800
- − Repairs & maintenance
- −$1,343
- − Management
- −$1,343
- − Depreciation
- −$4,652
- Taxable loss
- −$2,155
- Est. tax savings @ 24.0%
- +$517
- After-tax cash flow
- $1,069/yr
For passive investors: Depreciation is non-cash, so a rental often shows a tax loss while cash-flowing — sheltering income. Rental losses are passive: they offset passive income freely, and up to $25,000/yr can offset ordinary (W-2) income if you actively participate and your MAGI is under $100k (phasing out to $0 by $150k); unused losses carry forward. On sale, claimed depreciation is recaptured at up to 25%, and gains may owe capital-gains tax (a 1031 exchange can defer both). Figures are a year-1 estimate at your 24.0% rate — not tax advice; consult a CPA.
Schools (NCES district)
- District
- Greenfield-Central Community Schools
- NCES district ID
- 1804050
- Math proficiency
- 47% ▼ -12.00%
- Reading proficiency
- 45% ▼ -11.00%
- Median HH income
- $55,533
- Composite
- 40.01/100
- National rank
- #3827
- State rank
- #83 of 301 in IN
Livability — Greenfield
- Score
- 73/100
- State rank
- #88
- US rank
- #5094
Category grades
Schools grade is shown separately in the Schools card above.
Census & demographics
- Census place
- Greenfield, IN
- County
- Hancock County · 59,521 people
- City population
- 43,511
- Metro
- Indianapolis-Carmel-Anderson, IN
- Population (ZIP)
- 43,511
- Household income
- $83,056
- Rent vs Own
- Severe rent burden
- 795.0
Population outlook (Hancock County) Hauer SSP2
- Today (2025)
- 77,820 people
- By 2030
- 79,914 · +2.7%
- By 2040
- 82,734 · +6.3%
- By 2050
- 83,348 · +7.1%
- By 2075
- 82,439 · +5.9%
- By 2100
- 74,181 · -4.7%
Race, ethnicity, and origin ACS 2023
- Neighborhood character
- Predominantly White (92%)
- Race & ethnicity
- White 92% Two or more races 5% Hispanic / Latino 3% Black 1%
- Common ancestry
- Italian 3% Lithuanian 3% Slovak 1%
- Foreign-born
- 3% · Canada
- Languages at home
- 96% English-only · Spanish 2% Other Indo-European 1%
Political lean MEDSL · Hancock
- 2024 margin
- Solid R (+33.7) · D 32.2% · R 65.9% · Other 1.9%
- 2008→2024 swing
- -4.1pp toward R · 2008: -29.6pp · 2024: -33.7pp
- All cycles
- 2024: R+33.7 2020: R+37.5 2016: R+44.8 2012: R+41.0 2008: R+29.6
Not yet ingested
- Civics
- —
Market trends
- HPI YoY
- ▼ -131.67%
- Current HPI
- 225.0367
- Rent YoY
- ▲ 2.88%
- Metro
- Indianapolis-Carmel-Anderson, IN
- State GDP YoY
- ▲ 2.90%
- F500 in state
- 18
Industry mix (Fortune 500 HQ in IN)
| Industry | F500 HQs | Revenue |
|---|---|---|
| Industrial Machinery | 2 | $37B |
|
||
| Healthcare | 1 | $177B |
|
||
| Pharmaceuticals | 1 | $45B |
|
||
| Metals / Steel | 1 | $18B |
|
||
| Agriculture | 1 | $17B |
|
||
| Packaging | 1 | $12B |
|
||
Price history
+77.9% since first listed13 events — show timeline
- 2026-06-18 Listed $159,900 MIBOR as Distributed by MLS Grid
- 2017-09-21 Sold (MLS) $48,000 MIBOR as Distributed by MLS Grid
- 2017-09-08 Pending — MIBOR as Distributed by MLS Grid
- 2017-08-31 Contingent — MIBOR as Distributed by MLS Grid
- 2017-08-04 Listed $49,900 MIBOR as Distributed by MLS Grid
- 2017-01-21 Listing Removed — MIBOR as Distributed by MLS Grid
- 2016-07-21 Listed $67,600 MIBOR as Distributed by MLS Grid
- 2016-05-20 Listing Removed — MIBOR as Distributed by MLS Grid
- 2015-11-23 Listed $72,000 MIBOR as Distributed by MLS Grid
- 2010-08-25 Listing Removed — MIBOR as Distributed by MLS Grid
- 2009-09-29 Listed $74,900 MIBOR as Distributed by MLS Grid
- 2004-10-19 Listing Removed — MIBOR as Distributed by MLS Grid
- 2004-04-20 Listed $89,900 MIBOR as Distributed by MLS Grid
Property tax history
+14.0%/yrLatest (2025): $1,846 · -2.4% YoY. Source: county tax records.
Cash-flow waterfall
monthlySold comps — $/sqft
last 12 mo · ≤1 miLoading sold comps…