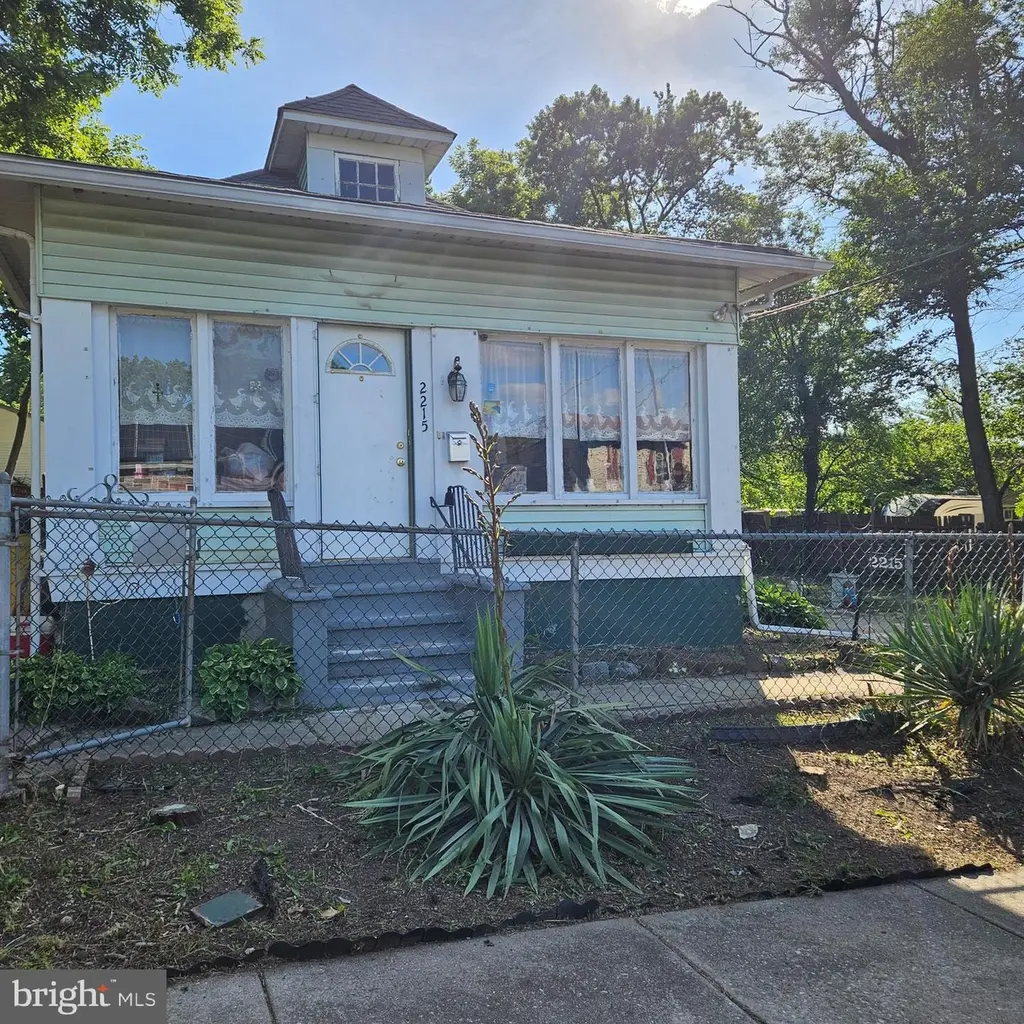
2215 37th St · Camden, NJ
Flood risk No data
- FEMA flood zone
- —
- Chance of flooding over 30 yrs
- —
- Est. flood insurance / yr
- —
Fire risk No data
- Est. fire insurance / yr
- —
Heat risk No data
- Hot days now (above threshold)
- —
- Hot days in 30 yrs
- —
Wind risk No data
- Chance of severe wind over 30 yrs
- —
Air-quality risk No data
- Unhealthy air days now
- —
- Unhealthy air days in 30 yrs
- —
Risk factors via First Street. Map © Google.
Why this score? — see what drove the C grade
The composite is a weighted blend of 9 inputs, each scored 0–100. Each bar is that input's sub-score; the figure is the points it added to the 100-point composite (weight × sub-score).
- Cash flow +20.6/30.0
- ARV discount +15.0/15.0
- 1% rule +6.8/10.0
- DSCR +6.5/10.0
- Livability +3.5/5.0
- Rent growth +2.5/5.0
- Condition / age +2.5/5.0
- Schools +2.0/10.0
- Appreciation +0.0/10.0
$170,000
🖨 Deal sheet 📄 Offer letter ✓ Due diligence
Key facts
- 8,002 sq ft lot
- 2 parking spots
- Built 1938
Property features AI
Finance
- Other: Ownership: Fee simple
Exterior
- Parking: Driveway parking for 2 cars; On-street parking; Total of 2 garage/parking spaces
- Utilities: Public water; Public sewer; Electric hot water; Natural gas available for heating
- Home design: Detached single-family home; Frame construction
- Construction: Frame construction; Other foundation; Other above- and below-grade structures
- Exterior features: Lot dimensions approximately 80 x 100; No tidal water
Interior
- Kitchen: Standard kitchen (appliances not specified)
- Bedrooms: Two main-level bedrooms
- Bathrooms: One full bathroom (main level)
- Heating & cooling: Heating: Other system using natural gas; Cooling: Window unit(s)
- Interior features: Partial, unfinished basement; Dining room; Kitchen
- Laundry & utility: Hot water: Electric
Neighborhood map
What this means for you Summary
Snapshot
- This is a 2-bed/1.0-bath single-family listed at $170k.
Deal economics
- At list price, monthly cash flow is $226 ($3k/yr) — positive.
- The deal already cash-flows at list — no discount required.
- Meets the 1% rule at list price ($2k rent vs $170k).
Location & tenants
- Location reads 70/100 on livability (#262 in NJ) — a middle-class / working-renter tenant base. Strengths: amenities A+, commute A+, cost of living A; Watch: schools F, crime F, employment F.
- Pennsauken Township Board Of Education School District (suburban): math 12% / reading 32% proficiency, ranked #410 of 472 in NJ (top 87%) — low school quality limits family demand, transient renter base, plan for 1-2y turnover.
- Market conditions: 59 active listings in the ZIP; 7 comparable units currently listed for rent nearby; rentals at typical pace (median 24d on market — plan ~3-4 weeks tenant-placement turnaround); solid renter incomes; 1,018 units permitted in Camden County in 2024 (509 in 5+ unit buildings).
Forward outlook
- Local home prices are declining (-3.0%/yr); year-one equity from $1k of loan paydown is wiped out by about $5k of value loss. Plan a longer hold.
- Camden County population projected to shrink 8% by 2050 — rents likely to lag national; underwrite the cash flow, not the appreciation.
Negotiation context
- Only 7 days on market — expect competitive offers; lowballing is unlikely to land.
- Current owner paid $6k; list at $170k implies a 2991% gain — meaningful room to come down on a strong offer.
Risks & watch-outs
- Watch-outs: property tax is 2.8% of price; built in 1938 — expect roof / HVAC / electrical / plumbing capex.
Questions for the listing agent
- Built in 1938 — when were the roof, HVAC, electrical panel, plumbing, and water heater last replaced?
- Property tax is high relative to price — has the assessment been appealed recently, and will the sale trigger a re-assessment?
- Is there a deadline driving the sale (1031 exchange, divorce, estate, relocation)? That informs how much negotiation room exists.
- Schools are F-rated, which usually means shorter tenancies and higher turnover. Who's the typical renter profile here, and what's been the actual vacancy rate?
- Crime grade is F in this area — have there been break-ins, vandalism, or insurance claims at this property in the last 3 years? What carrier currently insures it and at what premium?
- What's the average days-on-market for RENTAL listings here right now (not sales)? A rising rental-DOM trend means longer vacancies and softer asking-rent achievability than the comps imply.
- What's the recent tenant-quality profile in this submarket — average credit score on applications, eviction rate, late-payment / NSF rate, and stable-employment percentage? A property-management company in the area should have these aggregated.
- How much new for-sale + rental construction is in the pipeline within 1–3 miles? Heavy new supply typically softens prices + rents 12–24 months out; constrained supply supports both.
Investment metrics
- 1% rule
- 1.18% ✓
- Cap rate
- 7.89%
- Cash-on-cash
- 5.70%
- DSCR
- 1.25
- GRM
- 7.0
CMA / ARV
- ARV (on-the-fly)
- $220,720
- Comps found
- 6
Show comp detail 6 sales within ~0.75 mi
| Address | Dist | Beds/Ba | Sqft | Sold | Price | $/sf | Match |
|---|---|---|---|---|---|---|---|
| 438 N 36th St | 0.30mi | 2/1.0 | 842 (-5%) | 13mo | $178,000 | $211 | 66 |
| 370 N 34th St | 0.26mi | 3/2.0 (+1) | 986 (+11%) | 1mo | $270,000 | $274 | 60 |
| 1801 48th St | 0.72mi | 3/1.0 (+1) | 880 (-1%) | 21mo | $250,000 | $284 | 42 |
| 4742 Browning Rd | 0.75mi | 2/1.0 | 1,010 (+14%) | 1mo | $250,000 | $248 | 42 |
| 4749 Poplar Ave | 0.68mi | 3/1.0 (+1) | 996 (+12%) | 5mo | $215,000 | $216 | 39 |
| 251 S 32nd St | 0.51mi | 3/1.0 (+1) | 986 (+11%) | 17mo | $209,000 | $212 | 39 |
Match score weights: distance 35% · size 25% · config 20% · recency 20%. Top-matched comps best support the ARV.
Projected returns pro-forma
-3.0% appreciation · 3.0% rent growth · sell at horizon
- IRR
- -7.4%
- Equity multiple
- 0.73×
- Total profit
- $-12,990
- Equity at exit
- $25,348
- IRR
- 2.3%
- Equity multiple
- 1.16×
- Total profit
- $7,841
- Equity at exit
- $14,698
Cash invested: $47,600 (down + closing). Projections, not guarantees.
Landlord ↔ Tenant lean methodology
- Overall (STATE)
- 21 Tenant-Leaning
- State New Jersey
- 21 Tenant-Leaning · D+6
- County
- — inherits STATE
- City
- — inherits STATE
ZIP-level market 08110
- Home prices YoY
- -10.9%
- Active inventory
- 59
- Price-to-rent
- 7.0×
Monthly cashflow live
- Estimated rent
- $2,014 high interval (Pro) →
- Mortgage (P&I)
- −$891
- Tax from tax record
- −$403 /mo · $4,833/yr
- Insurance
- −$71
- HOA
- −$0
- Vacancy / Maint / Mgmt
- −$423
- Net cashflow
- $226
Break-even live
UW: 25.0% down · 7.5% · 30yr · 1.5% tax · 5.0% vac · 8.0% maint · 8.0% mgmt
Financing live
Cash to close
- Down payment
- $42,500
- Closing costs
- $5,100
- Reserves months
- —
- Total cash needed
- —
Loan-product check · same deal, 3 products live
Conventional
25% down · 7.5% · 30yr
- Down + closing
- —
- Monthly P&I
- —
- Monthly cashflow
- —
- DSCR
- —
- Eligible?
- —
Personal DTI + credit; lowest rate.
DSCR
20% down · 8.5% · 30yr
- Down + closing
- —
- Monthly P&I
- —
- Monthly cashflow
- —
- DSCR
- —
- Eligible?
- —
No personal income docs; deal must DSCR.
Hard money
10% down · 12.0% · 12mo
- Down + closing
- —
- Monthly P&I
- —
- Monthly cashflow
- —
- DSCR
- —
- Eligible?
- —
Short-term bridge; refi at stabilization.
Rent comps 7 comps
| Address | Beds | Baths | Sqft | Rent | $/sqft | DOM | Units | Dist |
|---|---|---|---|---|---|---|---|---|
| 106 N 34th St Unit B Camden, NJ | 3.0 | 2.0 | 900 | $1,950 | $2.17 | 24d | 1 | 0.10mi |
| 4601 High St Pennsauken, NJ | 1.0–2.0 | 1.0 | 800 | $1,675 | $2.09 | 3d | 4 | 0.58mi |
| 219 S 29th St Camden, NJ | 2.0 | 1.0 | 625 | $1,250 | $2.00 | 12d | 4 | 0.68mi |
| 2323 Browning Rd Pennsauken, NJ | 3.0 | 1.0 | 923 | $2,500 | $2.71 | 24d | 1 | 0.70mi |
| 4137 Marlton Pike Pennsauken Township, NJ | 2.0 | 1.0 | 900 | $1,800 | $2.00 | 24d | 1 | 1.00mi |
| 42 W Maple Ave Merchantville, NJ | 1.0 | 1.0 | 654 | $1,675 | $2.56 | 24d | 1 | 1.15mi |
| 6366 Rogers Ave Unit 3 Pennsauken Township, NJ | 3.0 | 1.0 | 1100 | $2,100 | $1.91 | 24d | 1 | 1.32mi |
Listing history 7 events
-
2026-06-13status $170,000 Pending 7 DOM
-
2026-06-10status $170,000 Active Under Contract 7 DOM
-
2026-06-09days on market $170,000 Active 7 DOM
-
2026-06-08days on market $170,000 Active 6 DOM
-
2026-06-07days on market $170,000 Active 5 DOM
-
2026-06-04days on market $170,000 Active 2 DOM
-
2026-06-02$170,000 Active 1 DOM
ⓘ Source: listings_history table (triggers on properties + properties_extension) + one-shot
backfill from property_details.listing_events for pre-trigger history.
Tax reassessment forecast NJ · Partial reset (capped growth)
- Current annual tax
- $4,833 · $403/mo
- Projected year-2 tax
- $4,833 · $403/mo
- Expected delta
- $0/yr ($0/mo · 0.0%)
ⓘ Screening estimate from a state-policy table — verify with the county assessor before closing.
Nearby sold comps map
Loading sold comps map…
Walkable amenities ~0.75 mi
Loading nearby amenities…
Taxation est. · year 1
- Rental income
- $24,171
- − Mortgage interest
- −$9,523
- − Property taxes
- −$4,833
- − Insurance
- −$850
- − Repairs & maintenance
- −$1,934
- − Management
- −$1,934
- − Depreciation
- −$4,945
- Taxable income
- $153
- Est. tax owed @ 24.0%
- −$37
- After-tax cash flow
- $2,678/yr
For passive investors: Depreciation is non-cash, so a rental often shows a tax loss while cash-flowing — sheltering income. Rental losses are passive: they offset passive income freely, and up to $25,000/yr can offset ordinary (W-2) income if you actively participate and your MAGI is under $100k (phasing out to $0 by $150k); unused losses carry forward. On sale, claimed depreciation is recaptured at up to 25%, and gains may owe capital-gains tax (a 1031 exchange can defer both). Figures are a year-1 estimate at your 24.0% rate — not tax advice; consult a CPA.
Schools (NCES district)
- District
- Pennsauken Township Board Of Education School District
- NCES district ID
- 3412870
- Math proficiency
- 12% ▼ -16.00%
- Reading proficiency
- 32% ▼ -3.00%
- Median HH income
- $60,336
- Composite
- 20.48/100
- National rank
- #8573
- State rank
- #410 of 472 in NJ
Livability — Camden
- Score
- 70/100
- State rank
- #262
- US rank
- #7721
Category grades
Schools grade is shown separately in the Schools card above.
Census & demographics
- County
- Camden County · 407,624 people
- City population
- 20,865
- Metro
- Philadelphia-Camden-Wilmington, PA-NJ-DE-MD
- Population (ZIP)
- 19,158
- Household income
- $83,729
- Rent vs Own
- Severe rent burden
- 404.0
Population outlook (Camden County) Hauer SSP2
- Today (2025)
- 507,964 people
- By 2030
- 502,182 · -1.1%
- By 2040
- 485,602 · -4.4%
- By 2050
- 465,630 · -8.3%
- By 2075
- 419,986 · -17.3%
- By 2100
- 369,492 · -27.3%
Race, ethnicity, and origin ACS 2023
- Neighborhood character
- Diverse neighborhood (Simpson 0.67)
- Race & ethnicity
- Hispanic / Latino 46% Black 30% White 14% Two or more races 13% Asian 7% Native American 2%
- Hispanic origin (detail)
- Mexican 5% Puerto Rican 17% Dominican 16%
- Common ancestry
- Romanian 2% Hispanic 1% Iranian 1%
- Foreign-born
- 28% · Canada, Vietnam, Jamaica
- Languages at home
- 52% English-only · Spanish 35% Vietnamese 4% French/Haitian/Cajun 1%
Political lean MEDSL · Camden
- 2024 margin
- Strong D (+27.4) · D 63.0% · R 35.5% · Other 1.5%
- 2008→2024 swing
- -8.8pp toward R · 2008: 36.2pp · 2024: 27.4pp
- All cycles
- 2024: D+27.4 2020: D+33.5 2016: D+32.4 2012: D+36.6 2008: D+36.2
Not yet ingested
- Civics
- —
Market trends
- HPI YoY
- ▼ -53.44%
- Current HPI
- 436.2879
- Rent YoY
- —
- Metro
- Philadelphia-Camden-Wilmington, PA-NJ-DE-MD
- State GDP YoY
- ▲ 2.05%
- F500 in state
- 34
Industry mix (Fortune 500 HQ in NJ)
| Industry | F500 HQs | Revenue |
|---|---|---|
| Consumer Goods | 3 | $31B |
|
||
| Pharmaceuticals | 2 | $153B |
|
||
| Technology | 2 | $21B |
|
||
| Insurance | 2 | $20B |
|
||
| Healthcare | 2 | $19B |
|
||
| Financial Services | 1 | $70B |
|
||
Price history
+2990.9% since first listed2 events — show timeline
- 2026-06-02 Listed $170,000 BRIGHT MLS
- 1991-06-21 Sold (Public Records) $5,500 Public Records
Property tax history
+2.2%/yrLatest (2025): $4,833 · +7.5% YoY. Source: county tax records.
Cash-flow waterfall
monthlySold comps — $/sqft
last 12 mo · ≤1 miLoading sold comps…