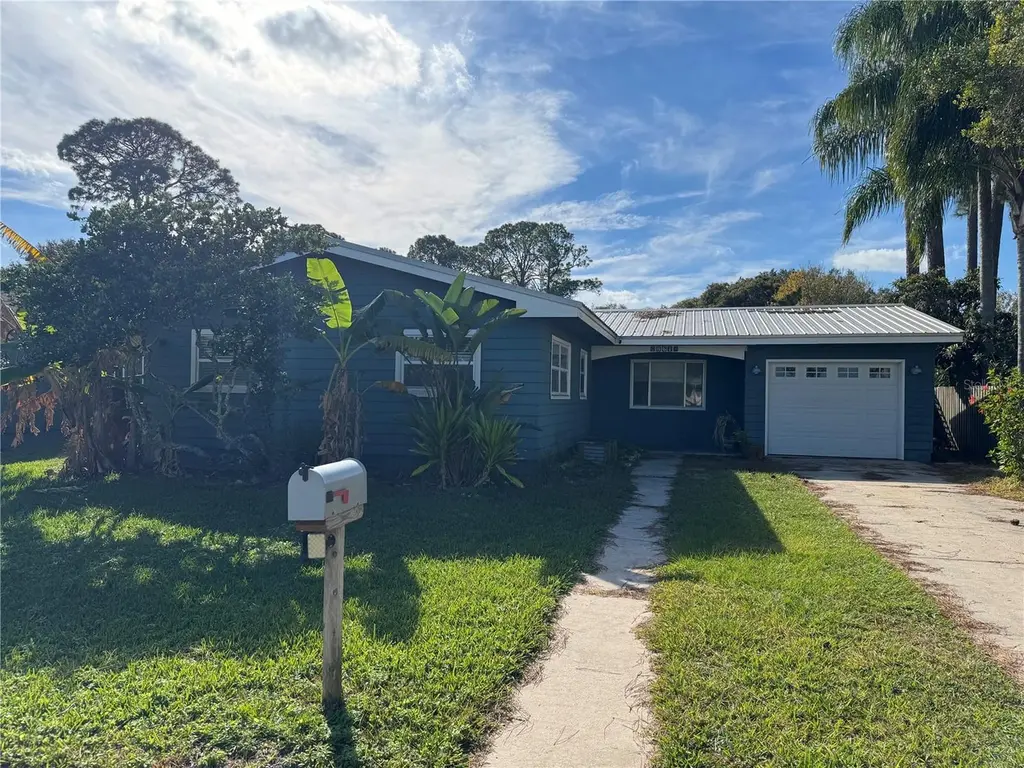
861 Palermo Rd · St. Augustine Shores, FL
Flood risk 6/10 · Moderate
- FEMA flood zone
- X (unshaded)
- Chance of flooding over 30 yrs
- 0.7%
- Est. flood insurance / yr
- $507 – $1,088
Fire risk 3/10 · Minor
- Est. fire insurance / yr
- $947 – $1,759
Heat risk 10/10 · Severe
- Hot days now (above 106°F)
- 7 days/yr
- Hot days in 30 yrs
- 21 days/yr
Wind risk 10/10 · Severe
- Chance of severe wind over 30 yrs
- 99.0%
Air-quality risk 3/10 · Minor
- Unhealthy air days now
- 3 days/yr
- Unhealthy air days in 30 yrs
- 3 days/yr
Risk factors via First Street. Map © Google.
Why this score? — see what drove the D grade
The composite is a weighted blend of 9 inputs, each scored 0–100. Each bar is that input's sub-score; the figure is the points it added to the 100-point composite (weight × sub-score).
- ARV discount +12.1/15.0
- Cash flow +10.1/30.0
- Schools +6.4/10.0
- 1% rule +2.9/10.0
- DSCR +2.9/10.0
- Rent growth +2.7/5.0
- Livability +2.5/5.0
- Condition / age +2.5/5.0
- Appreciation +0.0/10.0
$239,999
🖨 Deal sheet (PDF) 📄 Offer letter ✓ Due diligence
Listing remarks MLS
Short Sale. Short Sale Opportunity — Priced to Move! Calling all investors and value-seekers! This property at 861 Palermo Rd presents a rare chance to acquire a solid home in a desirable Saint Augustine neighborhood at an attractive price. Featuring an open living layout and a spacious lot, this home offers excellent potential for renovation, rental income, or resale. With strong demand in the area and limited inventory at this price point, the upside is tremendous. Bring your vision, add your updates, and unlock the full potential of this investment. Don’t miss out on this profitable short-sale opportunity! All offers are subject to bank approval.
Key facts
- Open living layout
- Spacious lot
- 6,534 sq ft lot
Tags
Neighborhood map
What this means for you Summary
Snapshot
- This is a 2-bed/2.0-bath single-family listed at $240k.
Deal economics
- At list price, monthly cash flow is $-143 ($-2k/yr) — negative.
- To cash-flow at today's rent, offer at most $215k (10.5% below list).
- To meet the 1% rule (rent ≥ 1% of price), the offer needs to be $191k (20.6% below list).
- Recommended offer: $191k (20.6% below list) — sets the bar for 1% rule.
- Cap rate 5.6% vs local median 3.4% in St. Augustine Shores — top-decile yield for the area; either an underpriced asset or a hidden risk that comps aren't pricing in. Stress-test before assuming the spread holds.
Location & tenants
- Location reads: area grade D — affects rentability + tenant quality, not the cash-flow math above.
- St. Johns (rural): math 75% / reading 73% proficiency, ranked #2 of 73 in FL (top 3%) — strong family-tenant draw, lease renewals of 3-5y typical; only 20% free/reduced lunch — higher-income household profile.
- Zoned schools: W. Douglas Hartley Elementary (math 79% / reading 74%, grade A, #185 of 2,144 statewide, top 9%, 633 students, 42% FRL); Gamble Rogers Middle School (math 61% / reading 55%, grade B, #151 of 571 statewide, top 27%, 925 students, 47% FRL); Pedro Menendez High School (math 31% / reading 54%, grade F, #264 of 667 statewide, top 41%, 1,519 students, 39% FRL) — zoned schools average 43% FRL vs 20% district-wide (23 pts higher); higher-poverty schools than district average — tighter screening recommended.
- Zoned-school proficiency averages 59% at this address vs 74% district-wide (-15 pts) — the specific schools serving this property underperform the St. Johns average; the district grade overstates school quality for this exact location.
- Market conditions: Rents flat; 407 active listings in the ZIP; 17 comparable units currently listed for rent nearby; rentals at typical pace (median 17d on market — plan ~3-4 weeks tenant-placement turnaround); solid renter incomes; 5,575 units permitted in St. Johns County in 2024 (584 in 5+ unit buildings).
Forward outlook
- Local home prices are declining (-3.0%/yr); year-one equity from $2k of loan paydown is wiped out by about $7k of value loss. Plan a longer hold.
- St. Johns County population projected at +60% by 2050 — long-run rental-demand tailwind backs the buy-and-hold thesis.
Negotiation context
- It's been on market 159 days — a 12% lower offer ($211k) is reasonable based on typical stale-listing flexibility.
- 3 sale attempts since 3y ago with the ask held roughly flat each time — persistent listings suggest the price (not the market) is what's stuck; bring a comps-based counter.
Risks & watch-outs
- Climate carrying-cost: major flood risk; severe wind risk, 99% chance of damaging wind over 30y; extreme-heat days projected 7→21/yr by 2055 (HVAC capex compounding) — expect insurance premiums to compound above CPI over the hold.
Questions for the listing agent
- What do current leases actually rent for vs. the listed asking? Can we see a recent rent roll and the last 12 months of T-12 income?
- It's been on market 159 days. Have you received any prior offers? Is the seller open to a 21% concession, seller financing, or rate buy-down credit?
- Built in 1973 — when were the roof, HVAC, electrical panel, plumbing, and water heater last replaced?
- What does the HOA fee cover, when was the last increase, and are there any pending special assessments or reserve-fund shortfalls?
- Why hasn't it sold? Are there any deal-killer items the seller is aware of (foundation, flood, title, zoning, code violations)?
- Is there a deadline driving the sale (1031 exchange, divorce, estate, relocation)? That informs how much negotiation room exists.
- The area grade is low — what's the realistic commute time and amenity access for the typical tenant pool here? Any planned neighborhood developments (good or bad) we should know about?
- What's the average days-on-market for RENTAL listings here right now (not sales)? A rising rental-DOM trend means longer vacancies and softer asking-rent achievability than the comps imply.
- What's the recent tenant-quality profile in this submarket — average credit score on applications, eviction rate, late-payment / NSF rate, and stable-employment percentage? A property-management company in the area should have these aggregated.
- How much new for-sale + rental construction is in the pipeline within 1–3 miles? Heavy new supply typically softens prices + rents 12–24 months out; constrained supply supports both.
Investment metrics
- 1% rule
- 0.79% ✗
- Cap rate
- 5.58%
- Cash-on-cash
- -2.55%
- DSCR
- 0.89
- GRM
- 10.5
CMA / ARV
- ARV (median comp)
- $267,101
- List price
- $239,999
- Delta
- -10.15%
- Verdict
- UNDERPRICED
- Comps
- 20 within 1.0 mi
Show comp detail 12 sales within ~0.75 mi
| Address | Dist | Beds/Ba | Sqft | Sold | Price | $/sf | Match |
|---|---|---|---|---|---|---|---|
| 200 Cecilia Ct | 0.33mi | 2/2.0 | 1,128 (0%) | 1mo | $279,000 | $247 | 84 |
| 165 Toledo St | 0.34mi | 2/2.0 | 1,128 (0%) | 3mo | $175,000 | $155 | 81 |
| 59 Deltona Blvd | 0.25mi | 2/2.0 | 1,066 (-6%) | 2mo | $239,900 | $225 | 78 |
| 56 Deltona Blvd | 0.28mi | 2/2.0 | 1,075 (-5%) | 6mo | $249,250 | $232 | 74 |
| 72 Deltona Blvd | 0.28mi | 2/1.0 | 1,014 (-10%) | 1mo | $265,000 | $261 | 66 |
| 196 Phoenetia Dr | 0.31mi | 2/2.0 | 1,008 (-11%) | 3mo | $225,000 | $223 | 65 |
| 258 Costado St | 0.65mi | 2/1.5 | 1,108 (-2%) | 3mo | $275,000 | $248 | 63 |
| 200 Laguna Ct | 0.54mi | 2/2.0 | 1,212 (+7%) | 0mo | $307,500 | $254 | 62 |
| 124 Captains Point Cir | 0.64mi | 3/2.0 (+1) | 1,140 (+1%) | 4mo | $290,000 | $254 | 60 |
| 281 Rosario St | 0.60mi | 2/2.0 | 1,237 (+10%) | 3mo | $315,500 | $255 | 53 |
| 991 Dorado Dr | 0.74mi | 2/2.0 | 1,212 (+7%) | 0mo | $275,000 | $227 | 53 |
| 209 Laguna Ct | 0.50mi | 3/2.0 (+1) | 1,232 (+9%) | 6mo | $318,000 | $258 | 51 |
Match score weights: distance 35% · size 25% · config 20% · recency 20%. Top-matched comps best support the ARV.
Projected returns pro-forma
-3.0% appreciation · 0.85% rent growth · sell at horizon
- IRR
- -22.9%
- Equity multiple
- 0.23×
- Total profit
- $-51,983
- Equity at exit
- $35,785
- IRR
- -24.1%
- Equity multiple
- -0.08×
- Total profit
- $-72,733
- Equity at exit
- $20,751
Cash invested: $67,200 (down + closing). Projections, not guarantees.
Landlord ↔ Tenant lean methodology
- Overall (STATE)
- 87 Strongly Landlord-Friendly
- State Florida
- 87 Strongly Landlord-Friendly · R+3
- County
- — inherits STATE
- City
- — inherits STATE
ZIP-level market 32086
- Rents YoY
- 0.8%
- Active inventory
- 407
- Price-to-rent
- 10.5×
Monthly cashflow live
- Estimated rent
- $1,907 high interval (Pro) →
- Mortgage (P&I)
- −$1,259
- Tax from tax record
- −$257 /mo · $3,087/yr
- Insurance
- −$100
- HOA
- −$33
- Vacancy / Maint / Mgmt
- −$400
- Net cashflow
- $-143
Break-even live
Sensitivity live
| Price | -10% $-7 | -5% $-75 | +0% $-143 | +5% $-210 | +10% $-278 |
|---|---|---|---|---|---|
| Rent | -10% $-293 | -5% $-218 | +0% $-143 | +5% $-67 | +10% $8 |
| Rate | -1.0pp $-22 | -0.5pp $-81 | base $-143 | +0.5pp $-205 | +1.0pp $-268 |
UW: 25.0% down · 7.5% · 30yr · 1.5% tax · 5.0% vac · 8.0% maint · 8.0% mgmt
Financing live
Cash to close
- Down payment
- $60,000
- Closing costs
- $7,200
- Reserves months
- —
- Total cash needed
- —
Loan-product check · same deal, 3 products live
Conventional
25% down · 7.5% · 30yr
- Down + closing
- —
- Monthly P&I
- —
- Monthly cashflow
- —
- DSCR
- —
- Eligible?
- —
Personal DTI + credit; lowest rate.
DSCR
20% down · 8.5% · 30yr
- Down + closing
- —
- Monthly P&I
- —
- Monthly cashflow
- —
- DSCR
- —
- Eligible?
- —
No personal income docs; deal must DSCR.
Hard money
10% down · 12.0% · 12mo
- Down + closing
- —
- Monthly P&I
- —
- Monthly cashflow
- —
- DSCR
- —
- Eligible?
- —
Short-term bridge; refi at stabilization.
Rent comps 17 comps
| Address | Beds | Baths | Sqft | Rent | $/sqft | DOM | Units | Dist |
|---|---|---|---|---|---|---|---|---|
| 146 Phoenetia Dr St Augustine, FL | 3.0 | 2.0 | 1042 | $1,900 | $1.82 | 5d | 1 | 0.14mi |
| 68 Angelo Ln Saint Augustine, FL | 2.0 | 2.0 | 900 | $1,645 | $1.83 | 15d | 1 | 0.23mi |
| 250 Brainard Dr Unit A St. Augustine, FL | 2.0 | 1.0 | 960 | $2,400 | $2.50 | 25d | 1 | 0.88mi |
| 4420 Carter Rd #43 Saint Augustine, FL | 2.0 | 1.5 | 870 | $1,450 | $1.67 | 25d | 1 | 0.92mi |
| 901 Mariana Pl Saint Augustine, FL | 3.0 | 2.0 | 1447 | $2,175 | $1.50 | 5d | 1 | 0.96mi |
| 968 Salzedo Ave Saint Augustine, FL | 2.0 | 2.0 | 1036 | $2,100 | $2.03 | 25d | 1 | 1.21mi |
| 494 Romano St St. Augustine, FL | 3.0 | 2.0 | 1289 | $1,899 | $1.47 | 4d | 1 | 1.30mi |
| 707 Augusta Cir Saint Augustine, FL | 3.0 | 2.0 | 1428 | $1,868 | $1.31 | 5d | 1 | 1.35mi |
| 204 Augusta Cir Saint Augustine, FL | 2.0 | 2.0 | 1189 | $1,750 | $1.47 | 25d | 1 | 1.39mi |
| 204 Augusta Cir Saint Augustine, FL | 2.0 | 2.0 | 1189 | $1,750 | $1.47 | 19d | 1 | 1.39mi |
| 407 Augusta Cir Saint Augustine, FL | 3.0 | 2.0 | 1428 | $2,095 | $1.47 | 9d | 1 | 1.42mi |
| 15 Cartagena Ct Saint Augustine, FL | 2.0 | 2.0 | 880 | $1,850 | $2.10 | 16d | 1 | 1.45mi |
| 37 Tarragona Ct #37 St. Augustine, FL | 2.0 | 2.0 | 880 | $1,600 | $1.82 | 9d | 1 | 1.47mi |
| 4 Tarragona Ct Saint Augustine, FL | 2.0 | 2.0 | 920 | $1,550 | $1.68 | 25d | 1 | 1.47mi |
| 9 Tarragona Ct Saint Augustine, FL | 2.0 | 2.0 | 880 | $1,600 | $1.82 | 25d | 1 | 1.47mi |
| 1603 Prestwick Pl Saint Augustine, FL | 3.0 | 2.0 | 1428 | $2,200 | $1.54 | 25d | 1 | 1.48mi |
| 16 Alcira Ct Unit 16 St. Augustine, FL | 2.0 | 2.0 | 920 | $1,500 | $1.63 | 9d | 1 | 1.50mi |
HOA detail
- Monthly dues
- $33 · $396/yr
Listing history 21 events
-
2026-06-21days on market $239,999 Active 159 DOM
-
2026-06-18days on market $239,999 Active 156 DOM
-
2026-06-17days on market $239,999 Active 155 DOM
-
2026-06-16days on market $239,999 Active 154 DOM
-
2026-06-15days on market $239,999 Active 153 DOM
-
2026-06-13days on market $239,999 Active 151 DOM
-
2026-06-13days on market $239,999 Active 150 DOM
-
2026-06-10days on market $239,999 Active 147 DOM
-
2026-06-08days on market $239,999 Active 146 DOM
-
2026-06-07days on market $239,999 Active 145 DOM
-
2026-06-03days on market $239,999 Active 141 DOM
-
2026-06-02days on market $239,999 Active 140 DOM
-
2026-06-01days on market $239,999 Active 139 DOM
-
2026-05-31days on market $239,999 Active 138 DOM
-
2026-01-16status Active 672-char remark
Show marketing remark (672 chars)
Short Sale. Short Sale Opportunity — Priced to Move! Calling all investors and value-seekers! This property at 861 Palermo Rd presents a rare chance to acquire a solid home in a desirable Saint Augustine neighborhood at an attractive price. Featuring an open living layout and a spacious lot, this home offers excellent potential for renovation, rental income, or resale. With strong demand in the area and limited inventory at this price point, the upside is tremendous. Bring your vision, add your updates, and unlock the full potential of this investment. Don’t miss out on this profitable short-sale opportunity! All offers are subject to bank approval.
-
2025-12-05$239,999 Active 672-char remark
Show marketing remark (672 chars)
Short Sale. Short Sale Opportunity — Priced to Move! Calling all investors and value-seekers! This property at 861 Palermo Rd presents a rare chance to acquire a solid home in a desirable Saint Augustine neighborhood at an attractive price. Featuring an open living layout and a spacious lot, this home offers excellent potential for renovation, rental income, or resale. With strong demand in the area and limited inventory at this price point, the upside is tremendous. Bring your vision, add your updates, and unlock the full potential of this investment. Don’t miss out on this profitable short-sale opportunity! All offers are subject to bank approval.
-
2024-01-04soldstatus $325,000
-
2023-12-29soldstatus $325,000 14-char remark
Show marketing remark (14 chars)
SOLD Comp Only
-
2023-12-29$325,000 14-char remark
Show marketing remark (14 chars)
SOLD Comp Only
-
2019-07-24soldstatus $149,000
-
2005-02-15soldstatus $162,000
ⓘ Source: listings_history table (triggers on properties + properties_extension) + one-shot
backfill from property_details.listing_events for pre-trigger history.
Tax reassessment forecast FL · Resets to sale price
- Current annual tax
- $3,087 · $257/mo
- Projected year-2 tax
- $3,087 · $257/mo
- Expected delta
- $0/yr ($0/mo · 0.0%)
ⓘ Screening estimate from a state-policy table — verify with the county assessor before closing.
Climate risk First Street
- Flood 6/10 Major FEMA zone X (unshaded) · 70% chance over 30 yrs
- Wildfire 3/10 Moderate
- Heat 10/10 Extreme 7 d/yr ≥106°F today · 21 d/yr by 30 yrs out
- Wind 10/10 Extreme 99% chance of damaging wind over 30 yrs
- Air quality 3/10 Moderate 3 unhealthy d/yr today · 3 by 30 yrs out
Nearby sold comps map
Loading sold comps map…
Walkable amenities ~0.75 mi
Loading nearby amenities…
Taxation est. · year 1
- Rental income
- $22,880
- − Mortgage interest
- −$13,444
- − Property taxes
- −$3,087
- − Insurance
- −$1,200
- − Repairs & maintenance
- −$1,830
- − Management
- −$1,830
- − HOA
- −$396
- − Depreciation
- −$6,982
- Taxable loss
- −$5,889
- Est. tax savings @ 24.0%
- +$1,413
- After-tax cash flow
- $-297/yr
For passive investors: Depreciation is non-cash, so a rental often shows a tax loss while cash-flowing — sheltering income. Rental losses are passive: they offset passive income freely, and up to $25,000/yr can offset ordinary (W-2) income if you actively participate and your MAGI is under $100k (phasing out to $0 by $150k); unused losses carry forward. On sale, claimed depreciation is recaptured at up to 25%, and gains may owe capital-gains tax (a 1031 exchange can defer both). Figures are a year-1 estimate at your 24.0% rate — not tax advice; consult a CPA.
Schools (NCES district)
- District
- St. Johns
- NCES district ID
- 1201740
- Math proficiency
- 75% ▼ -5.00%
- Reading proficiency
- 73% ▼ -2.00%
- Median HH income
- $66,842
- Composite
- 64.31/100
- National rank
- #556
- State rank
- #2 of 73 in FL
Livability — St. Augustine Shores
No livability data for this city. (Only ~50 U.S. cities are tracked.)
Census & demographics
- Census place
- St. Augustine Shores, FL
- County
- Saint Johns County · 301,599 people
- Metro
- Jacksonville, FL
- Population (ZIP)
- 34,855
- Household income
- $76,512
- Rent vs Own
- Severe rent burden
- 634.0
Population outlook (St. Johns County) Hauer SSP2
- Today (2025)
- 303,941 people
- By 2030
- 342,590 · +12.7%
- By 2040
- 417,328 · +37.3%
- By 2050
- 487,011 · +60.2%
- By 2075
- 635,395 · +109.1%
- By 2100
- 717,469 · +136.1%
Race, ethnicity, and origin ACS 2023
- Neighborhood character
- Predominantly White (84%)
- Race & ethnicity
- White 84% Hispanic / Latino 8% Two or more races 5% Black 3% Asian 1%
- Hispanic origin (detail)
- Puerto Rican 2% Dominican 1%
- Common ancestry
- Romanian 3% Lithuanian 3% Italian 2%
- Foreign-born
- 7% · Canada, Jamaica, Guatemala
- Languages at home
- 91% English-only · Spanish 5% German/W. Germanic 1% Other Indo-European 1%
Political lean MEDSL · St. Johns
- 2024 margin
- Solid R (+31.4) · D 33.9% · R 65.2%
- 2008→2024 swing
- +0.2pp no change · 2008: -31.6pp · 2024: -31.4pp
- All cycles
- 2024: R+31.4 2020: R+26.7 2016: R+33.4 2012: R+37.8 2008: R+31.6
Not yet ingested
- Civics
- —
Market trends
- HPI YoY
- ▼ -278.21%
- Current HPI
- 306.2813
- Rent YoY
- ▲ 0.85%
- Metro
- Jacksonville, FL
- State GDP YoY
- ▲ 3.28%
- F500 in state
- 36
Industry mix (Fortune 500 HQ in FL)
| Industry | F500 HQs | Revenue |
|---|---|---|
| Industrial Technology | 2 | $29B |
|
||
| Insurance | 2 | $17B |
|
||
| Retail | 1 | $60B |
|
||
| Technology Distribution | 1 | $58B |
|
||
| Homebuilding | 1 | $35B |
|
||
| Technology Manufacturing | 1 | $35B |
|
||
Price history
+48.1% since first listed7 events — show timeline
- 2026-01-16 Relisted — Stellar MLS as Distributed by MLS Grid
- 2025-12-05 Listed $239,999 Stellar MLS as Distributed by MLS Grid
- 2024-01-04 Sold (Public Records) $325,000 Public Records
- 2023-12-29 Listed $325,000 St. Augustine and St. Johns County Board of REALTORS®
- 2023-12-29 Sold (MLS) $325,000 St. Augustine and St. Johns County Board of REALTORS®
- 2019-07-24 Sold (Public Records) $149,000 Public Records
- 2005-02-15 Sold (Public Records) $162,000 Public Records
Property tax history
+7.4%/yrLatest (2025): $3,087 · +7.7% YoY. Source: county tax records.
Cash-flow waterfall
monthlySold comps — $/sqft
last 12 mo · ≤1 miLoading sold comps…