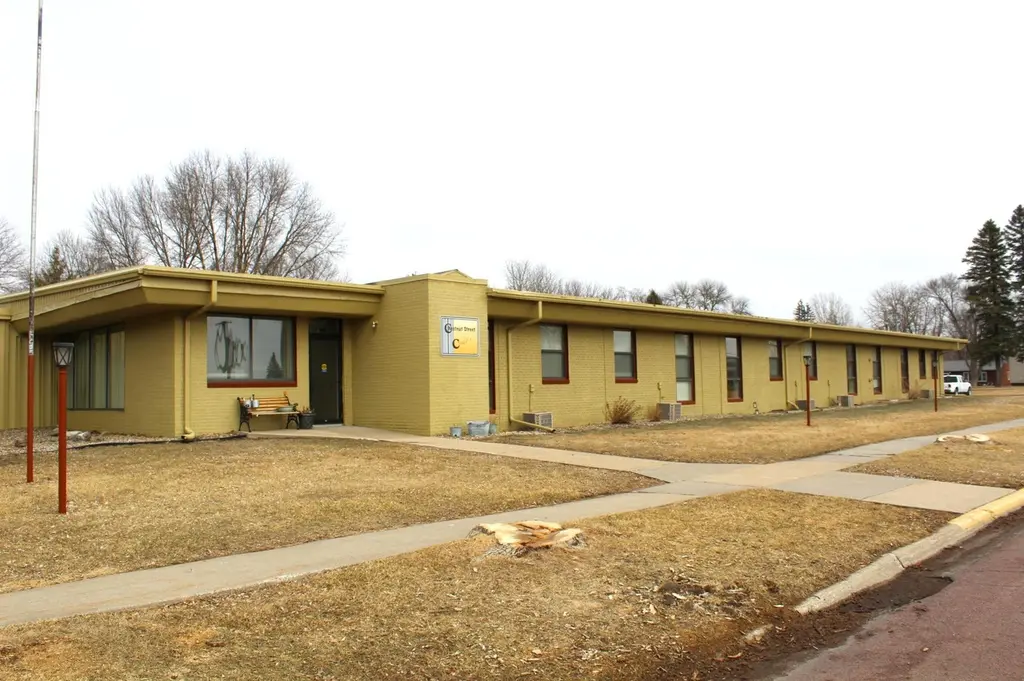
31 Chestnut St E #3 · Trimont, MN
Flood risk 1/10 · Minimal
- FEMA flood zone
- —
- Chance of flooding over 30 yrs
- 0.0%
- Est. flood insurance / yr
- —
Fire risk 1/10 · Minimal
- Est. fire insurance / yr
- $888 – $1,650
Heat risk 2/10 · Minimal
- Hot days now (above 99°F)
- 7 days/yr
- Hot days in 30 yrs
- 15 days/yr
Wind risk 2/10 · Minimal
- Chance of severe wind over 30 yrs
- —
Air-quality risk 1/10 · Minimal
- Unhealthy air days now
- 0 days/yr
- Unhealthy air days in 30 yrs
- 0 days/yr
Risk factors via First Street. Map © Google.
Why this score? — see what drove the D grade
The composite is a weighted blend of 9 inputs, each scored 0–100. Each bar is that input's sub-score; the figure is the points it added to the 100-point composite (weight × sub-score).
- Appreciation +10.0/10.0
- ARV discount +7.5/15.0
- 1% rule +6.7/10.0
- Cash flow +6.0/30.0
- Schools +3.8/10.0
- Condition / age +3.8/5.0
- Livability +3.6/5.0
- Rent growth +2.5/5.0
- DSCR +0.4/10.0
$65,000
🖨 Deal sheet (PDF) 📄 Offer letter ✓ Due diligence
Listing remarks MLS
Condominium for Sale! Beautifully renovated 1-bedroom, 1-bath condo, unique custom updates throughout, creating a warm, comfortable, homey feel. Secure entry with well-maintained common areas and corridors. Enjoy low-maintenance living with low HOA fees that include gas, water, trash, lawn care, and snow removal. Amenities include central air conditioning, forced air furnace, on-site parking, common washer/dryer laundry area and community party/meeting space available. An affordable, stress-free living option. No Pets. No Smoking.
Key facts
- Renovated
- Secure entry
- On-site parking
Tags
Neighborhood map
What this means for you Summary
Snapshot
- This is a 1-bed/1.0-bath other listed at $65k. Condition is rated good.
Deal economics
- At list price, monthly cash flow is $-123 ($-1k/yr) — negative.
- To cash-flow at today's rent, offer at most $47k (27.4% below list).
- Meets the 1% rule at list price ($761 rent vs $65k).
- Recommended offer: $47k (27.4% below list) — sets the bar for cash-flow.
Location & tenants
- Location reads 72/100 on livability (#288 in MN) — a middle-class / working-renter tenant base. Strengths: cost of living A+, housing A+, health & safety A+; Watch: crime D+, amenities F, commute F.
- Martin County West School District (rural): math 38% / reading 50% proficiency, ranked #187 of 301 in MN (top 62%) — families likely to look elsewhere, expect single-tenant / working-renter base with shorter leases.
- Zoned schools: Trimont Elementary (math 42% / reading 52%, grade D-, #492 of 857 statewide, top 61%, 185 students, 48% FRL); Martin County West Junior High (math 27% / reading 37%, grade F, #188 of 258 statewide, top 73%, 95 students, 47% FRL); Martin County West Senior High (math 44% / reading 64%, grade C-, #87 of 471 statewide, top 22%, 224 students, 48% FRL) — zoned schools average 48% FRL vs 28% district-wide (20 pts higher); higher-poverty schools than district average — tighter screening recommended.
- Market conditions: 12 active listings in the ZIP; 19 units permitted in Martin County in 2024 (0 in 5+ unit buildings).
Forward outlook
- In year one you build about $7k of equity ($449 loan paydown + $6k appreciation (10.0% local appreciation)).
- Martin County population projected at -19% by 2050 — secular population decline; favor cash flow + early exit over multi-decade hold.
- By year 5, paydown + projected appreciation supports a ~$32k cash-out refi (75% LTV) — recoverable capital for the next deal without selling this one.
Negotiation context
- It's been on market 108 days — a 9% lower offer ($59k) is reasonable based on typical stale-listing flexibility.
Risks & watch-outs
- Watch-outs: HOA is 36% of rent; built in 1945 — expect roof / HVAC / electrical / plumbing capex.
Questions for the listing agent
- What do current leases actually rent for vs. the listed asking? Can we see a recent rent roll and the last 12 months of T-12 income?
- It's been on market 108 days. Have you received any prior offers? Is the seller open to a 27% concession, seller financing, or rate buy-down credit?
- Built in 1945 — when were the roof, HVAC, electrical panel, plumbing, and water heater last replaced?
- What does the HOA fee cover, when was the last increase, and are there any pending special assessments or reserve-fund shortfalls?
- Why hasn't it sold? Are there any deal-killer items the seller is aware of (foundation, flood, title, zoning, code violations)?
- Is there a deadline driving the sale (1031 exchange, divorce, estate, relocation)? That informs how much negotiation room exists.
- Crime grade is D in this area — have there been break-ins, vandalism, or insurance claims at this property in the last 3 years? What carrier currently insures it and at what premium?
- The area grade is low — what's the realistic commute time and amenity access for the typical tenant pool here? Any planned neighborhood developments (good or bad) we should know about?
- What's the average days-on-market for RENTAL listings here right now (not sales)? A rising rental-DOM trend means longer vacancies and softer asking-rent achievability than the comps imply.
- What's the recent tenant-quality profile in this submarket — average credit score on applications, eviction rate, late-payment / NSF rate, and stable-employment percentage? A property-management company in the area should have these aggregated.
- How much new for-sale + rental construction is in the pipeline within 1–3 miles? Heavy new supply typically softens prices + rents 12–24 months out; constrained supply supports both.
Investment metrics
- 1% rule
- 1.17% ✓
- Cap rate
- 4.02%
- Cash-on-cash
- -8.12%
- DSCR
- 0.64
- GRM
- 7.1
CMA / ARV
No comps found within radius.
Projected returns pro-forma
10.0% appreciation · 3.0% rent growth · sell at horizon
- IRR
- 18.7%
- Equity multiple
- 2.52×
- Total profit
- $27,735
- Equity at exit
- $58,557
- IRR
- 17.4%
- Equity multiple
- 5.85×
- Total profit
- $88,204
- Equity at exit
- $126,281
Cash invested: $18,200 (down + closing). Projections, not guarantees.
Landlord ↔ Tenant lean methodology
- Overall (STATE)
- 46 Balanced
- State Minnesota
- 46 Balanced · D+2
- County
- — inherits STATE
- City
- — inherits STATE
ZIP-level market 56176
- Home prices YoY
- 4.2%
- Active inventory
- 12
- Price-to-rent
- 7.1×
Monthly cashflow live
- Estimated rent
- $761 medium interval (Pro) →
- Mortgage (P&I)
- −$341
- Tax est. 1.5%
- −$81 /mo · $975/yr
- Insurance
- −$27
- HOA
- −$275
- Vacancy / Maint / Mgmt
- −$160
- Net cashflow
- $-123
Break-even live
Sensitivity live
| Price | -10% $-78 | -5% $-101 | +0% $-123 | +5% $-146 | +10% $-168 |
|---|---|---|---|---|---|
| Rent | -10% $-183 | -5% $-153 | +0% $-123 | +5% $-93 | +10% $-63 |
| Rate | -1.0pp $-90 | -0.5pp $-107 | base $-123 | +0.5pp $-140 | +1.0pp $-157 |
UW: 25.0% down · 7.5% · 30yr · 1.5% tax · 5.0% vac · 8.0% maint · 8.0% mgmt
Financing live
Cash to close
- Down payment
- $16,250
- Closing costs
- $1,950
- Reserves months
- —
- Total cash needed
- —
Loan-product check · same deal, 3 products live
Conventional
25% down · 7.5% · 30yr
- Down + closing
- —
- Monthly P&I
- —
- Monthly cashflow
- —
- DSCR
- —
- Eligible?
- —
Personal DTI + credit; lowest rate.
DSCR
20% down · 8.5% · 30yr
- Down + closing
- —
- Monthly P&I
- —
- Monthly cashflow
- —
- DSCR
- —
- Eligible?
- —
No personal income docs; deal must DSCR.
Hard money
10% down · 12.0% · 12mo
- Down + closing
- —
- Monthly P&I
- —
- Monthly cashflow
- —
- DSCR
- —
- Eligible?
- —
Short-term bridge; refi at stabilization.
HOA detail
- Monthly dues
- $275 · $3,300/yr
- Likely covers
- watertrashgaslandscapingsnow removal
Listing history 18 events
-
2026-06-21days on market $65,000 Active 108 DOM
-
2026-06-21days on market $65,000 Active 107 DOM
-
2026-06-18days on market $65,000 Active 105 DOM
-
2026-06-17days on market $65,000 Active 104 DOM
-
2026-06-16days on market $65,000 Active 103 DOM
-
2026-06-15days on market $65,000 Active 102 DOM
-
2026-06-13days on market $65,000 Active 100 DOM
-
2026-06-12days on market $65,000 Active 99 DOM
-
2026-06-09days on market $65,000 Active 96 DOM
-
2026-06-08days on market $65,000 Active 95 DOM
-
2026-06-07days on market $65,000 Active 94 DOM
-
2026-06-05days on market $65,000 Active 92 DOM
-
2026-06-04days on market $65,000 Active 90 DOM
-
2026-06-02days on market $65,000 Active 89 DOM
-
2026-06-01days on market $65,000 Active 88 DOM
-
2026-05-31days on market $65,000 Active 87 DOM
-
2026-05-31days on market $65,000 Active 86 DOM
-
2026-03-03$72,000 Active 541-char remark
Show marketing remark (541 chars)
Condominium for Sale! Beautifully renovated 1-bedroom, 1-bath condo, unique custom updates throughout, creating a warm, comfortable, homey feel. Secure entry with well-maintained common areas and corridors. Enjoy low-maintenance living with low HOA fees that include gas, water, trash, lawn care, and snow removal. Amenities include central air conditioning, forced air furnace, on-site parking, common washer/dryer laundry area and community party/meeting space available. An affordable, stress-free living option. No Pets. No Smoking.
ⓘ Source: listings_history table (triggers on properties + properties_extension) + one-shot
backfill from property_details.listing_events for pre-trigger history.
Climate risk First Street
- Flood 1/10 Low 0% chance over 30 yrs
- Wildfire 1/10 Low
- Heat 2/10 Low 7 d/yr ≥99°F today · 15 d/yr by 30 yrs out
- Wind 2/10 Low
- Air quality 1/10 Low 0 unhealthy d/yr today · 0 by 30 yrs out
Nearby sold comps map
Loading sold comps map…
Walkable amenities ~0.75 mi
Loading nearby amenities…
Taxation est. · year 1
- Rental income
- $9,129
- − Mortgage interest
- −$3,641
- − Property taxes
- −$975
- − Insurance
- −$325
- − Repairs & maintenance
- −$730
- − Management
- −$730
- − HOA
- −$3,300
- − Depreciation
- −$1,891
- Taxable loss
- −$2,463
- Est. tax savings @ 24.0%
- +$591
- After-tax cash flow
- $-887/yr
For passive investors: Depreciation is non-cash, so a rental often shows a tax loss while cash-flowing — sheltering income. Rental losses are passive: they offset passive income freely, and up to $25,000/yr can offset ordinary (W-2) income if you actively participate and your MAGI is under $100k (phasing out to $0 by $150k); unused losses carry forward. On sale, claimed depreciation is recaptured at up to 25%, and gains may owe capital-gains tax (a 1031 exchange can defer both). Figures are a year-1 estimate at your 24.0% rate — not tax advice; consult a CPA.
Condition & rehab AI · 13 photos
A well-maintained, slightly dated 1-bedroom condo with good curb appeal and basic amenities. Minor updates to kitchen and bathroom would significantly enhance its value.
Repairs flagged
- Minor kitchen cabinets — slight wear
- Minor bathroom fixtures — basic design
Value-add opportunities
- Both modernize kitchen with new cabinets and countertops — enhances aesthetics and functionality
- Both update bathroom fixtures — improves functionality and appeal
- Both paint interior walls — refreshes the space and improves curb appeal
Renovation cost estimate screening
| Repair item | Severity | Est. cost |
|---|---|---|
| kitchen cabinets · slight wear | Minor | $500–3,000 |
| bathroom fixtures · basic design | Minor | $500–3,000 |
| Total estimated repair cost · 2 items | $1,000–6,000 |
Value-add ROI direction
- Both modernize kitchen with new cabinets and countertops — enhances aesthetics and functionality ↑
- Both update bathroom fixtures — improves functionality and appeal ↑
- Both paint interior walls — refreshes the space and improves curb appeal ↑
ⓘ Cost ranges are severity-bucket heuristics (US national rule-of-thumb). Get contractor quotes + a written scope before underwriting a rehab budget.
Schools (NCES district)
- District
- Martin County West School District
- NCES district ID
- 2718960
- Math proficiency
- 38% ▼ -13.00%
- Reading proficiency
- 50% ▼ -8.00%
- Median HH income
- $48,825
- Composite
- 37.66/100
- National rank
- #4369
- State rank
- #187 of 301 in MN
Livability — Trimont
- Score
- 72/100
- State rank
- #288
- US rank
- #6269
Category grades
Schools grade is shown separately in the Schools card above.
Census & demographics
- Census place
- Trimont, MN
- Population (ZIP)
- 985
Population outlook (Martin County) Hauer SSP2
- Today (2025)
- 18,583 people
- By 2030
- 17,814 · -4.1%
- By 2040
- 16,312 · -12.2%
- By 2050
- 15,021 · -19.2%
- By 2075
- 13,025 · -29.9%
- By 2100
- 11,311 · -39.1%
Race, ethnicity, and origin ACS 2023
- Neighborhood character
- Predominantly White (88%)
- Race & ethnicity
- White 88% Hispanic / Latino 9% Two or more races 2%
- Hispanic origin (detail)
- Mexican 1% Puerto Rican 8%
- Common ancestry
- Portuguese 12% Lithuanian 5% Italian 3%
- Foreign-born
- 1%
- Languages at home
- 96% English-only · Spanish 3%
Political lean MEDSL · Martin
- 2024 margin
- Solid R (+39.7) · D 29.5% · R 69.1% · Other 1.4%
- 2008→2024 swing
- -24.4pp toward R · 2008: -15.2pp · 2024: -39.7pp
- All cycles
- 2024: R+39.7 2020: R+37.9 2016: R+41.4 2012: R+23.8 2008: R+15.2
Not yet ingested
- Civics
- —
Market trends
- HPI YoY
- ▲ 13.31%
- Current HPI
- 331.7374
- Rent YoY
- —
- Metro
- —
- State GDP YoY
- ▲ 2.41%
- F500 in state
- 34
Industry mix (Fortune 500 HQ in MN)
| Industry | F500 HQs | Revenue |
|---|---|---|
| Healthcare | 2 | $407B |
|
||
| Retail | 2 | $150B |
|
||
| Consumer Goods | 2 | $32B |
|
||
| Industrial Machinery | 2 | $6B |
|
||
| Agriculture | 1 | $40B |
|
||
| Healthcare / Medical Devices | 1 | $32B |
|
||
Price history
1 event — show timeline
- 2026-03-03 Listed $72,000 NORTHSTARMLS as Distributed by MLS Grid
Cash-flow waterfall
monthlySold comps — $/sqft
last 12 mo · ≤1 miLoading sold comps…