 🏗️ New Construction
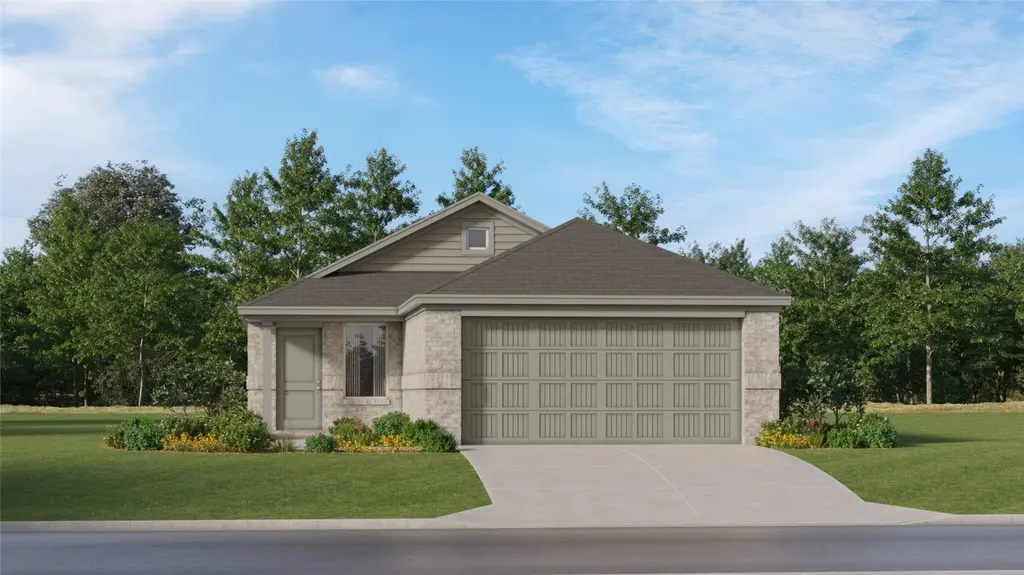
21630 Colonial Meadow Creek Trl · Houston, TX
Flood risk 1/10 · Minimal
- FEMA flood zone
- X (unshaded)
- Chance of flooding over 30 yrs
- 0.0%
- Est. flood insurance / yr
- $507 – $1,088
Fire risk 7/10 · Major
- Est. fire insurance / yr
- $1,222 – $2,270
Heat risk 8/10 · Major
- Hot days now (above 111°F)
- 7 days/yr
- Hot days in 30 yrs
- 22 days/yr
Wind risk 9/10 · Severe
- Chance of severe wind over 30 yrs
- 99.0%
Air-quality risk 2/10 · Minimal
- Unhealthy air days now
- 1 days/yr
- Unhealthy air days in 30 yrs
- 1 days/yr
Risk factors via First Street. Map © Google.
Why this score? — see what drove the F grade
The composite is a weighted blend of 9 inputs, each scored 0–100. Each bar is that input's sub-score; the figure is the points it added to the 100-point composite (weight × sub-score).
- Cash flow +7.5/30.0
- ARV discount +7.5/15.0
- Livability +3.7/5.0
- Appreciation +2.9/10.0
- Schools +2.9/10.0
- 1% rule +2.3/10.0
- Condition / age +2.2/5.0
- DSCR +1.6/10.0
- Rent growth +1.6/5.0
$234,390
🖨 Deal sheet 📄 Offer letter ✓ Due diligence
Listing remarks
The Kitson Floor Plan - This single-level home showcases a spacious open floorplan shared between the kitchen, dining area and family room for easy entertaining during gatherings. An owner’s suite enjoys a private location in a rear corner of the home, complemented by an en-suite bathroom and walk-in closet. There are two secondary bedrooms along the side of the home, which are comfortable spaces for household members and overnight guests. The completion date, prices and features may vary and are subject to change. Please verify with Lennar directly. Photos are for illustrative purposes only.
Key facts
- Walk-in closet
- Open floorplan
- Secondary bedrooms
Tags
Property features AI
Finance
- HOA & community: Community managed by Alamo Management Group; Annual HOA fee of $375
Exterior
- Parking: Attached 2-car garage; Attached garage
- Utilities: Public water; Public sewer
- Home design: Residential property; Under construction (new construction); Slab foundation
- Construction: Built in 2026; Brick and cement siding construction; Composition roof
- Exterior features: Subdivision lot
Interior
- Kitchen: Dishwasher; Electric oven; Electric range; Gas oven; Gas range
- Flooring: Carpet; Vinyl
- Bathrooms: 2 full bathrooms
- Heating & cooling: Central heating (electric and gas); Central air conditioning (electric and gas)
- Interior features: Breakfast bar; Kitchen open to family room; Separate shower; Tub-shower combination; 5 total rooms
- Laundry & utility: Washer hookup; Electric dryer hookup; Gas dryer hookup
Neighborhood map
What this means for you Summary
Snapshot
- This is a 3-bed/2.0-bath single-family listed at $234k. Condition is rated fair.
Deal economics
- At list price, monthly cash flow is $-316 ($-4k/yr) — negative.
- To cash-flow at today's rent, offer at most $205k (12.4% below list).
- To meet the 1% rule (rent ≥ 1% of price), the offer needs to be $184k (21.7% below list).
- Recommended offer: $184k (21.7% below list) — sets the bar for 1% rule.
- Cap rate 4.8% vs local median 3.2% in Houston — top-decile yield for the area; either an underpriced asset or a hidden risk that comps aren't pricing in. Stress-test before assuming the spread holds.
Location & tenants
- Location reads 74/100 on livability (#184 in TX, #4,771 nationally) — a middle-class / working-renter tenant base. Strengths: amenities A+, cost of living A+, housing A+; Watch: crime F.
- Waller ISD (rural): math 30% / reading 35% proficiency, ranked #532 of 826 in TX (top 64%) — families likely to look elsewhere, expect single-tenant / working-renter base with shorter leases.
- Zoned schools: Waller H S (math 25% / reading 40%, grade F, #1,029 of 1,632 statewide, top 64%, 2,639 students, 62% FRL) — zoned schools at 62% FRL track the district average.
- Market conditions: Rents falling (-3.8%/yr); 1183 active listings in the ZIP; 2 comparable units currently listed for rent nearby; solid renter incomes; 29,883 units permitted in Harris County in 2024 (8,621 in 5+ unit buildings).
Forward outlook
- Local home prices are declining (-3.0%/yr); year-one equity from $2k of loan paydown is wiped out by about $8k of value loss. Plan a longer hold.
- Harris County population projected at +47% by 2050 — long-run rental-demand tailwind backs the buy-and-hold thesis.
Negotiation context
- Only 10 days on market — expect competitive offers; lowballing is unlikely to land.
- 2 sale attempts with the ask held roughly flat each time — persistent listings suggest the price (not the market) is what's stuck; bring a comps-based counter.
Risks & watch-outs
- Climate carrying-cost: severe wind risk, 99% chance of damaging wind over 30y; major wildfire risk; extreme-heat days projected 7→22/yr by 2055 (HVAC capex compounding) — expect insurance premiums to compound above CPI over the hold.
Questions for the listing agent
- What do current leases actually rent for vs. the listed asking? Can we see a recent rent roll and the last 12 months of T-12 income?
- Have any recent inspections been done? Can we get a copy of the seller's disclosures and any deferred-maintenance estimates?
- What does the HOA fee cover, when was the last increase, and are there any pending special assessments or reserve-fund shortfalls?
- Is there a deadline driving the sale (1031 exchange, divorce, estate, relocation)? That informs how much negotiation room exists.
- Schools are D-rated, which usually means shorter tenancies and higher turnover. Who's the typical renter profile here, and what's been the actual vacancy rate?
- Crime grade is F in this area — have there been break-ins, vandalism, or insurance claims at this property in the last 3 years? What carrier currently insures it and at what premium?
- The area grade is low — what's the realistic commute time and amenity access for the typical tenant pool here? Any planned neighborhood developments (good or bad) we should know about?
- What's the average days-on-market for RENTAL listings here right now (not sales)? A rising rental-DOM trend means longer vacancies and softer asking-rent achievability than the comps imply.
- What's the recent tenant-quality profile in this submarket — average credit score on applications, eviction rate, late-payment / NSF rate, and stable-employment percentage? A property-management company in the area should have these aggregated.
- How much new for-sale + rental construction is in the pipeline within 1–3 miles? Heavy new supply typically softens prices + rents 12–24 months out; constrained supply supports both.
Investment metrics
- 1% rule
- 0.73% ✗
- Cap rate
- 4.78%
- Cash-on-cash
- -5.40%
- DSCR
- 0.76
- GRM
- 11.4
CMA / ARV
- ARV (median comp)
- $251,133
- List price
- $234,390
- Delta
- -6.67%
- Verdict
- FAIR
- Comps
- 20 within 1.0 mi
Show comp detail 12 sales within ~0.75 mi
| Address | Dist | Beds/Ba | Sqft | Sold | Price | $/sf | Match |
|---|---|---|---|---|---|---|---|
| 21638 Willow River Canyon Ln | 0.06mi | 3/2.0 | 1,409 (0%) | 2mo | $232,990 | $165 | 96 |
| 21614 Willow River Canyon Ln | 0.07mi | 3/2.0 | 1,409 (0%) | 2mo | $232,990 | $165 | 95 |
| 21526 Willow River Canyon Ln | 0.09mi | 3/2.0 | 1,409 (0%) | 1mo | $232,990 | $165 | 95 |
| 21630 Willow River Canyon Ln | 0.06mi | 3/2.0 | 1,418 (+1%) | 2mo | $245,990 | $173 | 95 |
| 21642 Willow River Canyon Ln | 0.06mi | 3/2.0 | 1,418 (+1%) | 2mo | $247,990 | $175 | 94 |
| 21610 Willow River Canyon Ln | 0.07mi | 3/2.0 | 1,418 (+1%) | 2mo | $245,990 | $173 | 94 |
| 21803 Willow River Canyon Ln | 0.15mi | 3/2.0 | 1,273 (-10%) | 2mo | $231,990 | $182 | 76 |
| 29510 Pondview Dr | 0.18mi | 3/2.0 | 1,544 (+10%) | 1mo | $289,999 | $188 | 75 |
| 21719 Willow River Canyon Ln | 0.08mi | 3/2.0 | 1,600 (+14%) | 2mo | $241,290 | $151 | 72 |
| 29522 Barnview Dr | 0.20mi | 3/2.0 | 1,572 (+12%) | 2mo | $225,990 | $144 | 70 |
| 21606 Willow River Canyon Ln | 0.08mi | 4/2.0 (+1) | 1,607 (+14%) | 1mo | $257,990 | $161 | 67 |
| 21634 Willow River Canyon Ln | 0.06mi | 4/2.0 (+1) | 1,607 (+14%) | 2mo | $257,990 | $161 | 67 |
Match score weights: distance 35% · size 25% · config 20% · recency 20%. Top-matched comps best support the ARV.
Projected returns pro-forma
-3.0% appreciation · 0.0% rent growth · sell at horizon
- IRR
- -29.0%
- Equity multiple
- 0.06×
- Total profit
- $-66,173
- Equity at exit
- $37,445
- IRR
- -47.2%
- Equity multiple
- -0.48×
- Total profit
- $-104,164
- Equity at exit
- $21,713
Cash invested: $70,317 (down + closing). Projections, not guarantees.
Landlord ↔ Tenant lean methodology
- Overall (STATE)
- 87 Strongly Landlord-Friendly
- State Texas
- 87 Strongly Landlord-Friendly · R+5
- County
- — inherits STATE
- City
- — inherits STATE
ZIP-level market 77484
- Home prices YoY
- -1.0%
- Rents YoY
- -3.8%
- Active inventory
- 1183
- Price-to-rent
- 10.6×
Monthly cashflow live
- Estimated rent
- $1,836 medium interval (Pro) →
- Mortgage (P&I)
- −$1,317
- Tax est. 1.5%
- −$314 /mo · $3,767/yr
- Insurance
- −$105
- HOA
- −$31
- Vacancy / Maint / Mgmt
- −$385
- Net cashflow
- $-316
Break-even live
UW: 25.0% down · 7.5% · 30yr · 1.5% tax · 5.0% vac · 8.0% maint · 8.0% mgmt
Financing live
Cash to close
- Down payment
- $62,783
- Closing costs
- $7,534
- Reserves months
- —
- Total cash needed
- —
Loan-product check · same deal, 3 products live
Conventional
25% down · 7.5% · 30yr
- Down + closing
- —
- Monthly P&I
- —
- Monthly cashflow
- —
- DSCR
- —
- Eligible?
- —
Personal DTI + credit; lowest rate.
DSCR
20% down · 8.5% · 30yr
- Down + closing
- —
- Monthly P&I
- —
- Monthly cashflow
- —
- DSCR
- —
- Eligible?
- —
No personal income docs; deal must DSCR.
Hard money
10% down · 12.0% · 12mo
- Down + closing
- —
- Monthly P&I
- —
- Monthly cashflow
- —
- DSCR
- —
- Eligible?
- —
Short-term bridge; refi at stabilization.
Rent comps 2 comps
| Address | Beds | Baths | Sqft | Rent | $/sqft | DOM | Units | Dist |
|---|---|---|---|---|---|---|---|---|
| 21707 Cottonwood Meadows Trl Waller, TX | 3.0 | 2.0 | 1373 | $1,749 | $1.27 | 24d | 1 | 0.09mi |
| 21514 Barnridge Ct Waller, TX | 4.0 | 2.0 | 1655 | $1,895 | $1.15 | 5d | 1 | 0.22mi |
HOA detail
- Monthly dues
- $31 · $372/yr
Listing history 6 events
-
2026-05-13price $230,990 605-char remark
-
2026-05-13price $230,990 419-char remark
-
2026-05-12$235,990 Active 605-char remark
-
2026-05-12historical
-
2026-05-07$235,990 Active
-
2026-05-05$235,990 Active 419-char remark
ⓘ Source: listings_history table (triggers on properties + properties_extension) + one-shot
backfill from property_details.listing_events for pre-trigger history.
Climate risk First Street
- Flood 1/10 Low FEMA zone X (unshaded) · 0% chance over 30 yrs
- Wildfire 7/10 Severe
- Heat 8/10 Severe 7 d/yr ≥111°F today · 22 d/yr by 30 yrs out
- Wind 9/10 Extreme 99% chance of damaging wind over 30 yrs
- Air quality 2/10 Low 1 unhealthy d/yr today · 1 by 30 yrs out
Nearby sold comps map
Loading sold comps map…
Walkable amenities ~0.75 mi
Loading nearby amenities…
Taxation est. · year 1
- Rental income
- $22,029
- − Mortgage interest
- −$14,067
- − Property taxes
- −$3,767
- − Insurance
- −$1,256
- − Repairs & maintenance
- −$1,762
- − Management
- −$1,762
- − HOA
- −$372
- − Depreciation
- −$7,306
- Taxable loss
- −$8,264
- Est. tax savings @ 24.0%
- +$1,983
- After-tax cash flow
- $-1,812/yr
For passive investors: Depreciation is non-cash, so a rental often shows a tax loss while cash-flowing — sheltering income. Rental losses are passive: they offset passive income freely, and up to $25,000/yr can offset ordinary (W-2) income if you actively participate and your MAGI is under $100k (phasing out to $0 by $150k); unused losses carry forward. On sale, claimed depreciation is recaptured at up to 25%, and gains may owe capital-gains tax (a 1031 exchange can defer both). Figures are a year-1 estimate at your 24.0% rate — not tax advice; consult a CPA.
Condition & rehab AI · 0 photos
This single-family home requires moderate repairs and maintenance to improve its condition and value. Painting, refinishing floors, and reconditioning the HVAC unit would significantly enhance its appeal and worth.
Repairs flagged
- Moderate Kitchen cabinets — Signs of wear and tear.
- Moderate Kitchen countertops — Signs of wear and tear.
- Moderate Bathroom fixtures — Signs of wear and tear.
- Minor Exterior siding — Some discoloration and minor wear.
- Minor Interior walls — Paint appears faded in some areas.
- Minor Windows — Some frames show signs of wear.
- Minor Foundation cracks — Cracks visible in the concrete.
- Minor HVAC unit — Appears old and may need maintenance.
- Minor Landscaping — Minimal and could benefit from updates to enhance curb appeal.
Value-add opportunities
- Both Painting the interior and exterior — Enhances curb appeal and interior aesthetics.
- Both Refinishing hardwood floors — Improves the look and value of the home.
- Both Reconditioning HVAC unit — Improves comfort and energy efficiency, attracting more buyers/renters.
Renovation cost estimate screening
| Repair item | Severity | Est. cost |
|---|---|---|
| Kitchen cabinets · Signs of wear and tear. | Moderate | $3,000–15,000 |
| Kitchen countertops · Signs of wear and tear. | Moderate | $3,000–15,000 |
| Bathroom fixtures · Signs of wear and tear. | Moderate | $3,000–15,000 |
| Exterior siding · Some discoloration and minor wear. | Minor | $500–3,000 |
| Interior walls · Paint appears faded in some areas. | Minor | $500–3,000 |
| Windows · Some frames show signs of wear. | Minor | $500–3,000 |
| Foundation cracks · Cracks visible in the concrete. | Minor | $500–3,000 |
| HVAC unit · Appears old and may need maintenance. | Minor | $500–3,000 |
| Landscaping · Minimal and could benefit from updates to enhance curb appeal. | Minor | $500–3,000 |
| Total estimated repair cost · 9 items | $12,000–63,000 |
Value-add ROI direction
- Both Painting the interior and exterior — Enhances curb appeal and interior aesthetics. ↑
- Both Refinishing hardwood floors — Improves the look and value of the home. ↑
- Both Reconditioning HVAC unit — Improves comfort and energy efficiency, attracting more buyers/renters. ↑
ⓘ Cost ranges are severity-bucket heuristics (US national rule-of-thumb). Get contractor quotes + a written scope before underwriting a rehab budget.
Schools (NCES district)
- District
- Waller ISD
- NCES district ID
- 4844430
- Math proficiency
- 30% ▼ -23.00%
- Reading proficiency
- 35% ▼ -11.00%
- Median HH income
- $58,911
- Composite
- 29.12/100
- National rank
- #6593
- State rank
- #532 of 826 in TX
Livability — Houston
- Score
- 74/100
- State rank
- #184
- US rank
- #4771
Category grades
Schools grade is shown separately in the Schools card above.
Census & demographics
- County
- Harris County · 4,702,590 people
- City population
- 3,226,434
- Metro
- Houston-The Woodlands-Sugar Land, TX
- Population (ZIP)
- 14,348
- Household income
- $81,250
- Rent vs Own
- Severe rent burden
- 270.0
Population outlook (Harris County) Hauer SSP2
- Today (2025)
- 5,571,493 people
- By 2030
- 6,089,821 · +9.3%
- By 2040
- 7,142,806 · +28.2%
- By 2050
- 8,185,864 · +46.9%
- By 2075
- 10,574,329 · +89.8%
- By 2100
- 12,109,958 · +117.4%
Race, ethnicity, and origin ACS 2023
- Neighborhood character
- Diverse neighborhood (Simpson 0.66)
- Race & ethnicity
- White 47% Hispanic / Latino 31% Two or more races 16% Black 15%
- Hispanic origin (detail)
- Mexican 30%
- Common ancestry
- Slovak 2% Serbian 2% Iranian 1%
- Foreign-born
- 13% · Canada
- Languages at home
- 73% English-only · Spanish 24% Arabic 2%
Political lean MEDSL · Harris
- 2024 margin
- Lean D (+5.5) · D 52.0% · R 46.4% · Other 1.6%
- 2008→2024 swing
- +3.9pp toward D · 2008: 1.6pp · 2024: 5.5pp
- All cycles
- 2024: D+5.5 2020: D+13.3 2016: D+12.4 2012: D+0.1 2008: D+1.6
Not yet ingested
- Civics
- —
Market trends
- HPI YoY
- ▼ -4.17%
- Current HPI
- 397.85
- Rent YoY
- ▼ -3.77%
- Metro
- Houston-The Woodlands-Sugar Land, TX
- State GDP YoY
- ▲ 3.95%
- F500 in state
- 110
Industry mix (Fortune 500 HQ in TX)
| Industry | F500 HQs | Revenue |
|---|---|---|
| Energy | 16 | $1,198B |
|
||
| Technology | 5 | $198B |
|
||
| Engineering / Construction | 4 | $72B |
|
||
| Energy Services | 3 | $60B |
|
||
| Utilities | 3 | $41B |
|
||
| Healthcare | 2 | $330B |
|
||
Price history
-0.7% since first listed6 events — show timeline
- 2026-05-22 Pending — HARMLS
- 2026-05-19 Price Changed $234,390 HARMLS
- 2026-05-13 Price Changed $230,990 HARMLS
- 2026-05-12 Listing Removed — HARMLS
- 2026-05-12 Listed $235,990 HARMLS
- 2026-05-07 Listed $235,990 HARMLS
Cash-flow waterfall
monthlySold comps — $/sqft
last 12 mo · ≤1 miLoading sold comps…