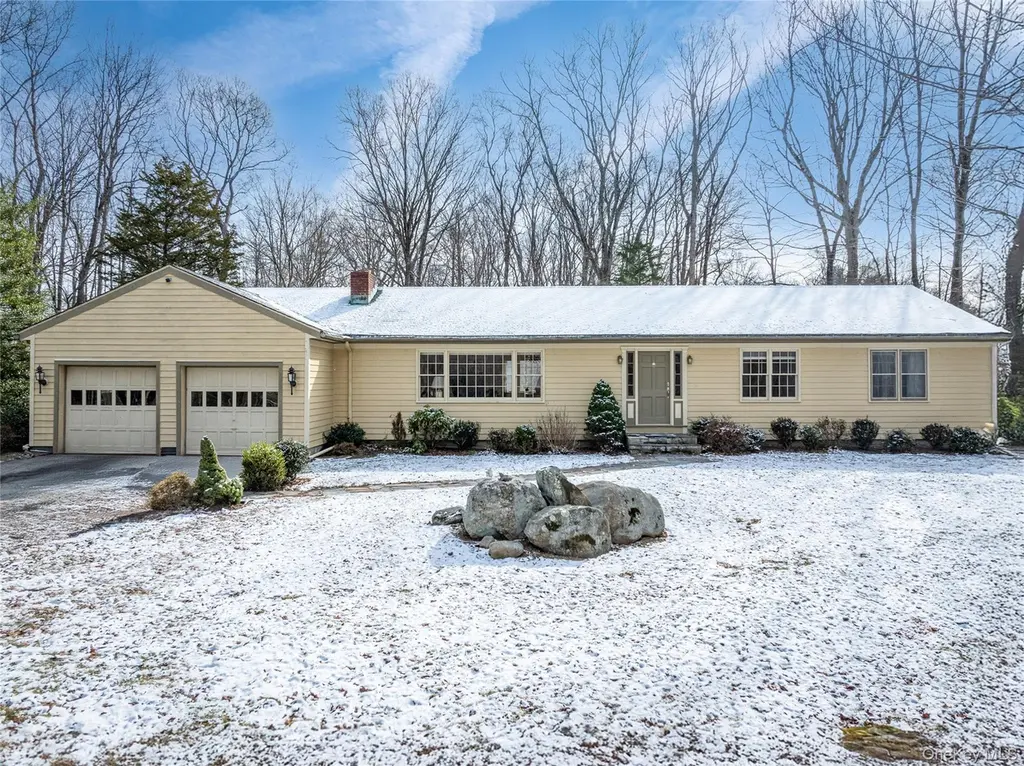
50 West Rd · Scotts Corners, NY
Flood risk 1/10 · Minimal
- FEMA flood zone
- X (unshaded)
- Chance of flooding over 30 yrs
- 0.0%
- Est. flood insurance / yr
- $473 – $860
Fire risk 3/10 · Minor
- Est. fire insurance / yr
- $691 – $1,283
Heat risk 4/10 · Minor
- Hot days now (above 99°F)
- 7 days/yr
- Hot days in 30 yrs
- 16 days/yr
Wind risk 6/10 · Moderate
- Chance of severe wind over 30 yrs
- 27.0%
Air-quality risk 4/10 · Minor
- Unhealthy air days now
- 3 days/yr
- Unhealthy air days in 30 yrs
- 5 days/yr
Risk factors via First Street. Map © Google.
Why this score? — see what drove the C- grade
The composite is a weighted blend of 9 inputs, each scored 0–100. Each bar is that input's sub-score; the figure is the points it added to the 100-point composite (weight × sub-score).
- Cash flow +18.3/30.0
- ARV discount +8.5/15.0
- Schools +7.5/10.0
- DSCR +5.8/10.0
- 1% rule +3.8/10.0
- Livability +3.2/5.0
- Rent growth +2.5/5.0
- Condition / age +2.5/5.0
- Appreciation +0.0/10.0
$749,000
🖨 Deal sheet 📄 Offer letter ✓ Due diligence
Listing remarks
Set on a picturesque 2-acre level lot in South Salem, this charming ranch offers the perfect opportunity to create your dream home. Designed for easy one-level living, this house features 4 Bedrooms including a primary bedroom with en-suite bathroom. While this home is in South Salem, it borders New Canaan, Ridgefield and Pound Ridge and is within the highly regarded Katonah-Lewisboro School District. This property combines convenience with a peaceful country setting. The lower level boasts a generous recreation room complete with a fireplace, living area and built in bar - perfect for entertaining. A screened in porch off the kitchen provides a serene spot to enjoy your morning coffee whil
Key facts
- 2.04 acre lot
- 2 garage spots
- Built 1956
Neighborhood map
What this means for you Summary
Snapshot
- This is a 4-bed/2.5-bath single-family listed at $749k.
Deal economics
- At list price, monthly cash flow is $688 ($8k/yr) — positive.
- The deal already cash-flows at list — no discount required.
- To meet the 1% rule (rent ≥ 1% of price), the offer needs to be $661k (11.8% below list).
- Recommended offer: $661k (11.8% below list) — sets the bar for 1% rule.
- Cap rate 7.4% vs local median 2.6% in Scotts Corners — top-decile yield for the area; either an underpriced asset or a hidden risk that comps aren't pricing in. Stress-test before assuming the spread holds.
Location & tenants
- Location reads 63/100 on livability (#810 in NY) — a middle-class / working-renter tenant base. Strengths: crime A+, employment A+, housing B+; Watch: amenities F, commute F, cost of living F.
- Katonah-Lewisboro Union Free School District (suburban): math 75% / reading 82% proficiency, ranked #32 of 590 in NY (top 5%) — strong family-tenant draw, lease renewals of 3-5y typical; only 3% free/reduced lunch — higher-income household profile.
- Zoned schools: Meadow Pond Elementary School (math 77% / reading 87%, grade A+, #138 of 2,108 statewide, top 8%, 342 students, 8% FRL); John Jay Middle School (math 58% / reading 79%, grade A, #94 of 729 statewide, top 13%, 662 students, 7% FRL); John Jay High School (math 98% / reading 82%, grade A+, #238 of 1,100 statewide, top 23%, 917 students, 9% FRL) — zoned schools at 8% FRL track the district average.
- Market conditions: 54 active listings in the ZIP; 2 comparable units currently listed for rent nearby; 954 units permitted in Westchester County in 2024 (649 in 5+ unit buildings).
Forward outlook
- Local home prices are declining (-3.0%/yr); year-one equity from $5k of loan paydown is wiped out by about $22k of value loss. Plan a longer hold.
- Westchester County population projected at +10% by 2050 — modest demand growth; plan on rents tracking national, not racing it.
Negotiation context
- It's been on market 18 days — a 2% lower offer ($738k) is reasonable based on typical stale-listing flexibility.
Risks & watch-outs
- Watch-outs: built in 1956 — expect roof / HVAC / electrical / plumbing capex.
- Climate carrying-cost: major wind risk, 27% chance of damaging wind over 30y — expect insurance premiums to compound above CPI over the hold.
Questions for the listing agent
- Built in 1956 — when were the roof, HVAC, electrical panel, plumbing, and water heater last replaced?
- Is there a deadline driving the sale (1031 exchange, divorce, estate, relocation)? That informs how much negotiation room exists.
- What's the average days-on-market for RENTAL listings here right now (not sales)? A rising rental-DOM trend means longer vacancies and softer asking-rent achievability than the comps imply.
- What's the recent tenant-quality profile in this submarket — average credit score on applications, eviction rate, late-payment / NSF rate, and stable-employment percentage? A property-management company in the area should have these aggregated.
- How much new for-sale + rental construction is in the pipeline within 1–3 miles? Heavy new supply typically softens prices + rents 12–24 months out; constrained supply supports both.
Investment metrics
- 1% rule
- 0.88% ✗
- Cap rate
- 7.40%
- Cash-on-cash
- 3.94%
- DSCR
- 1.18
- GRM
- 9.4
CMA / ARV
- ARV (on-the-fly)
- $766,088
- Comps found
- 3
Show comp detail 3 sales within ~0.75 mi
| Address | Dist | Beds/Ba | Sqft | Sold | Price | $/sf | Match |
|---|---|---|---|---|---|---|---|
| 50 West Rd | 0.00mi | 4/2.5 | 2,227 (0%) | 1mo | $765,000 | $344 | 99 |
| 34 Siscowit Rd | 0.41mi | 3/2.5 (-1) | 2,220 (-0%) | 17mo | $996,000 | $449 | 61 |
| 35 West Rd | 0.21mi | 3/2.5 (-1) | 2,052 (-8%) | 22mo | $631,000 | $308 | 54 |
Match score weights: distance 35% · size 25% · config 20% · recency 20%. Top-matched comps best support the ARV.
Projected returns pro-forma
-3.0% appreciation · 3.0% rent growth · sell at horizon
- IRR
- -10.2%
- Equity multiple
- 0.63×
- Total profit
- $-77,823
- Equity at exit
- $111,678
- IRR
- -0.9%
- Equity multiple
- 0.94×
- Total profit
- $-12,517
- Equity at exit
- $64,760
Cash invested: $209,720 (down + closing). Projections, not guarantees.
Landlord ↔ Tenant lean methodology
- Overall (STATE)
- 15 Strongly Tenant-Friendly
- State New York
- 15 Strongly Tenant-Friendly · D+10
- County
- — inherits STATE
- City
- — inherits STATE
ZIP-level market 10590
- Home prices YoY
- -30.8%
- Active inventory
- 54
- Price-to-rent
- 9.4×
Monthly cashflow live
- Estimated rent
- $6,606 medium interval (Pro) →
- Mortgage (P&I)
- −$3,928
- Tax from tax record
- −$290 /mo · $3,485/yr
- Insurance
- −$312
- HOA
- −$0
- Vacancy / Maint / Mgmt
- −$1,387
- Net cashflow
- $688
Break-even live
UW: 25.0% down · 7.5% · 30yr · 1.5% tax · 5.0% vac · 8.0% maint · 8.0% mgmt
Financing live
Cash to close
- Down payment
- $187,250
- Closing costs
- $22,470
- Reserves months
- —
- Total cash needed
- —
Loan-product check · same deal, 3 products live
Conventional
25% down · 7.5% · 30yr
- Down + closing
- —
- Monthly P&I
- —
- Monthly cashflow
- —
- DSCR
- —
- Eligible?
- —
Personal DTI + credit; lowest rate.
DSCR
20% down · 8.5% · 30yr
- Down + closing
- —
- Monthly P&I
- —
- Monthly cashflow
- —
- DSCR
- —
- Eligible?
- —
No personal income docs; deal must DSCR.
Hard money
10% down · 12.0% · 12mo
- Down + closing
- —
- Monthly P&I
- —
- Monthly cashflow
- —
- DSCR
- —
- Eligible?
- —
Short-term bridge; refi at stabilization.
Rent comps 2 comps
| Address | Beds | Baths | Sqft | Rent | $/sqft | DOM | Units | Dist |
|---|---|---|---|---|---|---|---|---|
| 903 Oakridge Cmns South Salem, NY | 3.0 | 2.0 | 2059 | $6,800 | $3.30 | 43d | 1 | 0.60mi |
| 905 Oakridge Cmns South Salem, NY | 3.0 | 3.0 | 1938 | $6,400 | $3.30 | 21d | 1 | 0.60mi |
Listing history 3 events
-
2026-04-07status Pending
-
2026-03-21$749,000 Active
-
2026-03-19historical $749,000
ⓘ Source: listings_history table (triggers on properties + properties_extension) + one-shot
backfill from property_details.listing_events for pre-trigger history.
Tax reassessment forecast NY · Partial reset (capped growth)
- Current annual tax
- $3,485 · $290/mo
- Projected year-2 tax
- $8,072 · $673/mo
- Expected delta
- +$4,586/yr (+$382/mo · 131.6%)
ⓘ Screening estimate from a state-policy table — verify with the county assessor before closing.
Climate risk First Street
- Flood 1/10 Low FEMA zone X (unshaded) · 0% chance over 30 yrs
- Wildfire 3/10 Moderate
- Heat 4/10 Moderate 7 d/yr ≥99°F today · 16 d/yr by 30 yrs out
- Wind 6/10 Major 27% chance of damaging wind over 30 yrs
- Air quality 4/10 Moderate 3 unhealthy d/yr today · 5 by 30 yrs out
Nearby sold comps map
Loading sold comps map…
Walkable amenities ~0.75 mi
Loading nearby amenities…
Taxation est. · year 1
- Rental income
- $79,273
- − Mortgage interest
- −$41,956
- − Property taxes
- −$3,485
- − Insurance
- −$3,745
- − Repairs & maintenance
- −$6,342
- − Management
- −$6,342
- − Depreciation
- −$21,789
- Taxable loss
- −$4,386
- Est. tax savings @ 24.0%
- +$1,053
- After-tax cash flow
- $9,314/yr
For passive investors: Depreciation is non-cash, so a rental often shows a tax loss while cash-flowing — sheltering income. Rental losses are passive: they offset passive income freely, and up to $25,000/yr can offset ordinary (W-2) income if you actively participate and your MAGI is under $100k (phasing out to $0 by $150k); unused losses carry forward. On sale, claimed depreciation is recaptured at up to 25%, and gains may owe capital-gains tax (a 1031 exchange can defer both). Figures are a year-1 estimate at your 24.0% rate — not tax advice; consult a CPA.
Schools (NCES district)
- District
- Katonah-Lewisboro Union Free School District
- NCES district ID
- 3616080
- Math proficiency
- 75% ▼ -8.00%
- Reading proficiency
- 82% ▲ 2.00%
- Median HH income
- $140,994
- Composite
- 75.09/100
- National rank
- #142
- State rank
- #32 of 590 in NY
Livability — Scotts Corners
- Score
- 63/100
- State rank
- #810
- US rank
- #15702
Category grades
Schools grade is shown separately in the Schools card above.
Census & demographics
- Population (ZIP)
- 7,314
Population outlook (Westchester County) Hauer SSP2
- Today (2025)
- 1,028,035 people
- By 2030
- 1,051,636 · +2.3%
- By 2040
- 1,098,520 · +6.9%
- By 2050
- 1,136,044 · +10.5%
- By 2075
- 1,196,925 · +16.4%
- By 2100
- 1,175,147 · +14.3%
Race, ethnicity, and origin ACS 2023
- Neighborhood character
- Predominantly White (84%)
- Race & ethnicity
- White 84% Two or more races 8% Hispanic / Latino 6% Asian 4% Black 1%
- Hispanic origin (detail)
- Puerto Rican 3%
- Common ancestry
- Italian 4% Romanian 3% Scotch-Irish 2%
- Foreign-born
- 13% · Canada, South Korea, Jamaica
- Languages at home
- 90% English-only · Spanish 4% Other Indo-European 2% Korean 1%
Political lean MEDSL · Westchester
- 2024 margin
- Strong D (+26.3) · D 63.1% · R 36.9%
- 2008→2024 swing
- -1.3pp toward R · 2008: 27.6pp · 2024: 26.3pp
- All cycles
- 2024: D+26.3 2020: D+36.3 2016: D+32.8 2012: D+22.2 2008: D+27.6
Not yet ingested
- Civics
- —
Market trends
- HPI YoY
- ▼ -66.87%
- Current HPI
- 150.088
- Rent YoY
- —
- Metro
- —
- State GDP YoY
- ▲ 2.60%
- F500 in state
- 92
Industry mix (Fortune 500 HQ in NY)
| Industry | F500 HQs | Revenue |
|---|---|---|
| Financial Services | 10 | $950B |
|
||
| Consumer Goods | 9 | $162B |
|
||
| Insurance | 4 | $225B |
|
||
| Telecommunications | 2 | $144B |
|
||
| Pharmaceuticals | 2 | $112B |
|
||
| Media / Entertainment | 2 | $69B |
|
||
Price history
+0.0% since first listed3 events — show timeline
- 2026-04-07 Pending — OneKey® MLS as Distributed by MLS Grid
- 2026-03-21 Listed $749,000 OneKey® MLS as Distributed by MLS Grid
- 2026-03-19 Coming Soon $749,000 OneKey® MLS as Distributed by MLS Grid
Property tax history
-4.0%/yrLatest (2025): $3,485 · +71.1% YoY. Source: county tax records.
Cash-flow waterfall
monthlySold comps — $/sqft
last 12 mo · ≤1 miLoading sold comps…