 🏷️ Likely Rental
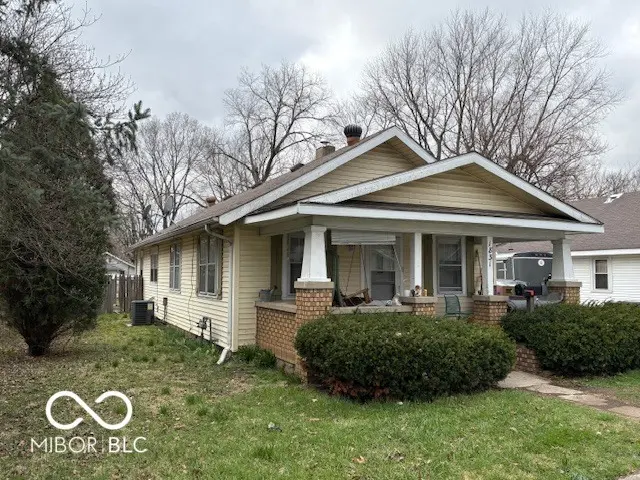
1831 Poplar St · Anderson, IN
Flood risk 1/10 · Minimal
- FEMA flood zone
- X (unshaded)
- Chance of flooding over 30 yrs
- 0.0%
- Est. flood insurance / yr
- $473 – $860
Fire risk 1/10 · Minimal
- Est. fire insurance / yr
- $717 – $1,331
Heat risk 3/10 · Minor
- Hot days now (above 100°F)
- 7 days/yr
- Hot days in 30 yrs
- 18 days/yr
Wind risk 2/10 · Minimal
- Chance of severe wind over 30 yrs
- —
Air-quality risk 3/10 · Minor
- Unhealthy air days now
- 2 days/yr
- Unhealthy air days in 30 yrs
- 3 days/yr
Risk factors via First Street. Map © Google.
Why this score? — see what drove the B+ grade
The composite is a weighted blend of 9 inputs, each scored 0–100. Each bar is that input's sub-score; the figure is the points it added to the 100-point composite (weight × sub-score).
- Cash flow +30.0/30.0
- ARV discount +15.0/15.0
- 1% rule +10.0/10.0
- DSCR +10.0/10.0
- Rent growth +3.0/5.0
- Livability +3.0/5.0
- Condition / age +2.5/5.0
- Schools +1.6/10.0
- Appreciation +0.0/10.0
$79,900
🖨 Deal sheet 📄 Offer letter ✓ Due diligence
Listing remarks MLS
Now vacant, was rented for $850 per month. 2 bedroom, 1 bath home featuring a fenced-in backyard, back patio, and covered front porch—great for outdoor enjoyment. Washer and dryer hookups are located in the basement for added convenience.
Key facts
- Covered front porch
- Fenced-in backyard
- Back patio
Tags
Neighborhood map
What this means for you Summary
Snapshot
- This is a 3-bed/1.0-bath single-family listed at $80k.
Deal economics
- At list price, monthly cash flow is $405 ($5k/yr) — positive.
- The deal already cash-flows at list — no discount required.
- Meets the 1% rule at list price ($1k rent vs $80k).
- Recommended offer: $75k (6.0% below list) — sets the bar for market timing.
- Cap rate 12.4% vs local median 6.5% in Anderson — top-decile yield for the area; either an underpriced asset or a hidden risk that comps aren't pricing in. Stress-test before assuming the spread holds.
Location & tenants
- Location reads 60/100 on livability (#521 in IN) — a middle-class / working-renter tenant base. Strengths: cost of living A+, housing A+; Watch: schools F, crime D-, amenities F.
- Anderson Community School Corporation (urban): math 15% / reading 23% proficiency, ranked #280 of 301 in IN (top 93%) — low school quality limits family demand, transient renter base, plan for 1-2y turnover; 70% free/reduced lunch — lower-income household profile, screen leases tightly.
- Market conditions: Rents rising (+1.8%/yr); 159 active listings in the ZIP; 18 comparable units currently listed for rent nearby; rentals lingering (median 44d on market — plan ~5-8 weeks vacancy on turnover, expect pricing pressure); 50% of comp listings sitting > 30 days — soft ceiling on asking rent; 184 units permitted in Madison County in 2024 (0 in 5+ unit buildings).
Forward outlook
- Local home prices are declining (-3.0%/yr); year-one equity from $552 of loan paydown is wiped out by about $2k of value loss. Plan a longer hold.
- Madison County population projected at -14% by 2050 — secular population decline; favor cash flow + early exit over multi-decade hold.
- At projected returns (-3.0% appreciation + 1.8% rent growth), your $22k cash investment doubles in ~6 years — after that, you're playing with house money.
Negotiation context
- It's been on market 82 days — a 6% lower offer ($75k) is reasonable based on typical stale-listing flexibility.
- 6 sale attempts since 21y ago with the ask held roughly flat each time — persistent listings suggest the price (not the market) is what's stuck; bring a comps-based counter.
- Current owner paid $25k; list at $80k implies a 220% gain — meaningful room to come down on a strong offer.
Risks & watch-outs
- Watch-outs: built in 1922 — expect roof / HVAC / electrical / plumbing capex.
Questions for the listing agent
- It's been on market 82 days. Have you received any prior offers? Is the seller open to a 6% concession, seller financing, or rate buy-down credit?
- Built in 1922 — when were the roof, HVAC, electrical panel, plumbing, and water heater last replaced?
- Why hasn't it sold? Are there any deal-killer items the seller is aware of (foundation, flood, title, zoning, code violations)?
- Is there a deadline driving the sale (1031 exchange, divorce, estate, relocation)? That informs how much negotiation room exists.
- Schools are F-rated, which usually means shorter tenancies and higher turnover. Who's the typical renter profile here, and what's been the actual vacancy rate?
- Crime grade is D in this area — have there been break-ins, vandalism, or insurance claims at this property in the last 3 years? What carrier currently insures it and at what premium?
- What's the average days-on-market for RENTAL listings here right now (not sales)? A rising rental-DOM trend means longer vacancies and softer asking-rent achievability than the comps imply.
- What's the recent tenant-quality profile in this submarket — average credit score on applications, eviction rate, late-payment / NSF rate, and stable-employment percentage? A property-management company in the area should have these aggregated.
- How much new for-sale + rental construction is in the pipeline within 1–3 miles? Heavy new supply typically softens prices + rents 12–24 months out; constrained supply supports both.
Investment metrics
- 1% rule
- 1.58% ✓
- Cap rate
- 12.38%
- Cash-on-cash
- 21.73%
- DSCR
- 1.97
- GRM
- 5.3
CMA / ARV
- ARV (median comp)
- $100,290
- List price
- $79,900
- Delta
- -20.33%
- Verdict
- UNDERPRICED
- Comps
- 20 within 1.0 mi
Show comp detail 12 sales within ~0.75 mi
| Address | Dist | Beds/Ba | Sqft | Sold | Price | $/sf | Match |
|---|---|---|---|---|---|---|---|
| 2018 Poplar St | 0.15mi | 3/1.0 | 1,036 (+5%) | 8mo | $100,000 | $97 | 79 |
| 2102 Crystal St | 0.23mi | 3/1.0 | 1,046 (+6%) | 4mo | $125,000 | $120 | 77 |
| 530 Hawthorne Ave | 0.46mi | 3/1.0 | 1,008 (+2%) | 8mo | $129,000 | $128 | 68 |
| 2413 Silver St | 0.51mi | 3/1.5 | 1,008 (+2%) | 5mo | $131,500 | $130 | 67 |
| 1611 Poplar St | 0.20mi | 2/1.0 (-1) | 896 (-10%) | 5mo | $103,000 | $115 | 65 |
| 2108 Silver St | 0.24mi | 2/1.0 (-1) | 918 (-7%) | 8mo | $98,400 | $107 | 65 |
| 305 W Vinyard St | 0.41mi | 3/1.0 | 925 (-7%) | 12mo | $119,900 | $130 | 60 |
| 718 Hawthorne Ave | 0.55mi | 3/1.0 | 1,073 (+8%) | 6mo | $175,000 | $163 | 55 |
| 1827 Lowell Ave | 0.60mi | 3/1.0 | 1,066 (+8%) | 14mo | $145,000 | $136 | 47 |
| 416 Country Club Ln | 0.48mi | 2/1.0 (-1) | 850 (-14%) | 5mo | $127,500 | $150 | 45 |
| 2417 Crystal St | 0.54mi | 2/2.0 (-1) | 925 (-7%) | 12mo | $130,000 | $141 | 45 |
| 2608 Shawnee Dr | 0.70mi | 3/1.0 | 850 (-14%) | 4mo | $110,000 | $129 | 41 |
Match score weights: distance 35% · size 25% · config 20% · recency 20%. Top-matched comps best support the ARV.
Projected returns pro-forma
-3.0% appreciation · 1.82% rent growth · sell at horizon
- IRR
- 13.0%
- Equity multiple
- 1.51×
- Total profit
- $11,417
- Equity at exit
- $11,913
- IRR
- 20.9%
- Equity multiple
- 2.67×
- Total profit
- $37,409
- Equity at exit
- $6,908
Cash invested: $22,372 (down + closing). Projections, not guarantees.
Landlord ↔ Tenant lean methodology
- Overall (STATE)
- 90 Strongly Landlord-Friendly
- State Indiana
- 90 Strongly Landlord-Friendly · R+11
- County
- — inherits STATE
- City
- — inherits STATE
ZIP-level market 46012
- Home prices YoY
- -18.6%
- Rents YoY
- 1.8%
- Active inventory
- 159
- Price-to-rent
- 5.3×
Monthly cashflow live
- Estimated rent
- $1,261 high interval (Pro) →
- Mortgage (P&I)
- −$419
- Tax from tax record
- −$139 /mo · $1,669/yr
- Insurance
- −$33
- HOA
- −$0
- Vacancy / Maint / Mgmt
- −$265
- Net cashflow
- $405
Break-even live
UW: 25.0% down · 7.5% · 30yr · 1.5% tax · 5.0% vac · 8.0% maint · 8.0% mgmt
Financing live
Cash to close
- Down payment
- $19,975
- Closing costs
- $2,397
- Reserves months
- —
- Total cash needed
- —
Loan-product check · same deal, 3 products live
Conventional
25% down · 7.5% · 30yr
- Down + closing
- —
- Monthly P&I
- —
- Monthly cashflow
- —
- DSCR
- —
- Eligible?
- —
Personal DTI + credit; lowest rate.
DSCR
20% down · 8.5% · 30yr
- Down + closing
- —
- Monthly P&I
- —
- Monthly cashflow
- —
- DSCR
- —
- Eligible?
- —
No personal income docs; deal must DSCR.
Hard money
10% down · 12.0% · 12mo
- Down + closing
- —
- Monthly P&I
- —
- Monthly cashflow
- —
- DSCR
- —
- Eligible?
- —
Short-term bridge; refi at stabilization.
Rent comps 18 comps
| Address | Beds | Baths | Sqft | Rent | $/sqft | DOM | Units | Dist |
|---|---|---|---|---|---|---|---|---|
| 1321 Lafayette Ct Anderson, IN | 3.0 | 1.5 | 962 | $1,350 | $1.40 | 10d | 1 | 0.42mi |
| 235 W School St Unit 235 Anderson, IN | 3.0 | 1.0 | 925 | $1,200 | $1.30 | 44d | 1 | 0.59mi |
| 1705 Lake Shore Dr Unit 1705G Anderson, IN | 2.0 | 2.0 | 912 | $1,229 | $1.35 | 18d | 1 | 0.97mi |
| 1705 Lake Shore Dr Unit 1705A Anderson, IN | 2.0 | 2.0 | 912 | $1,277 | $1.40 | 44d | 1 | 0.97mi |
| 1716 N Cross Lakes Cir Unit 1716KN Anderson, IN | 2.0 | 2.0 | 912 | $1,274 | $1.40 | 24d | 1 | 1.01mi |
| 1808 N Cross Lakes Cir Unit 1808HN Anderson, IN | 2.0 | 2.0 | 944 | $1,177 | $1.25 | 3d | 1 | 1.03mi |
| 1800 Cross Lakes Blvd Anderson, IN | 1.0–2.0 | 1.0–2.0 | 847 | $1,344 | $1.59 | 2d | 22 | 1.05mi |
| 1807 Lake Shore Dr Unit 1807K Anderson, IN | 2.0 | 2.0 | 912 | $1,344 | $1.47 | 44d | 1 | 1.05mi |
| 1812 N Cross Lakes Cir Unit 1812AN Anderson, IN | 2.0 | 2.0 | 912 | $1,229 | $1.35 | 44d | 1 | 1.06mi |
| 1708 S Cross Lakes Cir Unit 1708ES Anderson, IN | 2.0 | 2.0 | 944 | $1,115 | $1.18 | 44d | 1 | 1.08mi |
| 1805 S Cross Lakes Cir Unit 1805LS Anderson, IN | 2.0 | 2.0 | 912 | $1,294 | $1.42 | 12d | 1 | 1.09mi |
| 1804 S Cross Lakes Cir Unit 1804DS Anderson, IN | 2.0 | 2.0 | 944 | $1,144 | $1.21 | 44d | 1 | 1.12mi |
| 1912 N Cross Lakes Cir Unit 1912HN Anderson, IN | 2.0 | 2.0 | 944 | $1,174 | $1.24 | 12d | 1 | 1.14mi |
| 1812 S Cross Lakes Cir Unit 1812ES Anderson, IN | 2.0 | 2.0 | 944 | $1,115 | $1.18 | 15d | 1 | 1.15mi |
| 1904 S Cross Lakes Cir Unit 1904KS Anderson, IN | 2.0 | 2.0 | 912 | $1,183 | $1.30 | 44d | 1 | 1.19mi |
| 1904 S Cross Lakes Cir Unit 1904LS Anderson, IN | 2.0 | 2.0 | 912 | $1,309 | $1.44 | 44d | 1 | 1.19mi |
| 1724 Greenwood Dr Anderson, IN | 3.0 | 1.5 | 950 | $1,025 | $1.08 | 44d | 1 | 1.36mi |
| 506 W 2nd St Anderson, IN | 3.0 | 1.0 | 964 | $1,095 | $1.14 | 24d | 1 | 1.46mi |
Listing history 25 events
-
2026-06-18days on market $79,900 Active 82 DOM
-
2026-06-17days on market $79,900 Active 81 DOM
-
2026-06-16days on market $79,900 Active 80 DOM
-
2026-06-15days on market $79,900 Active 79 DOM
-
2026-06-13days on market $79,900 Active 77 DOM
-
2026-06-09days on market $79,900 Active 73 DOM
-
2026-06-08days on market $79,900 Active 72 DOM
-
2026-06-07days on market $79,900 Active 71 DOM
-
2026-06-05days on market $79,900 Active 68 DOM
-
2026-06-03days on market $79,900 Active 67 DOM
-
2026-06-02days on market $79,900 Active 66 DOM
-
2026-06-01days on market $79,900 Active 65 DOM
-
2026-05-31days on market $79,900 Active 64 DOM
-
2026-03-27$79,900 Active 244-char remark
Show marketing remark (240 chars)
Now vacant, was rented for $850 per month. 2 bedroom, 1 bath home featuring a fenced-in backyard, back patio, and covered front porch-great for outdoor enjoyment. Washer and dryer hookups are located in the basement for added convenience. P
-
2026-03-27$79,900 Active 240-char remark
Show marketing remark (240 chars)
Now vacant, was rented for $850 per month. 2 bedroom, 1 bath home featuring a fenced-in backyard, back patio, and covered front porch-great for outdoor enjoyment. Washer and dryer hookups are located in the basement for added convenience. P
-
2019-12-17soldstatus $25,000 Sold
-
2019-12-10$25,000 Active
-
2019-12-10status Pending
-
2017-04-03soldstatus $29,500 Sold
-
2017-03-30status Pending
-
2017-02-23$28,000 Active
-
2009-03-04historical
-
2008-09-03$59,900
-
2005-05-06soldstatus $31,000
-
2005-03-17$32,500
ⓘ Source: listings_history table (triggers on properties + properties_extension) + one-shot
backfill from property_details.listing_events for pre-trigger history.
Tax reassessment forecast IN · Partial reset (capped growth)
- Current annual tax
- $1,669 · $139/mo
- Projected year-2 tax
- $1,669 · $139/mo
- Expected delta
- $0/yr ($0/mo · 0.0%)
ⓘ Screening estimate from a state-policy table — verify with the county assessor before closing.
Climate risk First Street
- Flood 1/10 Low FEMA zone X (unshaded) · 0% chance over 30 yrs
- Wildfire 1/10 Low
- Heat 3/10 Moderate 7 d/yr ≥100°F today · 18 d/yr by 30 yrs out
- Wind 2/10 Low
- Air quality 3/10 Moderate 2 unhealthy d/yr today · 3 by 30 yrs out
Nearby sold comps map
Loading sold comps map…
Walkable amenities ~0.75 mi
Loading nearby amenities…
Taxation est. · year 1
- Rental income
- $15,136
- − Mortgage interest
- −$4,476
- − Property taxes
- −$1,669
- − Insurance
- −$400
- − Repairs & maintenance
- −$1,211
- − Management
- −$1,211
- − Depreciation
- −$2,324
- Taxable income
- $3,846
- Est. tax owed @ 24.0%
- −$923
- After-tax cash flow
- $3,938/yr
For passive investors: Depreciation is non-cash, so a rental often shows a tax loss while cash-flowing — sheltering income. Rental losses are passive: they offset passive income freely, and up to $25,000/yr can offset ordinary (W-2) income if you actively participate and your MAGI is under $100k (phasing out to $0 by $150k); unused losses carry forward. On sale, claimed depreciation is recaptured at up to 25%, and gains may owe capital-gains tax (a 1031 exchange can defer both). Figures are a year-1 estimate at your 24.0% rate — not tax advice; consult a CPA.
Schools (NCES district)
- District
- Anderson Community School Corporation
- NCES district ID
- 1800150
- Math proficiency
- 15% ▼ -14.00%
- Reading proficiency
- 23% ▼ -7.00%
- Median HH income
- $38,208
- Composite
- 15.93/100
- National rank
- #9250
- State rank
- #280 of 301 in IN
Livability — Anderson
- Score
- 60/100
- State rank
- #521
- US rank
- #18709
Category grades
Schools grade is shown separately in the Schools card above.
Census & demographics
- Census place
- Anderson, IN
- County
- Madison County · 69,445 people
- City population
- 57,762
- Metro
- Indianapolis-Carmel-Anderson, IN
- Population (ZIP)
- 20,855
- Household income
- $58,041
- Rent vs Own
- Severe rent burden
- 987.0
Population outlook (Madison County) Hauer SSP2
- Today (2025)
- 125,800 people
- By 2030
- 122,640 · -2.5%
- By 2040
- 115,420 · -8.3%
- By 2050
- 108,148 · -14.0%
- By 2075
- 91,838 · -27.0%
- By 2100
- 75,670 · -39.8%
Race, ethnicity, and origin ACS 2023
- Neighborhood character
- Predominantly White (85%)
- Race & ethnicity
- White 85% Hispanic / Latino 5% Two or more races 4% Black 4%
- Hispanic origin (detail)
- Mexican 4%
- Common ancestry
- Slovak 3% Serbian 2% Italian 1%
- Foreign-born
- 2% · Canada, Vietnam
- Languages at home
- 96% English-only · Spanish 3%
Political lean MEDSL · Madison
- 2024 margin
- Strong R (+26.9) · D 35.6% · R 62.5% · Other 1.9%
- 2008→2024 swing
- -33.5pp toward R · 2008: 6.5pp · 2024: -26.9pp
- All cycles
- 2024: R+26.9 2020: R+22.6 2016: R+25.7 2012: R+4.5 2008: D+6.5
Not yet ingested
- Civics
- —
Market trends
- HPI YoY
- ▼ -61.16%
- Current HPI
- 266.9819
- Rent YoY
- ▲ 1.82%
- Metro
- Indianapolis-Carmel-Anderson, IN
- State GDP YoY
- ▲ 2.90%
- F500 in state
- 18
Industry mix (Fortune 500 HQ in IN)
| Industry | F500 HQs | Revenue |
|---|---|---|
| Industrial Machinery | 2 | $37B |
|
||
| Healthcare | 1 | $177B |
|
||
| Pharmaceuticals | 1 | $45B |
|
||
| Metals / Steel | 1 | $18B |
|
||
| Agriculture | 1 | $17B |
|
||
| Packaging | 1 | $12B |
|
||
Price history
+145.8% since first listed12 events — show timeline
- 2026-03-27 Listed $79,900 MIBOR as Distributed by MLS Grid
- 2026-03-27 Listed $79,900 IRMLS
- 2019-12-17 Sold (MLS) $25,000 MIBOR as Distributed by MLS Grid
- 2019-12-10 Listed $25,000 MIBOR as Distributed by MLS Grid
- 2019-12-10 Pending — MIBOR as Distributed by MLS Grid
- 2017-04-03 Sold (MLS) $29,500 MIBOR as Distributed by MLS Grid
- 2017-03-30 Pending — MIBOR as Distributed by MLS Grid
- 2017-02-23 Listed $28,000 MIBOR as Distributed by MLS Grid
- 2009-03-04 Listing Removed — MIBOR as Distributed by MLS Grid
- 2008-09-03 Listed $59,900 MIBOR as Distributed by MLS Grid
- 2005-05-06 Sold (MLS) $31,000 MIBOR as Distributed by MLS Grid
- 2005-03-17 Listed $32,500 MIBOR as Distributed by MLS Grid
Property tax history
+4.3%/yrLatest (2024): $1,669 · +8.8% YoY. Source: county tax records.
Cash-flow waterfall
monthlySold comps — $/sqft
last 12 mo · ≤1 miLoading sold comps…