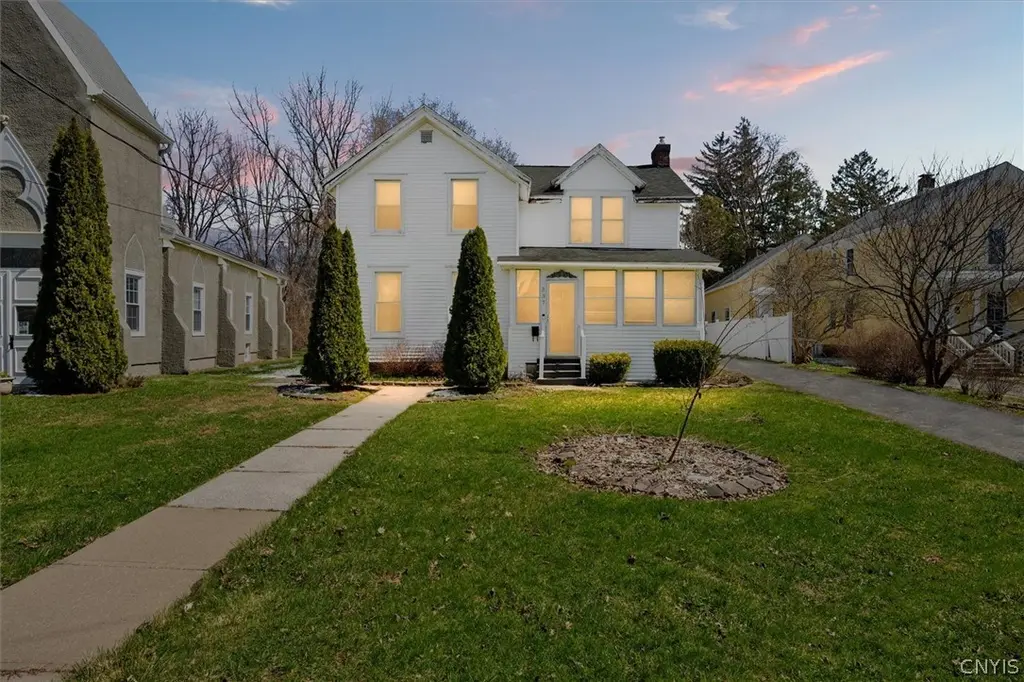
337 Macarthur Pkwy · Oneida, NY
Flood risk 1/10 · Minimal
- FEMA flood zone
- X (unshaded)
- Chance of flooding over 30 yrs
- 0.0%
- Est. flood insurance / yr
- $473 – $860
Fire risk 3/10 · Minor
- Est. fire insurance / yr
- $691 – $1,283
Heat risk 3/10 · Minor
- Hot days now (above 94°F)
- 7 days/yr
- Hot days in 30 yrs
- 17 days/yr
Wind risk 1/10 · Minimal
- Chance of severe wind over 30 yrs
- 0.0%
Air-quality risk 2/10 · Minimal
- Unhealthy air days now
- 0 days/yr
- Unhealthy air days in 30 yrs
- 2 days/yr
Risk factors via First Street. Map © Google.
Why this score? — see what drove the D grade
The composite is a weighted blend of 9 inputs, each scored 0–100. Each bar is that input's sub-score; the figure is the points it added to the 100-point composite (weight × sub-score).
- ARV discount +15.0/15.0
- Cash flow +9.3/30.0
- Schools +4.1/10.0
- 1% rule +3.4/10.0
- Livability +3.1/5.0
- DSCR +2.6/10.0
- Rent growth +2.5/5.0
- Condition / age +2.5/5.0
- Appreciation +0.0/10.0
$184,900
🖨 Deal sheet (PDF) 📄 Offer letter ✓ Due diligence
Listing remarks MLS
Step back in time , Charming Colonial handicap accessible 3 bedroom 2 bath Colonial . Property sold as is seller does not pay for abstract or survey.
Key facts
- Formal dining room
- Historic charm
- Enclosed porch
Tags
Neighborhood map
What this means for you Summary
Snapshot
- This is a 3-bed/2.0-bath single-family listed at $185k.
Deal economics
- At list price, monthly cash flow is $-136 ($-2k/yr) — negative.
- To cash-flow at today's rent, offer at most $161k (13.0% below list).
- To meet the 1% rule (rent ≥ 1% of price), the offer needs to be $155k (16.1% below list).
- Recommended offer: $155k (16.1% below list) — sets the bar for 1% rule.
- Cap rate 5.4% vs local median 4.0% in Oneida — top-decile yield for the area; either an underpriced asset or a hidden risk that comps aren't pricing in. Stress-test before assuming the spread holds.
Location & tenants
- Location reads 61/100 on livability (#924 in NY) — a middle-class / working-renter tenant base. Strengths: cost of living A+, housing A+; Watch: schools C-, employment C-, health & safety C-.
- Oneida City School District (town): math 43% / reading 54% proficiency, ranked #421 of 590 in NY (top 71%) — families likely to look elsewhere, expect single-tenant / working-renter base with shorter leases.
- Market conditions: 67 active listings in the ZIP; 137 units permitted in Madison County in 2024 (46 in 5+ unit buildings).
Forward outlook
- Local home prices are declining (-3.0%/yr); year-one equity from $1k of loan paydown is wiped out by about $6k of value loss. Plan a longer hold.
- Madison County population projected at -24% by 2050 — secular population decline; favor cash flow + early exit over multi-decade hold.
Negotiation context
- Only 5 days on market — expect competitive offers; lowballing is unlikely to land.
- 2 sale attempts since 12y ago with the ask held roughly flat each time — persistent listings suggest the price (not the market) is what's stuck; bring a comps-based counter.
- Current owner paid $52k; list at $185k implies a 256% gain — meaningful room to come down on a strong offer.
Risks & watch-outs
- Watch-outs: built in 1920 — expect roof / HVAC / electrical / plumbing capex.
Questions for the listing agent
- What do current leases actually rent for vs. the listed asking? Can we see a recent rent roll and the last 12 months of T-12 income?
- Built in 1920 — when were the roof, HVAC, electrical panel, plumbing, and water heater last replaced?
- Is there a deadline driving the sale (1031 exchange, divorce, estate, relocation)? That informs how much negotiation room exists.
- Crime grade is F in this area — have there been break-ins, vandalism, or insurance claims at this property in the last 3 years? What carrier currently insures it and at what premium?
- The area grade is low — what's the realistic commute time and amenity access for the typical tenant pool here? Any planned neighborhood developments (good or bad) we should know about?
- What's the average days-on-market for RENTAL listings here right now (not sales)? A rising rental-DOM trend means longer vacancies and softer asking-rent achievability than the comps imply.
- What's the recent tenant-quality profile in this submarket — average credit score on applications, eviction rate, late-payment / NSF rate, and stable-employment percentage? A property-management company in the area should have these aggregated.
- How much new for-sale + rental construction is in the pipeline within 1–3 miles? Heavy new supply typically softens prices + rents 12–24 months out; constrained supply supports both.
Investment metrics
- 1% rule
- 0.84% ✗
- Cap rate
- 5.41%
- Cash-on-cash
- -3.16%
- DSCR
- 0.86
- GRM
- 9.9
CMA / ARV
- ARV (on-the-fly)
- $251,328
- Comps found
- 12
Show comp detail 12 sales within ~0.75 mi
| Address | Dist | Beds/Ba | Sqft | Sold | Price | $/sf | Match |
|---|---|---|---|---|---|---|---|
| 308 Seneca St | 0.29mi | 3/1.5 | 2,194 (+4%) | 10mo | $209,500 | $95 | 70 |
| 312 Stone St | 0.27mi | 4/2.0 (+1) | 1,937 (-8%) | 4mo | $230,000 | $119 | 66 |
| 461 Elizabeth St | 0.41mi | 3/1.5 | 2,104 (-0%) | 15mo | $172,000 | $82 | 66 |
| 220 W Elm St | 0.50mi | 3/1.5 | 2,070 (-2%) | 9mo | $155,000 | $75 | 64 |
| 256 E Walnut St | 0.26mi | 4/2.0 (+1) | 2,267 (+7%) | 9mo | $230,000 | $101 | 63 |
| 457 Broad St | 0.48mi | 3/1.5 | 2,007 (-5%) | 11mo | $280,900 | $140 | 58 |
| 531 Broad St | 0.57mi | 4/1.5 (+1) | 2,247 (+6%) | 5mo | $289,900 | $129 | 52 |
| 232 West St | 0.26mi | 4/1.0 (+1) | 1,804 (-15%) | 5mo | $215,000 | $119 | 51 |
| 212 Bates Ave | 0.31mi | 4/1.5 (+1) | 1,907 (-10%) | 18mo | $88,468 | $46 | 48 |
| 228 Belmont Ave | 0.47mi | 4/1.5 (+1) | 1,864 (-12%) | 11mo | $249,900 | $134 | 42 |
| 269 Belmont Ave | 0.55mi | 4/2.5 (+1) | 1,924 (-9%) | 14mo | $331,000 | $172 | 41 |
| 445 Cleveland Ave | 0.67mi | 4/1.0 (+1) | 1,806 (-14%) | 14mo | $206,000 | $114 | 24 |
Match score weights: distance 35% · size 25% · config 20% · recency 20%. Top-matched comps best support the ARV.
Projected returns pro-forma
-3.0% appreciation · 3.0% rent growth · sell at horizon
- IRR
- -21.5%
- Equity multiple
- 0.26×
- Total profit
- $-38,567
- Equity at exit
- $27,569
- IRR
- -15.1%
- Equity multiple
- 0.14×
- Total profit
- $-44,456
- Equity at exit
- $15,987
Cash invested: $51,772 (down + closing). Projections, not guarantees.
Landlord ↔ Tenant lean methodology
- Overall (STATE)
- 15 Strongly Tenant-Friendly
- State New York
- 15 Strongly Tenant-Friendly · D+10
- County
- — inherits STATE
- City
- — inherits STATE
ZIP-level market 13421
- Home prices YoY
- -5.1%
- Active inventory
- 67
- Price-to-rent
- 9.9×
Monthly cashflow live
- Estimated rent
- $1,551 medium interval (Pro) →
- Mortgage (P&I)
- −$970
- Tax from tax record
- −$315 /mo · $3,781/yr
- Insurance
- −$77
- HOA
- −$0
- Vacancy / Maint / Mgmt
- −$326
- Net cashflow
- $-136
Break-even live
Sensitivity live
| Price | -10% $-32 | -5% $-84 | +0% $-136 | +5% $-189 | +10% $-241 |
|---|---|---|---|---|---|
| Rent | -10% $-259 | -5% $-198 | +0% $-136 | +5% $-75 | +10% $-14 |
| Rate | -1.0pp $-43 | -0.5pp $-89 | base $-136 | +0.5pp $-184 | +1.0pp $-233 |
UW: 25.0% down · 7.5% · 30yr · 1.5% tax · 5.0% vac · 8.0% maint · 8.0% mgmt
Financing live
Cash to close
- Down payment
- $46,225
- Closing costs
- $5,547
- Reserves months
- —
- Total cash needed
- —
Loan-product check · same deal, 3 products live
Conventional
25% down · 7.5% · 30yr
- Down + closing
- —
- Monthly P&I
- —
- Monthly cashflow
- —
- DSCR
- —
- Eligible?
- —
Personal DTI + credit; lowest rate.
DSCR
20% down · 8.5% · 30yr
- Down + closing
- —
- Monthly P&I
- —
- Monthly cashflow
- —
- DSCR
- —
- Eligible?
- —
No personal income docs; deal must DSCR.
Hard money
10% down · 12.0% · 12mo
- Down + closing
- —
- Monthly P&I
- —
- Monthly cashflow
- —
- DSCR
- —
- Eligible?
- —
Short-term bridge; refi at stabilization.
Listing history 5 events
-
2026-04-16status Pending
-
2026-04-10$184,900 Active
-
2014-06-06soldstatus $52,000 150-char remark
Show marketing remark (150 chars)
Step back in time , Charming Colonial handicap accessible 3 bedroom 2 bath Colonial . Property sold as is seller does not pay for abstract or survey.
-
2014-02-15$54,900 150-char remark
Show marketing remark (150 chars)
Step back in time , Charming Colonial handicap accessible 3 bedroom 2 bath Colonial . Property sold as is seller does not pay for abstract or survey.
-
2006-10-06soldstatus $82,000
ⓘ Source: listings_history table (triggers on properties + properties_extension) + one-shot
backfill from property_details.listing_events for pre-trigger history.
Tax reassessment forecast NY · Partial reset (capped growth)
- Current annual tax
- $3,781 · $315/mo
- Projected year-2 tax
- $3,781 · $315/mo
- Expected delta
- $0/yr ($0/mo · 0.0%)
ⓘ Screening estimate from a state-policy table — verify with the county assessor before closing.
Climate risk First Street
- Flood 1/10 Low FEMA zone X (unshaded) · 0% chance over 30 yrs
- Wildfire 3/10 Moderate
- Heat 3/10 Moderate 7 d/yr ≥94°F today · 17 d/yr by 30 yrs out
- Wind 1/10 Low 0% chance of damaging wind over 30 yrs
- Air quality 2/10 Low 0 unhealthy d/yr today · 2 by 30 yrs out
Nearby sold comps map
Loading sold comps map…
Walkable amenities ~0.75 mi
Loading nearby amenities…
Taxation est. · year 1
- Rental income
- $18,615
- − Mortgage interest
- −$10,357
- − Property taxes
- −$3,781
- − Insurance
- −$924
- − Repairs & maintenance
- −$1,489
- − Management
- −$1,489
- − Depreciation
- −$5,379
- Taxable loss
- −$4,805
- Est. tax savings @ 24.0%
- +$1,153
- After-tax cash flow
- $-482/yr
For passive investors: Depreciation is non-cash, so a rental often shows a tax loss while cash-flowing — sheltering income. Rental losses are passive: they offset passive income freely, and up to $25,000/yr can offset ordinary (W-2) income if you actively participate and your MAGI is under $100k (phasing out to $0 by $150k); unused losses carry forward. On sale, claimed depreciation is recaptured at up to 25%, and gains may owe capital-gains tax (a 1031 exchange can defer both). Figures are a year-1 estimate at your 24.0% rate — not tax advice; consult a CPA.
Schools (NCES district)
- District
- Oneida City School District
- NCES district ID
- 3600013
- Math proficiency
- 43% ▼ -11.00%
- Reading proficiency
- 54% ▲ 12.00%
- Median HH income
- $45,791
- Composite
- 41.1/100
- National rank
- #3568
- State rank
- #421 of 590 in NY
Livability — Oneida
- Score
- 61/100
- State rank
- #924
- US rank
- #18033
Category grades
Schools grade is shown separately in the Schools card above.
Census & demographics
- Census place
- Oneida, NY
- City population
- 12,742
- Population (ZIP)
- 12,742
Population outlook (Madison County) Hauer SSP2
- Today (2025)
- 69,528 people
- By 2030
- 66,599 · -4.2%
- By 2040
- 59,814 · -14.0%
- By 2050
- 52,842 · -24.0%
- By 2075
- 39,167 · -43.7%
- By 2100
- 28,442 · -59.1%
Race, ethnicity, and origin ACS 2023
- Neighborhood character
- Predominantly White (92%)
- Race & ethnicity
- White 92% Two or more races 4% Hispanic / Latino 3%
- Common ancestry
- Lithuanian 5% Romanian 4% Iranian 2%
- Foreign-born
- 1% · Canada, China
- Languages at home
- 97% English-only · Spanish 1% Other Indo-European 1%
Political lean MEDSL · Madison
- 2024 margin
- R (+13.1) · D 43.5% · R 56.5%
- 2008→2024 swing
- -13.9pp toward R · 2008: 0.9pp · 2024: -13.1pp
- All cycles
- 2024: R+13.1 2020: R+10.6 2016: R+15.9 2012: D+0.3 2008: D+0.9
Not yet ingested
- Civics
- —
Market trends
- HPI YoY
- ▼ -13.30%
- Current HPI
- 248.3909
- Rent YoY
- —
- Metro
- —
- State GDP YoY
- ▲ 2.60%
- F500 in state
- 92
Industry mix (Fortune 500 HQ in NY)
| Industry | F500 HQs | Revenue |
|---|---|---|
| Financial Services | 10 | $950B |
|
||
| Consumer Goods | 9 | $162B |
|
||
| Insurance | 4 | $225B |
|
||
| Telecommunications | 2 | $144B |
|
||
| Pharmaceuticals | 2 | $112B |
|
||
| Media / Entertainment | 2 | $69B |
|
||
Price history
+125.5% since first listed5 events — show timeline
- 2026-04-16 Pending — CNYIS
- 2026-04-10 Listed $184,900 CNYIS
- 2014-06-06 Sold (MLS) $52,000 CNYIS
- 2014-02-15 Listed $54,900 CNYIS
- 2006-10-06 Sold (Public Records) $82,000 Public Records
Property tax history
+2.5%/yrLatest (2025): $3,781 · +0.2% YoY. Source: county tax records.
Cash-flow waterfall
monthlySold comps — $/sqft
last 12 mo · ≤1 miLoading sold comps…