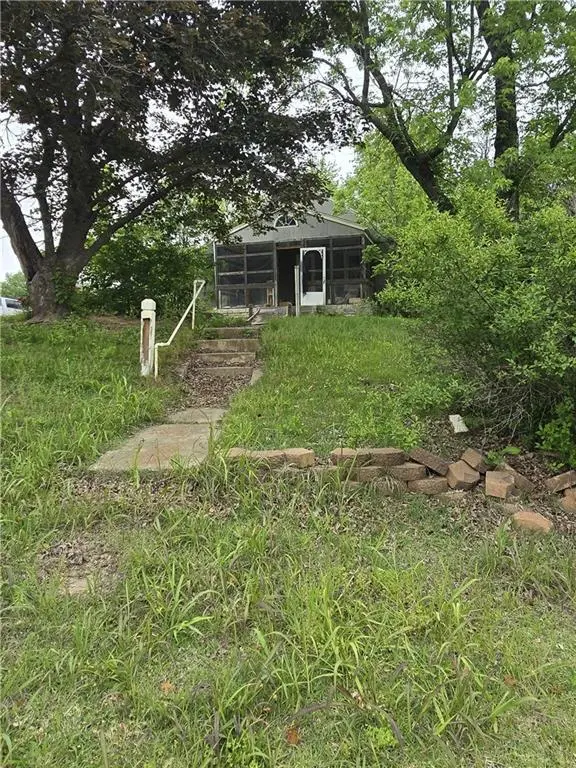
33660 W 83rd St · De Soto, KS
Flood risk 1/10 · Minimal
- FEMA flood zone
- X (unshaded)
- Chance of flooding over 30 yrs
- 0.0%
- Est. flood insurance / yr
- $473 – $860
Fire risk 4/10 · Minor
- Est. fire insurance / yr
- $1,154 – $2,142
Heat risk 4/10 · Minor
- Hot days now (above 108°F)
- 7 days/yr
- Hot days in 30 yrs
- 17 days/yr
Wind risk 2/10 · Minimal
- Chance of severe wind over 30 yrs
- —
Air-quality risk 2/10 · Minimal
- Unhealthy air days now
- 2 days/yr
- Unhealthy air days in 30 yrs
- 2 days/yr
Risk factors via First Street. Map © Google.
Why this score? — see what drove the B grade
The composite is a weighted blend of 9 inputs, each scored 0–100. Each bar is that input's sub-score; the figure is the points it added to the 100-point composite (weight × sub-score).
- Cash flow +30.0/30.0
- 1% rule +10.0/10.0
- DSCR +10.0/10.0
- ARV discount +7.5/15.0
- Schools +4.8/10.0
- Livability +3.1/5.0
- Rent growth +2.5/5.0
- Condition / age +2.5/5.0
- Appreciation +0.0/10.0
$130,000
🖨 Deal sheet (PDF) 📄 Offer letter ✓ Due diligence
Listing remarks
Charming opportunity in the heart of De Soto! This 3-bedroom, 2-bath home at 33660 W 83rd Street offers over 1,200 square feet of living space on a spacious, tree-lined lot. Conveniently located with quick access to local schools, parks, and commuter routes, this property is packed with potential. Investors come take a look.
Key facts
- Tree lined lot
- 8,059 sq ft lot
- Garage
Tags
Property features AI
Finance
- HOA & community: No association fees
Exterior
- Parking: Attached garage (1 car)
- Utilities: Public water; Public sewer; Cable available; Fiber available; High-speed internet available
- Home design: Single-family residence; Ranch floor plan; Attached property
- Construction: Frame construction; Composition roof; Estimated age: 76–100 years; Has basement
- Exterior features: Covered patio; City lot within city limits; Wooded lot; Paved road with public maintenance
Interior
- Kitchen: Gas range
- Bedrooms: 3 bedrooms
- Bathrooms: 2 full bathrooms
- Heating & cooling: Forced air heating; Electric cooling (central)
- Interior features: Gas range; Unfinished basement
Neighborhood map
What this means for you Summary
Snapshot
- This is a 3-bed/2.0-bath single-family listed at $130k.
Deal economics
- At list price, monthly cash flow is $732 ($9k/yr) — positive.
- The deal already cash-flows at list — no discount required.
- Meets the 1% rule at list price ($2k rent vs $130k).
- Cap rate 13.1% vs local median 2.6% in De Soto — top-decile yield for the area; either an underpriced asset or a hidden risk that comps aren't pricing in. Stress-test before assuming the spread holds.
Location & tenants
- Location reads 62/100 on livability (#391 in KS) — a middle-class / working-renter tenant base. Strengths: housing A+, cost of living A, crime A-; Watch: employment C-, amenities F, commute F.
- De Soto (suburban): math 49% / reading 53% proficiency, ranked #3 of 169 in KS (top 2%) — acceptable for families but not a draw, mixed tenant base, ~2y average lease; only 10% free/reduced lunch — higher-income household profile.
- Zoned schools: De Soto High School (math 48% / reading 40%, grade F, #7 of 327 statewide, top 2%, 997 students, 20% FRL).
- Market conditions: 58 active listings in the ZIP; 16 comparable units currently listed for rent nearby; rentals leasing fast (median 3d on market — plan ~1-2 weeks tenant-placement turnaround); solid renter incomes; 2,969 units permitted in Johnson County in 2024 (1,066 in 5+ unit buildings).
Forward outlook
- Local home prices are declining (-3.0%/yr); year-one equity from $899 of loan paydown is wiped out by about $4k of value loss. Plan a longer hold.
- Johnson County population projected at +27% by 2050 — long-run rental-demand tailwind backs the buy-and-hold thesis.
- At projected returns (-3.0% appreciation + 3.0% rent growth), your $36k cash investment doubles in ~6 years — after that, you're playing with house money.
Negotiation context
- Only 1 days on market — expect competitive offers; lowballing is unlikely to land.
Risks & watch-outs
- Watch-outs: built in 1948 — expect roof / HVAC / electrical / plumbing capex.
Questions for the listing agent
- Built in 1948 — when were the roof, HVAC, electrical panel, plumbing, and water heater last replaced?
- Is there a deadline driving the sale (1031 exchange, divorce, estate, relocation)? That informs how much negotiation room exists.
- Schools are D-rated, which usually means shorter tenancies and higher turnover. Who's the typical renter profile here, and what's been the actual vacancy rate?
- What's the average days-on-market for RENTAL listings here right now (not sales)? A rising rental-DOM trend means longer vacancies and softer asking-rent achievability than the comps imply.
- What's the recent tenant-quality profile in this submarket — average credit score on applications, eviction rate, late-payment / NSF rate, and stable-employment percentage? A property-management company in the area should have these aggregated.
- How much new for-sale + rental construction is in the pipeline within 1–3 miles? Heavy new supply typically softens prices + rents 12–24 months out; constrained supply supports both.
Investment metrics
- 1% rule
- 1.66% ✓
- Cap rate
- 13.05%
- Cash-on-cash
- 24.14%
- DSCR
- 2.07
- GRM
- 5.0
CMA / ARV
- ARV (on-the-fly)
- $269,232
- Comps found
- 12
Show comp detail 12 sales within ~0.75 mi
| Address | Dist | Beds/Ba | Sqft | Sold | Price | $/sf | Match |
|---|---|---|---|---|---|---|---|
| 8200 Sunset Dr | 0.10mi | 3/2.0 | 1,452 (+15%) | 0mo | $310,000 | $213 | 70 |
| 8718 Golden Ln | 0.50mi | 3/2.0 | 1,388 (+10%) | 4mo | $295,000 | $213 | 57 |
| 33242 W 88th Ter | 0.67mi | 3/2.5 | 1,247 (-1%) | 10mo | $295,000 | $237 | 56 |
| 33775 Valleyview St | 0.54mi | 4/2.0 (+1) | 1,375 (+9%) | 2mo | $315,000 | $229 | 53 |
| 32900 W 83rd St | 0.47mi | 3/1.0 | 1,317 (+4%) | 23mo | $230,000 | $175 | 48 |
| 32640 W 82nd St | 0.64mi | 3/1.0 | 1,122 (-11%) | 1mo | $100,000 | $89 | 47 |
| 8812 Golden Ln | 0.60mi | 3/2.0 | 1,076 (-15%) | 1mo | $295,000 | $274 | 46 |
| 32975 W 83rd St | 0.45mi | 3/1.0 | 1,182 (-6%) | 22mo | $220,000 | $186 | 45 |
| 8844 Golden Ln | 0.67mi | 3/2.0 | 1,427 (+13%) | 7mo | $299,000 | $210 | 41 |
| 33342 W 87th Ter | 0.60mi | 3/2.5 | 1,357 (+7%) | 21mo | $275,000 | $203 | 40 |
| 33182 W 87 Cir | 0.59mi | 3/3.0 | 1,426 (+13%) | 9mo | $320,000 | $224 | 40 |
| 33132 W 87th Ter | 0.64mi | 4/3.0 (+1) | 1,426 (+13%) | 17mo | $325,000 | $228 | 26 |
Match score weights: distance 35% · size 25% · config 20% · recency 20%. Top-matched comps best support the ARV.
Projected returns pro-forma
-3.0% appreciation · 3.0% rent growth · sell at horizon
- IRR
- 17.4%
- Equity multiple
- 1.70×
- Total profit
- $25,658
- Equity at exit
- $19,383
- IRR
- 25.9%
- Equity multiple
- 3.27×
- Total profit
- $82,725
- Equity at exit
- $11,240
Cash invested: $36,400 (down + closing). Projections, not guarantees.
Landlord ↔ Tenant lean methodology
- Overall (STATE)
- 83 Strongly Landlord-Friendly
- State Kansas
- 83 Strongly Landlord-Friendly · R+10
- County
- — inherits STATE
- City
- — inherits STATE
ZIP-level market 66018
- Home prices YoY
- -29.8%
- Active inventory
- 58
- Price-to-rent
- 5.0×
Monthly cashflow live
- Estimated rent
- $2,159 high interval (Pro) →
- Mortgage (P&I)
- −$682
- Tax from tax record
- −$238 /mo · $2,853/yr
- Insurance
- −$54
- HOA
- −$0
- Vacancy / Maint / Mgmt
- −$453
- Net cashflow
- $732
Break-even live
Sensitivity live
| Price | -10% $806 | -5% $769 | +0% $732 | +5% $696 | +10% $659 |
|---|---|---|---|---|---|
| Rent | -10% $562 | -5% $647 | +0% $732 | +5% $818 | +10% $903 |
| Rate | -1.0pp $798 | -0.5pp $765 | base $732 | +0.5pp $699 | +1.0pp $664 |
UW: 25.0% down · 7.5% · 30yr · 1.5% tax · 5.0% vac · 8.0% maint · 8.0% mgmt
Financing live
Cash to close
- Down payment
- $32,500
- Closing costs
- $3,900
- Reserves months
- —
- Total cash needed
- —
Loan-product check · same deal, 3 products live
Conventional
25% down · 7.5% · 30yr
- Down + closing
- —
- Monthly P&I
- —
- Monthly cashflow
- —
- DSCR
- —
- Eligible?
- —
Personal DTI + credit; lowest rate.
DSCR
20% down · 8.5% · 30yr
- Down + closing
- —
- Monthly P&I
- —
- Monthly cashflow
- —
- DSCR
- —
- Eligible?
- —
No personal income docs; deal must DSCR.
Hard money
10% down · 12.0% · 12mo
- Down + closing
- —
- Monthly P&I
- —
- Monthly cashflow
- —
- DSCR
- —
- Eligible?
- —
Short-term bridge; refi at stabilization.
Rent comps 16 comps
| Address | Beds | Baths | Sqft | Rent | $/sqft | DOM | Units | Dist |
|---|---|---|---|---|---|---|---|---|
| 8530 Kickapoo St Unit 8530 De Soto, KS | 3.0 | 2.5 | 1603 | $2,395 | $1.49 | 12d | 1 | 0.27mi |
| 8544 Kickapoo St Unit 8544 De Soto, KS | 3.0 | 2.5 | 1603 | $2,395 | $1.49 | 2d | 1 | 0.27mi |
| 8536 Kickapoo St Unit 8536 De Soto, KS | 3.0 | 2.5 | 1603 | $2,395 | $1.49 | 12d | 1 | 0.27mi |
| 8524 Kickapoo St De Soto, KS | 3.0 | 2.5 | 1603 | $2,395 | $1.49 | 2d | 1 | 0.27mi |
| 8528 Kickapoo St Unit 8528 De Soto, KS | 3.0 | 2.5 | 1624 | $2,395 | $1.47 | 24d | 1 | 0.30mi |
| 8534 Kickapoo St Unit 8534 De Soto, KS | 3.0 | 2.5 | 1624 | $2,395 | $1.47 | 2d | 1 | 0.31mi |
| 8542 Kickapoo St Unit 8542 De Soto, KS | 3.0 | 2.5 | 1624 | $2,395 | $1.47 | 24d | 1 | 0.31mi |
| 8517 Hammond St Unit 9D De Soto, KS | 3.0 | 3.5 | 1723 | $2,295 | $1.33 | 2d | 1 | 0.37mi |
| 33065 W 82nd St Unit A De Soto, KS | 3.0 | 2.5 | 1559 | $2,050 | $1.31 | 8d | 1 | 0.41mi |
| 8687 Golden Ln Unit B De Soto, KS | 3.0 | 2.5 | 1800 | $1,895 | $1.05 | 18d | 1 | 0.56mi |
| 34040 W 90th St De Soto, KS | 3.0 | 1.0–2.0 | 936 | $1,995 | $2.13 | 2d | 183 | 0.74mi |
| 9100 Commerce Dr De Soto, KS | 1.0–2.0 | 1.0–2.0 | 845 | $1,500 | $1.78 | 2d | 10 | 0.92mi |
| 34000 W 91st Ter De Soto, KS | 2.0 | 2.0 | 1000 | $1,500 | $1.50 | 2d | 1 | 1.02mi |
| 8377 Valley Spring Dr Unit 1 De Soto, KS | 3.0 | 2.5 | 1700 | $2,375 | $1.40 | 2d | 1 | 1.22mi |
| 8377 Valley Spring Dr De Soto, KS | 3.0 | 2.0 | 1700 | $2,375 | $1.40 | 2d | 1 | 1.26mi |
| 8437 Valley Spring Dr De Soto, KS | 3.0 | 2.0 | 1700 | $2,300 | $1.35 | 2d | 1 | 1.27mi |
Listing history 3 events
-
2026-05-10status Pending
-
2026-05-08$130,000 Active
-
2005-03-02soldstatus
ⓘ Source: listings_history table (triggers on properties + properties_extension) + one-shot
backfill from property_details.listing_events for pre-trigger history.
Tax reassessment forecast KS · Resets to sale price
- Current annual tax
- $2,853 · $238/mo
- Projected year-2 tax
- $2,853 · $238/mo
- Expected delta
- $0/yr ($0/mo · 0.0%)
ⓘ Screening estimate from a state-policy table — verify with the county assessor before closing.
Climate risk First Street
- Flood 1/10 Low FEMA zone X (unshaded) · 0% chance over 30 yrs
- Wildfire 4/10 Moderate
- Heat 4/10 Moderate 7 d/yr ≥108°F today · 17 d/yr by 30 yrs out
- Wind 2/10 Low
- Air quality 2/10 Low 2 unhealthy d/yr today · 2 by 30 yrs out
Nearby sold comps map
Loading sold comps map…
Walkable amenities ~0.75 mi
Loading nearby amenities…
Taxation est. · year 1
- Rental income
- $25,914
- − Mortgage interest
- −$7,282
- − Property taxes
- −$2,853
- − Insurance
- −$650
- − Repairs & maintenance
- −$2,073
- − Management
- −$2,073
- − Depreciation
- −$3,782
- Taxable income
- $7,201
- Est. tax owed @ 24.0%
- −$1,728
- After-tax cash flow
- $7,060/yr
For passive investors: Depreciation is non-cash, so a rental often shows a tax loss while cash-flowing — sheltering income. Rental losses are passive: they offset passive income freely, and up to $25,000/yr can offset ordinary (W-2) income if you actively participate and your MAGI is under $100k (phasing out to $0 by $150k); unused losses carry forward. On sale, claimed depreciation is recaptured at up to 25%, and gains may owe capital-gains tax (a 1031 exchange can defer both). Figures are a year-1 estimate at your 24.0% rate — not tax advice; consult a CPA.
Schools (NCES district)
- District
- De Soto
- NCES district ID
- 2005490
- Math proficiency
- 49% ▼ -1.00%
- Reading proficiency
- 53% ▼ -1.00%
- Median HH income
- $96,361
- Composite
- 48.04/100
- National rank
- #2192
- State rank
- #3 of 169 in KS
Livability — De Soto
- Score
- 62/100
- State rank
- #391
- US rank
- #17209
Category grades
Schools grade is shown separately in the Schools card above.
Census & demographics
- Census place
- De Soto, KS
- County
- Johnson County · 574,662 people
- City population
- 6,584
- Metro
- Kansas City, MO-KS
- Population (ZIP)
- 6,584
- Household income
- $105,357
- Rent vs Own
- Severe rent burden
- 174.0
Population outlook (Johnson County) Hauer SSP2
- Today (2025)
- 663,396 people
- By 2030
- 702,585 · +5.9%
- By 2040
- 775,386 · +16.9%
- By 2050
- 841,772 · +26.9%
- By 2075
- 994,137 · +49.9%
- By 2100
- 1,073,036 · +61.7%
Race, ethnicity, and origin ACS 2023
- Neighborhood character
- Predominantly White (82%)
- Race & ethnicity
- White 82% Hispanic / Latino 9% Two or more races 6% Black 2% Asian 1%
- Hispanic origin (detail)
- Mexican 8% Puerto Rican 2%
- Common ancestry
- Italian 6% Lithuanian 5% Iranian 1%
- Foreign-born
- 7% · Canada, Vietnam
- Languages at home
- 91% English-only · Spanish 6% Other Asian/Pacific 1% German/W. Germanic 1%
Political lean MEDSL · Johnson
- 2024 margin
- Lean D (+8.5) · D 53.4% · R 44.9% · Other 1.8%
- 2008→2024 swing
- +17.5pp toward D · 2008: -9.0pp · 2024: 8.5pp
- All cycles
- 2024: D+8.5 2020: D+8.2 2016: R+2.7 2012: R+17.8 2008: R+9.0
Not yet ingested
- Civics
- —
Market trends
- HPI YoY
- ▼ -108.97%
- Current HPI
- 256.2394
- Rent YoY
- —
- Metro
- Kansas City, MO-KS
- State GDP YoY
- —
- F500 in state
- 0
Price history
3 events — show timeline
- 2026-05-10 Pending — Heartland MLS as Distributed by MLS Grid
- 2026-05-08 Listed $130,000 Heartland MLS as Distributed by MLS Grid
- 2005-03-02 Sold (Public Records) — Public Records
Property tax history
+6.7%/yrLatest (2025): $2,853 · +5.1% YoY. Source: county tax records.
Cash-flow waterfall
monthlySold comps — $/sqft
last 12 mo · ≤1 miLoading sold comps…