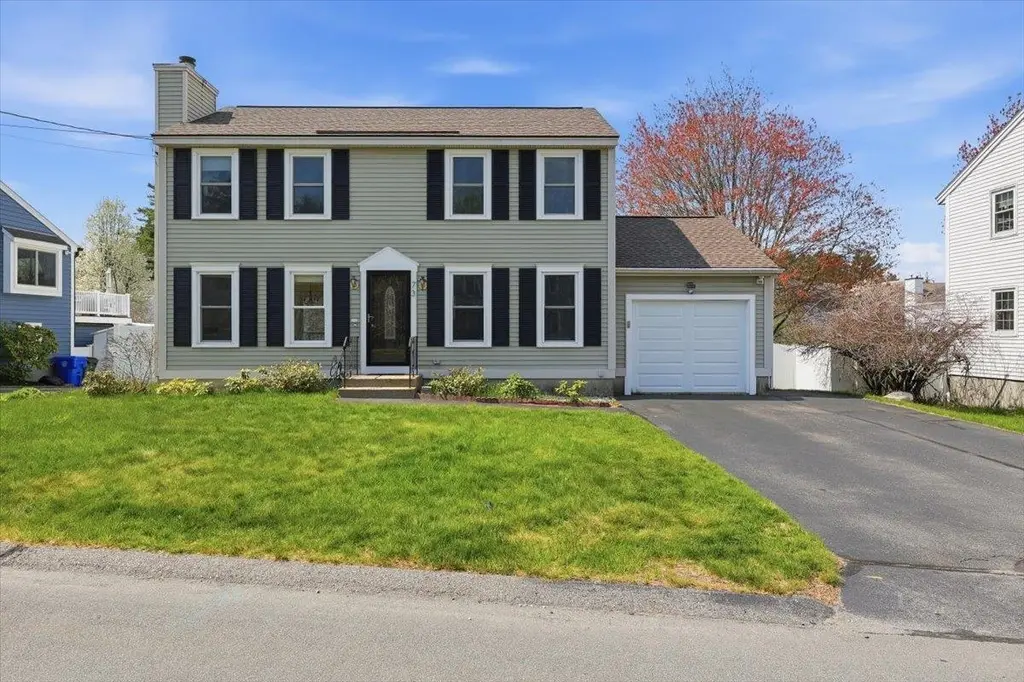
73 Megan Dr · Manchester, NH
Flood risk 1/10 · Minimal
- FEMA flood zone
- X (unshaded)
- Chance of flooding over 30 yrs
- 0.0%
- Est. flood insurance / yr
- $507 – $1,088
Fire risk 3/10 · Minor
- Est. fire insurance / yr
- $507 – $941
Heat risk 4/10 · Minor
- Hot days now (above 96°F)
- 7 days/yr
- Hot days in 30 yrs
- 15 days/yr
Wind risk 5/10 · Moderate
- Chance of severe wind over 30 yrs
- 25.0%
Air-quality risk 2/10 · Minimal
- Unhealthy air days now
- 1 days/yr
- Unhealthy air days in 30 yrs
- 2 days/yr
Risk factors via First Street. Map © Google.
Why this score? — see what drove the B- grade
The composite is a weighted blend of 9 inputs, each scored 0–100. Each bar is that input's sub-score; the figure is the points it added to the 100-point composite (weight × sub-score).
- Cash flow +30.0/30.0
- ARV discount +10.3/15.0
- DSCR +10.0/10.0
- 1% rule +8.7/10.0
- Livability +4.2/5.0
- Rent growth +2.5/5.0
- Condition / age +2.5/5.0
- Schools +1.9/10.0
- Appreciation +0.0/10.0
$549,000
🖨 Deal sheet 📄 Offer letter ✓ Due diligence
Listing remarks MLS
NOTHING TO DO! ! ! ! Move right into this LARGE Colonial with 3-4 BRs, 2 baths, fireplace, hardwood, and MUCH MORE!! GREAT neighborhood, large fenced rear yard with pool, house is in immaculate condition!! THIS WILL NOT LAST!!!
Key facts
- Finished basement
- Updated roof
- Fully fenced yard
Tags
Property features AI
Exterior
- Parking: 1-car garage
- Utilities: Public water; Public sewer; Circuit breaker electrical service; Cable internet available
- Home design: Colonial style; Existing construction; Facing direction: Unknown
- Construction: Built in 1993; Other construction materials; Shingle (architectural) roof
- Exterior features: Paved driveway; Lot features: Other
Interior
- Bathrooms: 1 full bathroom; 1 three-quarter bathroom
- Heating & cooling: Forced air heating; Central air conditioning
- Interior features: 9 total rooms; Basement with walk-up access and bulkhead
Neighborhood map
What this means for you Summary
Snapshot
- This is a 3-bed/2.0-bath single-family listed at $549k.
Deal economics
- At list price, monthly cash flow is $2k ($27k/yr) — positive.
- The deal already cash-flows at list — no discount required.
- Meets the 1% rule at list price ($7k rent vs $549k).
- Cap rate 11.2% vs local median 3.1% in Manchester — top-decile yield for the area; either an underpriced asset or a hidden risk that comps aren't pricing in. Stress-test before assuming the spread holds.
Location & tenants
- Location reads 83/100 on livability (#10 in NH, #879 nationally) — a professional / high-income tenant draw. Strengths: amenities A+, commute A+, housing A+.
- Manchester School District (urban): math 14% / reading 27% proficiency, ranked #96 of 98 in NH (top 98%) — low school quality limits family demand, transient renter base, plan for 1-2y turnover.
- Market conditions: 35 active listings in the ZIP; 1 comparable units currently listed for rent nearby; 981 units permitted in Hillsborough County in 2024 (381 in 5+ unit buildings).
Forward outlook
- Local home prices are declining (-3.0%/yr); year-one equity from $4k of loan paydown is wiped out by about $16k of value loss. Plan a longer hold.
- Hillsborough County population projected to shrink 8% by 2050 — rents likely to lag national; underwrite the cash flow, not the appreciation.
- At projected returns (-3.0% appreciation + 3.0% rent growth), your $154k cash investment doubles in ~7 years — after that, you're playing with house money.
Negotiation context
- Only 3 days on market — expect competitive offers; lowballing is unlikely to land.
- 3 sale attempts since 21y ago with the ask held roughly flat each time — persistent listings suggest the price (not the market) is what's stuck; bring a comps-based counter.
- Current owner paid $312k; list at $549k implies a 76% gain — meaningful room to come down on a strong offer.
Risks & watch-outs
- Climate carrying-cost: moderate wind risk, 25% chance of damaging wind over 30y — expect insurance premiums to compound above CPI over the hold.
Questions for the listing agent
- Is there a deadline driving the sale (1031 exchange, divorce, estate, relocation)? That informs how much negotiation room exists.
- What's the average days-on-market for RENTAL listings here right now (not sales)? A rising rental-DOM trend means longer vacancies and softer asking-rent achievability than the comps imply.
- What's the recent tenant-quality profile in this submarket — average credit score on applications, eviction rate, late-payment / NSF rate, and stable-employment percentage? A property-management company in the area should have these aggregated.
- How much new for-sale + rental construction is in the pipeline within 1–3 miles? Heavy new supply typically softens prices + rents 12–24 months out; constrained supply supports both.
Investment metrics
- 1% rule
- 1.37% ✓
- Cap rate
- 11.23%
- Cash-on-cash
- 17.63%
- DSCR
- 1.78
- GRM
- 6.1
CMA / ARV
- ARV (median comp)
- $585,495
- List price
- $549,000
- Delta
- -6.23%
- Verdict
- FAIR
- Comps
- 20 within 1.0 mi
Show comp detail 10 sales within ~0.75 mi
| Address | Dist | Beds/Ba | Sqft | Sold | Price | $/sf | Match |
|---|---|---|---|---|---|---|---|
| 54 Megan Dr | 0.04mi | 3/1.5 | 1,482 (-4%) | 14mo | $535,000 | $361 | 79 |
| 3036 Bodwell Rd | 0.09mi | 3/1.5 | 1,632 (+6%) | 7mo | $520,000 | $319 | 77 |
| 198 Megan Dr | 0.11mi | 3/1.5 | 1,632 (+6%) | 9mo | $550,000 | $337 | 75 |
| 95 Windflower Dr | 0.16mi | 3/1.5 | 1,632 (+6%) | 7mo | $519,000 | $318 | 74 |
| 361 Aaron Dr | 0.24mi | 3/2.0 | 1,632 (+6%) | 7mo | $560,000 | $343 | 72 |
| 286 Aaron Dr | 0.21mi | 3/1.5 | 1,632 (+6%) | 7mo | $567,000 | $347 | 72 |
| 177 Megan Dr | 0.13mi | 3/1.5 | 1,344 (-12%) | 8mo | $485,000 | $361 | 65 |
| 328 Aaron Dr | 0.21mi | 3/2.0 | 1,384 (-10%) | 13mo | $420,777 | $304 | 63 |
| 1465 Bodwell Rd #9 | 0.63mi | 3/2.5 | 1,658 (+8%) | 14mo | $489,000 | $295 | 44 |
| 1425 Bodwell Rd #1 | 0.71mi | 3/1.0 | 1,712 (+12%) | 10mo | $403,500 | $236 | 36 |
Match score weights: distance 35% · size 25% · config 20% · recency 20%. Top-matched comps best support the ARV.
Projected returns pro-forma
-3.0% appreciation · 3.0% rent growth · sell at horizon
- IRR
- 9.1%
- Equity multiple
- 1.36×
- Total profit
- $54,946
- Equity at exit
- $81,858
- IRR
- 18.3%
- Equity multiple
- 2.52×
- Total profit
- $233,244
- Equity at exit
- $47,467
Cash invested: $153,720 (down + closing). Projections, not guarantees.
Landlord ↔ Tenant lean methodology
- Overall (STATE)
- 56 Moderately Landlord-Leaning
- State New Hampshire
- 56 Moderately Landlord-Leaning · D+1
- County
- — inherits STATE
- City
- — inherits STATE
ZIP-level market 03109
- Home prices YoY
- -19.7%
- Active inventory
- 35
- Price-to-rent
- 6.1×
Monthly cashflow live
- Estimated rent
- $7,499 medium interval (Pro) →
- Mortgage (P&I)
- −$2,879
- Tax from tax record
- −$558 /mo · $6,690/yr
- Insurance
- −$229
- HOA
- −$0
- Vacancy / Maint / Mgmt
- −$1,575
- Net cashflow
- $2,259
Break-even live
UW: 25.0% down · 7.5% · 30yr · 1.5% tax · 5.0% vac · 8.0% maint · 8.0% mgmt
Financing live
Cash to close
- Down payment
- $137,250
- Closing costs
- $16,470
- Reserves months
- —
- Total cash needed
- —
Loan-product check · same deal, 3 products live
Conventional
25% down · 7.5% · 30yr
- Down + closing
- —
- Monthly P&I
- —
- Monthly cashflow
- —
- DSCR
- —
- Eligible?
- —
Personal DTI + credit; lowest rate.
DSCR
20% down · 8.5% · 30yr
- Down + closing
- —
- Monthly P&I
- —
- Monthly cashflow
- —
- DSCR
- —
- Eligible?
- —
No personal income docs; deal must DSCR.
Hard money
10% down · 12.0% · 12mo
- Down + closing
- —
- Monthly P&I
- —
- Monthly cashflow
- —
- DSCR
- —
- Eligible?
- —
Short-term bridge; refi at stabilization.
Rent comps 1 comps
| Address | Beds | Baths | Sqft | Rent | $/sqft | DOM | Units | Dist |
|---|---|---|---|---|---|---|---|---|
| 131 Forest Hill Way Manchester, NH | 4.0 | 2.5 | 1970 | $7,499 | $3.81 | 14d | 1 | 0.68mi |
Listing history 8 events
-
2026-05-16status Pending 1070-char remark
-
2026-05-13$549,000 Active 1070-char remark
-
2007-06-06soldstatus $312,400
-
2007-06-04soldstatus $312,400 227-char remark
Show marketing remark (227 chars)
NOTHING TO DO! ! ! ! Move right into this LARGE Colonial with 3-4 BRs, 2 baths, fireplace, hardwood, and MUCH MORE!! GREAT neighborhood, large fenced rear yard with pool, house is in immaculate condition!! THIS WILL NOT LAST!!!
-
2007-04-02$309,900 227-char remark
Show marketing remark (227 chars)
NOTHING TO DO! ! ! ! Move right into this LARGE Colonial with 3-4 BRs, 2 baths, fireplace, hardwood, and MUCH MORE!! GREAT neighborhood, large fenced rear yard with pool, house is in immaculate condition!! THIS WILL NOT LAST!!!
-
2005-04-29soldstatus $289,933
-
2005-04-28soldstatus $289,900
Show marketing remark (192 chars)
MINT CONDITION - IN SOUGHT AFTER NEIGHBORHOOD - HARDWOOD/TITLE FLOORS THRU OUT - FENCED IN YARD W/ ABV GROUND POOL AND DECK-IRR SYS- CENTRAL AIR - MOVE IN NOTHING TO DO - CALL NOW FOR SHOWING.
-
2005-01-10$289,900
Show marketing remark (192 chars)
MINT CONDITION - IN SOUGHT AFTER NEIGHBORHOOD - HARDWOOD/TITLE FLOORS THRU OUT - FENCED IN YARD W/ ABV GROUND POOL AND DECK-IRR SYS- CENTRAL AIR - MOVE IN NOTHING TO DO - CALL NOW FOR SHOWING.
ⓘ Source: listings_history table (triggers on properties + properties_extension) + one-shot
backfill from property_details.listing_events for pre-trigger history.
Tax reassessment forecast NH · Partial reset (capped growth)
- Current annual tax
- $6,690 · $558/mo
- Projected year-2 tax
- $9,329 · $777/mo
- Expected delta
- +$2,639/yr (+$220/mo · 39.4%)
ⓘ Screening estimate from a state-policy table — verify with the county assessor before closing.
Climate risk First Street
- Flood 1/10 Low FEMA zone X (unshaded) · 0% chance over 30 yrs
- Wildfire 3/10 Moderate
- Heat 4/10 Moderate 7 d/yr ≥96°F today · 15 d/yr by 30 yrs out
- Wind 5/10 Major 25% chance of damaging wind over 30 yrs
- Air quality 2/10 Low 1 unhealthy d/yr today · 2 by 30 yrs out
Nearby sold comps map
Loading sold comps map…
Walkable amenities ~0.75 mi
Loading nearby amenities…
Taxation est. · year 1
- Rental income
- $89,988
- − Mortgage interest
- −$30,753
- − Property taxes
- −$6,690
- − Insurance
- −$2,745
- − Repairs & maintenance
- −$7,199
- − Management
- −$7,199
- − Depreciation
- −$15,971
- Taxable income
- $19,431
- Est. tax owed @ 24.0%
- −$4,664
- After-tax cash flow
- $22,444/yr
For passive investors: Depreciation is non-cash, so a rental often shows a tax loss while cash-flowing — sheltering income. Rental losses are passive: they offset passive income freely, and up to $25,000/yr can offset ordinary (W-2) income if you actively participate and your MAGI is under $100k (phasing out to $0 by $150k); unused losses carry forward. On sale, claimed depreciation is recaptured at up to 25%, and gains may owe capital-gains tax (a 1031 exchange can defer both). Figures are a year-1 estimate at your 24.0% rate — not tax advice; consult a CPA.
Schools (NCES district)
- District
- Manchester School District
- NCES district ID
- 3304590
- Math proficiency
- 14% ▼ -10.00%
- Reading proficiency
- 27% ▼ -6.00%
- Median HH income
- $54,096
- Composite
- 18.67/100
- National rank
- #8886
- State rank
- #96 of 98 in NH
Livability — Manchester
- Score
- 83/100
- State rank
- #10
- US rank
- #879
Category grades
Schools grade is shown separately in the Schools card above.
Census & demographics
- Census place
- Manchester, NH
- City population
- 110,172
- Population (ZIP)
- 10,118
Population outlook (Hillsborough County) Hauer SSP2
- Today (2025)
- 412,771 people
- By 2030
- 410,974 · -0.4%
- By 2040
- 399,959 · -3.1%
- By 2050
- 381,542 · -7.6%
- By 2075
- 339,855 · -17.7%
- By 2100
- 289,270 · -29.9%
Race, ethnicity, and origin ACS 2023
- Neighborhood character
- Predominantly White (90%)
- Race & ethnicity
- White 90% Two or more races 6% Asian 2% Hispanic / Latino 1%
- Common ancestry
- Lithuanian 11% Romanian 3% Russian 2%
- Foreign-born
- 4% · Canada, Vietnam
- Languages at home
- 91% English-only · French/Haitian/Cajun 4% Other Indo-European 3% German/W. Germanic 1%
Political lean MEDSL · Hillsborough
- 2024 margin
- Toss-up / Even · D 50.9% · R 48.0% · Other 1.0%
- 2008→2024 swing
- -0.9pp no change · 2008: 3.8pp · 2024: 2.9pp
- All cycles
- 2024: D+2.9 2020: D+7.7 2016: R+0.2 2012: D+1.7 2008: D+3.8
Not yet ingested
- Civics
- —
Market trends
- HPI YoY
- ▼ -86.66%
- Current HPI
- 353.7732
- Rent YoY
- —
- Metro
- —
- State GDP YoY
- —
- F500 in state
- 0
Price history
+89.4% since first listed8 events — show timeline
- 2026-05-16 Pending — PrimeMLS
- 2026-05-13 Listed $549,000 PrimeMLS
- 2007-06-06 Sold (Public Records) $312,400 Public Records
- 2007-06-04 Sold (MLS) $312,400 PrimeMLS
- 2007-04-02 Listed $309,900 PrimeMLS
- 2005-04-29 Sold (Public Records) $289,933 Public Records
- 2005-04-28 Sold (MLS) $289,900 PrimeMLS
- 2005-01-10 Listed $289,900 PrimeMLS
Property tax history
+2.4%/yrLatest (2024): $6,690 · +3.8% YoY. Source: county tax records.
Cash-flow waterfall
monthlySold comps — $/sqft
last 12 mo · ≤1 miLoading sold comps…