 Duplex
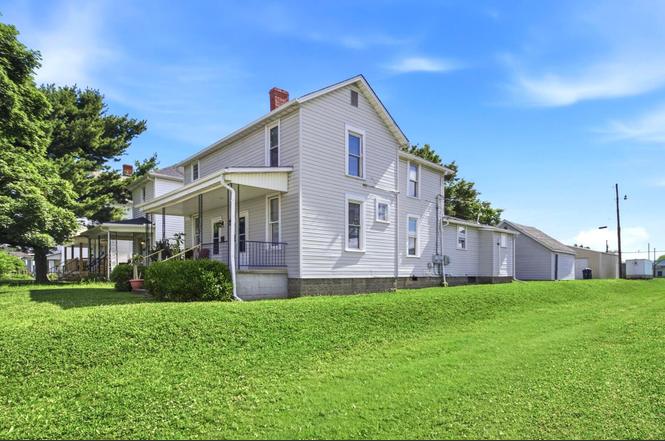
604-606 N Roosevelt Ave · Lancaster, OH
Flood risk 1/10 · Minimal
- FEMA flood zone
- X (unshaded)
- Chance of flooding over 30 yrs
- 0.0%
- Est. flood insurance / yr
- $473 – $860
Fire risk 1/10 · Minimal
- Est. fire insurance / yr
- $713 – $1,323
Heat risk 4/10 · Minor
- Hot days now (above 99°F)
- 8 days/yr
- Hot days in 30 yrs
- 20 days/yr
Wind risk 2/10 · Minimal
- Chance of severe wind over 30 yrs
- 1.0%
Air-quality risk 2/10 · Minimal
- Unhealthy air days now
- 1 days/yr
- Unhealthy air days in 30 yrs
- 2 days/yr
Risk factors via First Street. Map © Google.
Why this score? — see what drove the B grade
The composite is a weighted blend of 9 inputs, each scored 0–100. Each bar is that input's sub-score; the figure is the points it added to the 100-point composite (weight × sub-score).
- Cash flow +30.0/30.0
- 1% rule +10.0/10.0
- DSCR +10.0/10.0
- ARV discount +7.5/15.0
- Livability +4.3/5.0
- Rent growth +3.8/5.0
- Schools +3.7/10.0
- Condition / age +2.5/5.0
- Appreciation +0.0/10.0
$189,888
🖨 Deal sheet 📄 Offer letter ✓ Due diligence
Multi-family units
County records classify this as Multi-Family (2-4 Unit). Listing-text estimate: 2 units. confirmed
Listing remarks
INVESTOR OPPORTUNITY! Multi-family property with a full basement plus a 2-car garage divided for tenant use. This is a great addition to your investment portfolio! Recent updates include new roof shingles on the home and garage doors in 2026. Unit 606 -- 2 bedrooms - 1 bath - Currently rents for $725 per month - Long-term tenant of 7 years - New hot water tank in 2026. Unit 604 -- 2 bedrooms, 1 bath - Vacant and move-in ready - Remodeled with an updated kitchen - New refrigerator, dishwasher, and microwave in 2026 - Updated bathroom featuring a new tub and vanity - Washer and dryer included, new in 2026 - Fresh paint throughout - New carpeting - Two new windows upstairs - Hot w
Key facts
- New roof shingles
- Full basement
- New refrigerator
Tags
Property features AI
Finance
- Other: Two total units
Exterior
- Utilities: Public water; Public sewer; Natural gas available; Electricity available; Storm sewer
- Home design: Duplex; Built in 1900
- Construction: Built in 1900
- Exterior features: Lot of approximately 0.12 acres (about 5,227 sq ft)
Interior
- Heating & cooling: Forced air heating
- Interior features: Forced air heating
Neighborhood map
What this means for you Summary
Snapshot
- This is a 2 × 2-bed/1.0-bath units multifamily listed at $190k.
Deal economics
- At list price, monthly cash flow is $1k ($13k/yr) — positive. Per door: $542/mo.
- The deal already cash-flows at list — no discount required.
- Meets the 1% rule at list price ($3k rent vs $190k).
- Cap rate 13.1% vs local median 4.0% in Lancaster — top-decile yield for the area; either an underpriced asset or a hidden risk that comps aren't pricing in. Stress-test before assuming the spread holds.
Location & tenants
- Location reads 86/100 on livability (#41 in OH, #423 nationally) — a professional / high-income tenant draw. Strengths: amenities A+, cost of living A+, housing A+; Watch: crime D, employment D.
- Lancaster City (town): math 38% / reading 51% proficiency, ranked #504 of 656 in OH (top 77%) — families likely to look elsewhere, expect single-tenant / working-renter base with shorter leases.
- Market conditions: Rents rising fast (+5.2%/yr); 204 active listings in the ZIP; 2 comparable units currently listed for rent nearby; 475 units permitted in Fairfield County in 2024 (0 in 5+ unit buildings).
- At $2,905/mo this rent would consume 48% of the median local household income ($72k/yr) (locally 1400% of renters already pay >50% of income on rent) — very limited rent-growth headroom before tenants either downsize or default.
Forward outlook
- Local home prices are declining (-3.0%/yr); year-one equity from $1k of loan paydown is wiped out by about $6k of value loss. Plan a longer hold.
- Fairfield County population projected at +8% by 2050 — modest demand growth; plan on rents tracking national, not racing it.
- At projected returns (-3.0% appreciation + 5.2% rent growth), your $53k cash investment doubles in ~5 years — after that, you're playing with house money.
Negotiation context
- Only 3 days on market — expect competitive offers; lowballing is unlikely to land.
- 4 sale attempts since 19y ago with the ask held roughly flat each time — persistent listings suggest the price (not the market) is what's stuck; bring a comps-based counter.
- Current owner paid $60k; list at $190k implies a 216% gain — meaningful room to come down on a strong offer.
Risks & watch-outs
- Watch-outs: built in 1900 — expect roof / HVAC / electrical / plumbing capex.
Questions for the listing agent
- Can we see the unit-by-unit rent roll, current vacancy, and any below-market leases? What's the average tenancy length?
- What capital expenditures (roof, boiler, parking lot, exteriors) have been made in the last 5 years, and what's planned in the next 2?
- Built in 1900 — when were the roof, HVAC, electrical panel, plumbing, and water heater last replaced?
- Is there a deadline driving the sale (1031 exchange, divorce, estate, relocation)? That informs how much negotiation room exists.
- Crime grade is D in this area — have there been break-ins, vandalism, or insurance claims at this property in the last 3 years? What carrier currently insures it and at what premium?
- What's the average days-on-market for RENTAL listings here right now (not sales)? A rising rental-DOM trend means longer vacancies and softer asking-rent achievability than the comps imply.
- What's the recent tenant-quality profile in this submarket — average credit score on applications, eviction rate, late-payment / NSF rate, and stable-employment percentage? A property-management company in the area should have these aggregated.
- How much new apartment / multifamily construction is in the pipeline within 1–3 miles? Heavy new supply (>2% of stock underway) typically softens rents 12–24 months out; light construction supports rent growth.
Investment metrics
- 1% rule
- 1.53% ✓
- Cap rate
- 13.14%
- Cash-on-cash
- 24.46%
- DSCR
- 2.09
- GRM
- 5.4
CMA / ARV
No comps found within radius.
Projected returns pro-forma
-3.0% appreciation · 5.22% rent growth · sell at horizon
- IRR
- 20.2%
- Equity multiple
- 1.84×
- Total profit
- $44,869
- Equity at exit
- $28,313
- IRR
- 29.8%
- Equity multiple
- 3.94×
- Total profit
- $156,360
- Equity at exit
- $16,418
Cash invested: $53,169 (down + closing). Projections, not guarantees.
Landlord ↔ Tenant lean methodology
- Overall (STATE)
- 73 Landlord-Friendly
- State Ohio
- 73 Landlord-Friendly · R+6
- County
- — inherits STATE
- City
- — inherits STATE
ZIP-level market 43130
- Rents YoY
- 5.2%
- Active inventory
- 204
- Price-to-rent
- 10.9×
Monthly cashflow live
- Estimated rent
- $2,905 high interval (Pro) →
- Mortgage (P&I)
- −$996
- Tax from tax record
- −$136 /mo · $1,635/yr
- Insurance
- −$79
- HOA
- −$0
- Vacancy / Maint / Mgmt
- −$610
- Net cashflow
- $1,084
Break-even live
2-unit breakdown (identical units grouped — click to expand)
| Units | Beds | Baths | Est. rent |
|---|---|---|---|
| 2× units | 2 | 1 | $2,906 |
| #1 | 2 | 1 | $1,453 |
| #2 | 2 | 1 | $1,453 |
| Total (2 units) | $2,905 | ||
UW: 25.0% down · 7.5% · 30yr · 1.5% tax · 5.0% vac · 8.0% maint · 8.0% mgmt
Financing live
Cash to close
- Down payment
- $47,472
- Closing costs
- $5,697
- Reserves months
- —
- Total cash needed
- —
Loan-product check · same deal, 3 products live
Conventional
25% down · 7.5% · 30yr
- Down + closing
- —
- Monthly P&I
- —
- Monthly cashflow
- —
- DSCR
- —
- Eligible?
- —
Personal DTI + credit; lowest rate.
DSCR
20% down · 8.5% · 30yr
- Down + closing
- —
- Monthly P&I
- —
- Monthly cashflow
- —
- DSCR
- —
- Eligible?
- —
No personal income docs; deal must DSCR.
Hard money
10% down · 12.0% · 12mo
- Down + closing
- —
- Monthly P&I
- —
- Monthly cashflow
- —
- DSCR
- —
- Eligible?
- —
Short-term bridge; refi at stabilization.
Rent comps 2 comps
| Address | Beds | Baths | Sqft | Rent | $/sqft | DOM | Units | Dist |
|---|---|---|---|---|---|---|---|---|
| 219 N Columbus St Lancaster, OH | 1.0–2.0 | 1.0–2.0 | 1184 | $1,895 | $1.60 | 1d | 31 | 0.92mi |
| 635 N High St Lancaster, OH | 3.0 | 2.0 | 1608 | $2,200 | $1.37 | 43d | 1 | 1.21mi |
Listing history 4 events
-
2026-06-18days on market $189,888 Active 3 DOM
-
2026-06-17days on market $189,888 Active 2 DOM
-
2026-06-16remarks 699-char remark
-
2026-06-16$189,888 Active 1 DOM
ⓘ Source: listings_history table (triggers on properties + properties_extension) + one-shot
backfill from property_details.listing_events for pre-trigger history.
Tax reassessment forecast OH · Partial reset (capped growth)
- Current annual tax
- $1,635 · $136/mo
- Projected year-2 tax
- $2,299 · $192/mo
- Expected delta
- +$663/yr (+$55/mo · 40.6%)
ⓘ Screening estimate from a state-policy table — verify with the county assessor before closing.
Climate risk First Street
- Flood 1/10 Low FEMA zone X (unshaded) · 0% chance over 30 yrs
- Wildfire 1/10 Low
- Heat 4/10 Moderate 8 d/yr ≥99°F today · 20 d/yr by 30 yrs out
- Wind 2/10 Low 100% chance of damaging wind over 30 yrs
- Air quality 2/10 Low 1 unhealthy d/yr today · 2 by 30 yrs out
Nearby sold comps map
Loading sold comps map…
Walkable amenities ~0.75 mi
Loading nearby amenities…
Taxation est. · year 1
- Rental income
- $34,860
- − Mortgage interest
- −$10,637
- − Property taxes
- −$1,635
- − Insurance
- −$949
- − Repairs & maintenance
- −$2,789
- − Management
- −$2,789
- − Depreciation
- −$5,524
- Taxable income
- $10,537
- Est. tax owed @ 24.0%
- −$2,529
- After-tax cash flow
- $10,476/yr
For passive investors: Depreciation is non-cash, so a rental often shows a tax loss while cash-flowing — sheltering income. Rental losses are passive: they offset passive income freely, and up to $25,000/yr can offset ordinary (W-2) income if you actively participate and your MAGI is under $100k (phasing out to $0 by $150k); unused losses carry forward. On sale, claimed depreciation is recaptured at up to 25%, and gains may owe capital-gains tax (a 1031 exchange can defer both). Figures are a year-1 estimate at your 24.0% rate — not tax advice; consult a CPA.
Schools (NCES district)
- District
- Lancaster City
- NCES district ID
- 3904420
- Math proficiency
- 38% ▼ -21.00%
- Reading proficiency
- 51% ▼ -11.00%
- Median HH income
- $41,696
- Composite
- 37.39/100
- National rank
- #4427
- State rank
- #504 of 656 in OH
Livability — Lancaster
- Score
- 86/100
- State rank
- #41
- US rank
- #423
Category grades
Schools grade is shown separately in the Schools card above.
Census & demographics
- Census place
- Lancaster, OH
- County
- Fairfield County · 109,896 people
- City population
- 62,933
- Metro
- Columbus, OH
- Population (ZIP)
- 62,933
- Household income
- $72,153
- Rent vs Own
- Severe rent burden
- 1400.0
Population outlook (Fairfield County) Hauer SSP2
- Today (2025)
- 162,442 people
- By 2030
- 166,796 · +2.7%
- By 2040
- 172,835 · +6.4%
- By 2050
- 174,822 · +7.6%
- By 2075
- 174,938 · +7.7%
- By 2100
- 160,988 · -0.9%
Race, ethnicity, and origin ACS 2023
- Neighborhood character
- Predominantly White (91%)
- Race & ethnicity
- White 91% Two or more races 4% Hispanic / Latino 2% Black 2%
- Common ancestry
- Slovak 2% Italian 1% Iranian 1%
- Foreign-born
- 1% · Canada
- Languages at home
- 98% English-only · Spanish 1%
Political lean MEDSL · Fairfield
- 2024 margin
- Strong R (+24.1) · D 37.5% · R 61.6%
- 2008→2024 swing
- -6.9pp toward R · 2008: -17.1pp · 2024: -24.1pp
- All cycles
- 2024: R+24.1 2020: R+23.5 2016: R+27.0 2012: R+16.1 2008: R+17.1
Not yet ingested
- Civics
- —
Market trends
- HPI YoY
- ▼ -298.81%
- Current HPI
- 239.6352
- Rent YoY
- ▲ 5.22%
- Metro
- Columbus, OH
- State GDP YoY
- ▲ 1.98%
- F500 in state
- 48
Industry mix (Fortune 500 HQ in OH)
| Industry | F500 HQs | Revenue |
|---|---|---|
| Insurance | 3 | $145B |
|
||
| Industrial Machinery | 3 | $49B |
|
||
| Financial Services | 3 | $24B |
|
||
| Consumer Goods | 2 | $93B |
|
||
| Aerospace / Defense | 2 | $47B |
|
||
| Utilities | 2 | $33B |
|
||
Price history
+522.6% since first listed9 events — show timeline
- 2026-06-15 Listed $189,888 CBRMLS
- 2014-08-27 Listing Removed — CBRMLS
- 2014-02-26 Listed $89,888 CBRMLS
- 2009-05-15 Listing Removed — CBRMLS
- 2008-08-14 Listed $99,888 CBRMLS
- 2008-04-14 Listing Removed — CBRMLS
- 2007-07-09 Listed $114,888 CBRMLS
- 2007-02-05 Sold (Public Records) $60,000 Public Records
- 1992-12-16 Sold (Public Records) $30,500 Public Records
Property tax history
+4.6%/yrLatest (2025): $1,635 · +10.1% YoY. Source: county tax records.
Cash-flow waterfall
monthlySold comps — $/sqft
last 12 mo · ≤1 miLoading sold comps…