 🏷️ Likely Rental
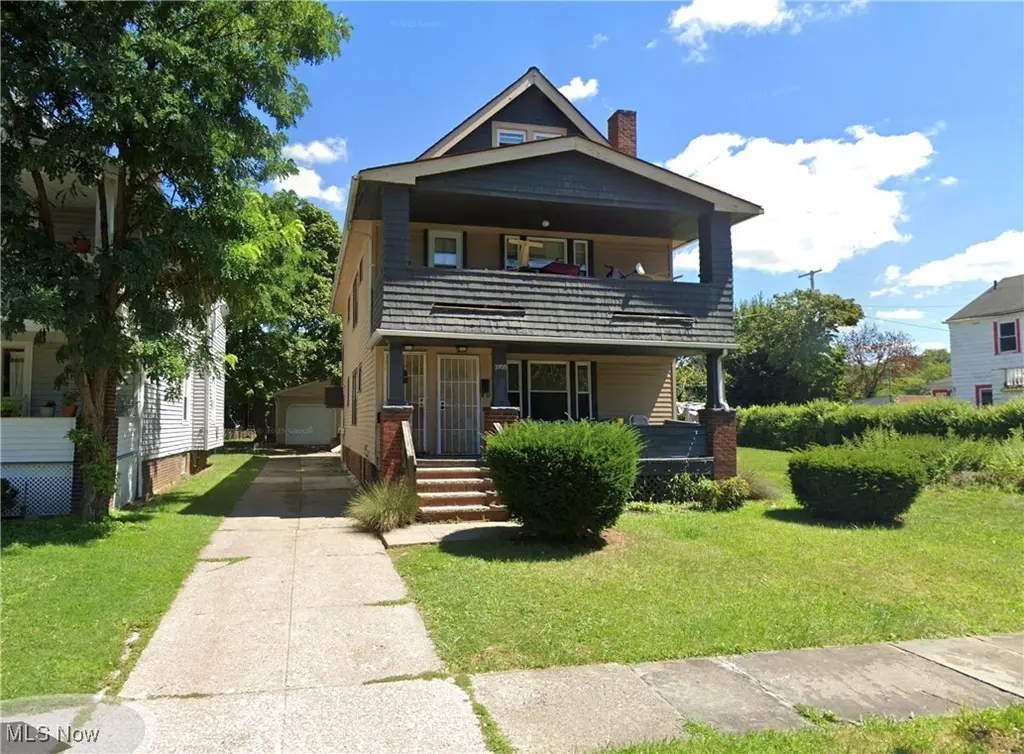
3705 Sudbury Rd · Shaker Heights, OH
Flood risk 1/10 · Minimal
- FEMA flood zone
- X (unshaded)
- Chance of flooding over 30 yrs
- 0.0%
- Est. flood insurance / yr
- $473 – $860
Fire risk 1/10 · Minimal
- Est. fire insurance / yr
- $713 – $1,323
Heat risk 2/10 · Minimal
- Hot days now (above 95°F)
- 7 days/yr
- Hot days in 30 yrs
- 17 days/yr
Wind risk 1/10 · Minimal
- Chance of severe wind over 30 yrs
- —
Air-quality risk 3/10 · Minor
- Unhealthy air days now
- 3 days/yr
- Unhealthy air days in 30 yrs
- 5 days/yr
Risk factors via First Street. Map © Google.
Why this score? — see what drove the A- grade
The composite is a weighted blend of 9 inputs, each scored 0–100. Each bar is that input's sub-score; the figure is the points it added to the 100-point composite (weight × sub-score).
- Cash flow +30.0/30.0
- ARV discount +15.0/15.0
- 1% rule +10.0/10.0
- DSCR +10.0/10.0
- Schools +5.0/10.0
- Livability +4.5/5.0
- Rent growth +3.3/5.0
- Condition / age +2.5/5.0
- Appreciation +0.0/10.0
$169,999
🖨 Deal sheet (PDF) 📄 Offer letter ✓ Due diligence
Multi-family units
County records classify this as Multi-Family (2-4 Unit). Listing-text estimate: 2 units. confirmed
Listing remarks MLS
Collect almost $3,000/mo with this Shaker duplex. Email agent for market rent roll & video tour along with complete investment analysis, drone footage, information on the mechanical systems of the building. Professional property management availalbe. Local & out of state investors welcome!
Key facts
- 4,800 sq ft lot
- 2 garage spots
- Built 1928
Neighborhood map
What this means for you Summary
Snapshot
- This is a 2 × 3-bed/1.0-bath units multifamily listed at $170k.
Deal economics
- At list price, monthly cash flow is $912 ($11k/yr) — positive. Per door: $456/mo.
- The deal already cash-flows at list — no discount required.
- Meets the 1% rule at list price ($3k rent vs $170k).
- Recommended offer: $150k (12.0% below list) — sets the bar for market timing.
- Cap rate 12.7% vs local median 2.5% in Shaker Heights — top-decile yield for the area; either an underpriced asset or a hidden risk that comps aren't pricing in. Stress-test before assuming the spread holds.
Location & tenants
- Location reads 89/100 on livability (#15 in OH, #134 nationally) — a professional / high-income tenant draw. Strengths: schools A+, crime A+, commute A+; Watch: amenities F.
- Shaker Heights City (suburban): math 50% / reading 63% proficiency, ranked #309 of 656 in OH (top 47%) — acceptable for families but not a draw, mixed tenant base, ~2y average lease.
- Market conditions: Rents rising (+3.3%/yr); 125 active listings in the ZIP; 30 comparable units currently listed for rent nearby; rentals at typical pace (median 22d on market — plan ~3-4 weeks tenant-placement turnaround); 1,441 units permitted in Cuyahoga County in 2024 (700 in 5+ unit buildings).
- At $2,925/mo this rent would consume 74% of the median local household income ($47k/yr) (locally 2289% of renters already pay >50% of income on rent) — very limited rent-growth headroom before tenants either downsize or default.
Forward outlook
- Local home prices are declining (-3.0%/yr); year-one equity from $1k of loan paydown is wiped out by about $5k of value loss. Plan a longer hold.
- Cuyahoga County population projected to shrink 8% by 2050 — rents likely to lag national; underwrite the cash flow, not the appreciation.
- At projected returns (-3.0% appreciation + 3.3% rent growth), your $48k cash investment doubles in ~6 years — after that, you're playing with house money.
Negotiation context
- It's been on market 140 days — a 12% lower offer ($150k) is reasonable based on typical stale-listing flexibility.
- 9 sale attempts since 18y ago; this cycle's ask has dropped $40k (19%) from the opening price — seller is motivated, your offer sets the floor, not the list.
- Current owner paid $56k; list at $170k implies a 204% gain — meaningful room to come down on a strong offer.
Risks & watch-outs
- Watch-outs: property tax is 3.1% of price; built in 1928 — expect roof / HVAC / electrical / plumbing capex.
Questions for the listing agent
- It's been on market 140 days. Have you received any prior offers? Is the seller open to a 12% concession, seller financing, or rate buy-down credit?
- Can we see the unit-by-unit rent roll, current vacancy, and any below-market leases? What's the average tenancy length?
- What capital expenditures (roof, boiler, parking lot, exteriors) have been made in the last 5 years, and what's planned in the next 2?
- Built in 1928 — when were the roof, HVAC, electrical panel, plumbing, and water heater last replaced?
- Property tax is high relative to price — has the assessment been appealed recently, and will the sale trigger a re-assessment?
- Why hasn't it sold? Are there any deal-killer items the seller is aware of (foundation, flood, title, zoning, code violations)?
- Is there a deadline driving the sale (1031 exchange, divorce, estate, relocation)? That informs how much negotiation room exists.
- Schools are A-rated — typically a magnet for longer-tenancy family renters. What's the average tenant stay here, and is there a school-zone premium baked into asking?
- What's the average days-on-market for RENTAL listings here right now (not sales)? A rising rental-DOM trend means longer vacancies and softer asking-rent achievability than the comps imply.
- What's the recent tenant-quality profile in this submarket — average credit score on applications, eviction rate, late-payment / NSF rate, and stable-employment percentage? A property-management company in the area should have these aggregated.
- How much new apartment / multifamily construction is in the pipeline within 1–3 miles? Heavy new supply (>2% of stock underway) typically softens rents 12–24 months out; light construction supports rent growth.
Investment metrics
- 1% rule
- 1.72% ✓
- Cap rate
- 12.73%
- Cash-on-cash
- 22.98%
- DSCR
- 2.02
- GRM
- 4.8
CMA / ARV
- ARV (median comp)
- $219,423
- List price
- $169,999
- Delta
- -22.52%
- Verdict
- UNDERPRICED
- Comps
- 20 within 1.0 mi
Show comp detail 4 sales within ~0.75 mi
| Address | Dist | Beds/Ba | Sqft | Sold | Price | $/sf | Match |
|---|---|---|---|---|---|---|---|
| 3653 Hildana Rd | 0.16mi | 4/2.0 | 2,110 (+8%) | 1mo | $102,000 | $48 | 79 |
| 3713 Menlo Rd | 0.31mi | 4/2.0 | 2,166 (+10%) | 12mo | $65,000 | $30 | 58 |
| 3533 Chelton Rd | 0.32mi | 3/2.0 (-1) | 1,722 (-12%) | 11mo | $225,000 | $131 | 50 |
| 3654 3654 Avalon Road Rd #2 | 0.35mi | 5/3.0 (+1) | 2,236 (+14%) | 23mo | $210,000 | $94 | 32 |
Match score weights: distance 35% · size 25% · config 20% · recency 20%. Top-matched comps best support the ARV.
Projected returns pro-forma
-3.0% appreciation · 3.34% rent growth · sell at horizon
- IRR
- 16.4%
- Equity multiple
- 1.67×
- Total profit
- $31,704
- Equity at exit
- $25,347
- IRR
- 25.3%
- Equity multiple
- 3.25×
- Total profit
- $107,262
- Equity at exit
- $14,698
Cash invested: $47,600 (down + closing). Projections, not guarantees.
Landlord ↔ Tenant lean methodology
- Overall (STATE)
- 73 Landlord-Friendly
- State Ohio
- 73 Landlord-Friendly · R+6
- County
- — inherits STATE
- City
- — inherits STATE
ZIP-level market 44120
- Rents YoY
- 3.3%
- Active inventory
- 125
- Price-to-rent
- 9.7×
Monthly cashflow live
- Estimated rent
- $2,925 high interval (Pro) →
- Mortgage (P&I)
- −$891
- Tax from tax record
- −$437 /mo · $5,241/yr
- Insurance
- −$71
- HOA
- −$0
- Vacancy / Maint / Mgmt
- −$614
- Net cashflow
- $912
Break-even live
Sensitivity live
| Price | -10% $1,008 | -5% $960 | +0% $912 | +5% $864 | +10% $815 |
|---|---|---|---|---|---|
| Rent | -10% $681 | -5% $796 | +0% $912 | +5% $1,027 | +10% $1,143 |
| Rate | -1.0pp $997 | -0.5pp $955 | base $912 | +0.5pp $868 | +1.0pp $823 |
2-unit breakdown (identical units grouped — click to expand)
| Units | Beds | Baths | Est. rent |
|---|---|---|---|
| 2× units | 3 | 1 | $2,926 |
| #1 | 3 | 1 | $1,463 |
| #2 | 3 | 1 | $1,463 |
| Total (2 units) | $2,925 | ||
UW: 25.0% down · 7.5% · 30yr · 1.5% tax · 5.0% vac · 8.0% maint · 8.0% mgmt
Financing live
Cash to close
- Down payment
- $42,500
- Closing costs
- $5,100
- Reserves months
- —
- Total cash needed
- —
Loan-product check · same deal, 3 products live
Conventional
25% down · 7.5% · 30yr
- Down + closing
- —
- Monthly P&I
- —
- Monthly cashflow
- —
- DSCR
- —
- Eligible?
- —
Personal DTI + credit; lowest rate.
DSCR
20% down · 8.5% · 30yr
- Down + closing
- —
- Monthly P&I
- —
- Monthly cashflow
- —
- DSCR
- —
- Eligible?
- —
No personal income docs; deal must DSCR.
Hard money
10% down · 12.0% · 12mo
- Down + closing
- —
- Monthly P&I
- —
- Monthly cashflow
- —
- DSCR
- —
- Eligible?
- —
Short-term bridge; refi at stabilization.
Rent comps 30 comps
| Address | Beds | Baths | Sqft | Rent | $/sqft | DOM | Units | Dist |
|---|---|---|---|---|---|---|---|---|
| 3710 Sudbury Rd Cleveland, OH | 4.0 | 1.5 | 1665 | $1,900 | $1.14 | 44d | 1 | 0.03mi |
| 3650 Lindholm Rd Cleveland, OH | 4.0 | 2.0 | 1327 | $2,099 | $1.58 | 2d | 1 | 0.13mi |
| 3650 Lindholm Rd Cleveland, OH | 4.0 | 2.0 | 1327 | $2,099 | $1.58 | 17d | 1 | 0.13mi |
| 3719 Rolliston Rd Cleveland, OH | 3.0 | 2.0 | 1458 | $1,910 | $1.31 | 44d | 1 | 0.20mi |
| 16818 Kenyon Rd Unit 2 Shaker Heights, OH | 4.0 | 1.0 | 1900 | $1,900 | $1.00 | 5d | 1 | 0.36mi |
| 3579 Riedham Rd Unit Up Shaker Heights, OH | 4.0 | 2.0 | 1648 | $1,600 | $0.97 | 44d | 1 | 0.39mi |
| 3671 Daleford Rd Unit Up Shaker Heights, OH | 3.0 | 2.0 | 1536 | $1,675 | $1.09 | 18d | 1 | 0.44mi |
| 3671 Daleford Rd Cleveland, OH | 3.0 | 2.0 | 1536 | $1,675 | $1.09 | 22d | 1 | 0.44mi |
| 17408 Invermere Ave Cleveland, OH | 4.0 | 1.5 | 1278 | $1,900 | $1.49 | 12d | 1 | 0.46mi |
| 3524 Daleford Rd Cleveland, OH | 3.0 | 1.0 | 1700 | $2,200 | $1.29 | 17d | 1 | 0.52mi |
| 3578 Ingleside Rd Shaker Heights, OH | 5.0 | 2.0 | 1308 | $1,850 | $1.41 | 5d | 1 | 0.58mi |
| 16015 Van Aken Blvd Cleveland, OH | 2.0–4.0 | 2.0 | 1360 | $1,395 | $1.03 | 8d | 4 | 0.59mi |
| 17424 Winslow Rd Cleveland, OH | 4.0 | 2.0 | 1995 | $2,200 | $1.10 | 17d | 1 | 0.63mi |
| 3636 Glencairn Rd Unit 2 Shaker Heights, OH | 4.0 | 1.0 | 1612 | $1,750 | $1.09 | 24d | 1 | 0.73mi |
| 3634 Glencairn Rd Shaker Heights, OH | 4.0 | 1.0 | 1612 | $1,750 | $1.09 | 24d | 1 | 0.73mi |
| 3601 Glencairn Rd Shaker Heights, OH | 3.0 | 1.5 | 1890 | $1,500 | $0.79 | 44d | 1 | 0.78mi |
| 3348 Colwyn Rd Cleveland, OH | 3.0 | 1.0 | 1330 | $1,199 | $0.90 | 24d | 1 | 0.82mi |
| 18313 Newell Rd Beachwood, OH | 3.0 | 1.0 | 1318 | $1,395 | $1.06 | 45d | 1 | 0.84mi |
| 18314 Chagrin Blvd Unit 1 Shaker Heights, OH | 3.0 | 2.0 | 1670 | $1,600 | $0.96 | 18d | 1 | 0.85mi |
| 3578 Latimore Rd Shaker Heights, OH | 3.0 | 1.5 | 2113 | $2,200 | $1.04 | 2d | 1 | 0.88mi |
| 3653 Winchell Rd Unit 2 Shaker Heights, OH | 5.0 | 3.0 | 1775 | $2,350 | $1.32 | 44d | 1 | 0.95mi |
| 3614 Lynnfield Rd Shaker Heights, OH | 4.0 | 2.0 | 1584 | $1,450 | $0.92 | 17d | 1 | 0.99mi |
| 3665 Lynnfield Rd Unit UP Shaker Heights, OH | 4.0 | 2.0 | 1600 | $1,849 | $1.16 | 44d | 1 | 1.01mi |
| 18801 Invermere Ave Cleveland, OH | 3.0 | 2.5 | 2134 | $2,200 | $1.03 | 2d | 1 | 1.01mi |
| 19406 Wickfield Ave Warrensville Heights, OH | 3.0 | 1.5 | 1934 | $2,650 | $1.37 | 2d | 1 | 1.21mi |
| 19333 Van Aken Blvd Shaker Heights, OH | 3.0 | 2.0 | 1500 | $2,075 | $1.38 | 44d | 1 | 1.32mi |
| 14108 Becket Rd Cleveland, OH | 4.0 | 3.5 | 1660 | $2,206 | $1.33 | 44d | 1 | 1.33mi |
| 19714 Shakerwood Rd Warrensville Heights, OH | 3.0 | 1.5 | 1344 | $1,695 | $1.26 | 44d | 1 | 1.36mi |
| 19601 Van Aken Blvd Shaker Heights, OH | 1.0–4.0 | 1.0–4.0 | 1977 | $4,400 | $2.23 | 22d | 1 | 1.39mi |
| 4309 E 142nd St Cleveland, OH | 4.0 | 2.0 | 1311 | $1,943 | $1.48 | 2d | 1 | 1.44mi |
Listing history 39 events
-
2026-06-18days on market $169,999 Active 140 DOM
-
2026-06-17days on market $169,999 Active 139 DOM
-
2026-06-16days on market $169,999 Active 138 DOM
-
2026-06-15days on market $169,999 Active 137 DOM
-
2026-06-13days on market $169,999 Active 135 DOM
-
2026-06-13days on market $169,999 Active 134 DOM
-
2026-06-09days on market $169,999 Active 131 DOM
-
2026-06-08days on market $169,999 Active 130 DOM
-
2026-06-07days on market $169,999 Active 129 DOM
-
2026-06-03days on market $169,999 Active 125 DOM
-
2026-06-02days on market $169,999 Active 124 DOM
-
2026-06-01days on market $169,999 Active 123 DOM
-
2026-05-31days on market $169,999 Active 122 DOM
-
2026-04-06price $169,999 302-char remark
Show marketing remark (302 chars)
Collect almost $3,000/mo with this Shaker duplex. Email agent for market rent roll & video tour along with complete investment analysis, drone footage, information on the mechanical systems of the building. Professional property management availalbe. Local & out of state investors welcome!
-
2026-03-24price $179,999 302-char remark
Show marketing remark (302 chars)
Collect almost $3,000/mo with this Shaker duplex. Email agent for market rent roll & video tour along with complete investment analysis, drone footage, information on the mechanical systems of the building. Professional property management availalbe. Local & out of state investors welcome!
-
2026-03-07price $194,999 302-char remark
Show marketing remark (302 chars)
Collect almost $3,000/mo with this Shaker duplex. Email agent for market rent roll & video tour along with complete investment analysis, drone footage, information on the mechanical systems of the building. Professional property management availalbe. Local & out of state investors welcome!
-
2026-02-11price $199,999 302-char remark
Show marketing remark (302 chars)
Collect almost $3,000/mo with this Shaker duplex. Email agent for market rent roll & video tour along with complete investment analysis, drone footage, information on the mechanical systems of the building. Professional property management availalbe. Local & out of state investors welcome!
-
2026-01-29status Active 302-char remark
Show marketing remark (302 chars)
Collect almost $3,000/mo with this Shaker duplex. Email agent for market rent roll & video tour along with complete investment analysis, drone footage, information on the mechanical systems of the building. Professional property management availalbe. Local & out of state investors welcome!
-
2025-12-04$209,999 Active 302-char remark
Show marketing remark (302 chars)
Collect almost $3,000/mo with this Shaker duplex. Email agent for market rent roll & video tour along with complete investment analysis, drone footage, information on the mechanical systems of the building. Professional property management availalbe. Local & out of state investors welcome!
-
2014-03-17soldstatus $56,000 29-char remark
Show marketing remark (29 chars)
Both units have a Bonus Room.
-
2014-03-16historical 29-char remark
Show marketing remark (29 chars)
Both units have a Bonus Room.
-
2014-03-14soldstatus $56,000
-
2012-12-29$60,000 29-char remark
Show marketing remark (29 chars)
Both units have a Bonus Room.
-
2012-10-19historical
-
2012-04-19$72,000
-
2011-10-07historical
-
2011-04-07$72,000
-
2011-02-17historical
-
2010-08-17$70,000
-
2010-05-09historical
-
2009-11-09$119,900
-
2009-09-29historical
-
2009-06-29$124,900
-
2008-06-13soldstatus $31,900
-
2008-06-03historical
-
2008-03-03$41,900
-
2006-10-11soldstatus $221,000
-
2005-02-07soldstatus $165,000
-
1984-09-28soldstatus $61,500
ⓘ Source: listings_history table (triggers on properties + properties_extension) + one-shot
backfill from property_details.listing_events for pre-trigger history.
Tax reassessment forecast OH · Partial reset (capped growth)
- Current annual tax
- $5,241 · $437/mo
- Projected year-2 tax
- $5,241 · $437/mo
- Expected delta
- $0/yr ($0/mo · 0.0%)
ⓘ Screening estimate from a state-policy table — verify with the county assessor before closing.
Climate risk First Street
- Flood 1/10 Low FEMA zone X (unshaded) · 0% chance over 30 yrs
- Wildfire 1/10 Low
- Heat 2/10 Low 7 d/yr ≥95°F today · 17 d/yr by 30 yrs out
- Wind 1/10 Low
- Air quality 3/10 Moderate 3 unhealthy d/yr today · 5 by 30 yrs out
Nearby sold comps map
Loading sold comps map…
Walkable amenities ~0.75 mi
Loading nearby amenities…
Taxation est. · year 1
- Rental income
- $35,100
- − Mortgage interest
- −$9,523
- − Property taxes
- −$5,241
- − Insurance
- −$850
- − Repairs & maintenance
- −$2,808
- − Management
- −$2,808
- − Depreciation
- −$4,945
- Taxable income
- $8,925
- Est. tax owed @ 24.0%
- −$2,142
- After-tax cash flow
- $8,798/yr
For passive investors: Depreciation is non-cash, so a rental often shows a tax loss while cash-flowing — sheltering income. Rental losses are passive: they offset passive income freely, and up to $25,000/yr can offset ordinary (W-2) income if you actively participate and your MAGI is under $100k (phasing out to $0 by $150k); unused losses carry forward. On sale, claimed depreciation is recaptured at up to 25%, and gains may owe capital-gains tax (a 1031 exchange can defer both). Figures are a year-1 estimate at your 24.0% rate — not tax advice; consult a CPA.
Schools (NCES district)
- District
- Shaker Heights City
- NCES district ID
- 3904475
- Math proficiency
- 50% ▼ -16.00%
- Reading proficiency
- 63% ▼ -6.00%
- Median HH income
- $69,421
- Composite
- 49.98/100
- National rank
- #1928
- State rank
- #309 of 656 in OH
Livability — Shaker Heights
- Score
- 89/100
- State rank
- #15
- US rank
- #134
Category grades
Schools grade is shown separately in the Schools card above.
Census & demographics
- Census place
- Shaker Heights, OH
- County
- Cuyahoga County · 1,090,369 people
- City population
- 69,880
- Metro
- Cleveland-Elyria, OH
- Population (ZIP)
- 33,202
- Household income
- $47,126
- Rent vs Own
- Severe rent burden
- 2289.0
Population outlook (Cuyahoga County) Hauer SSP2
- Today (2025)
- 1,244,621 people
- By 2030
- 1,230,093 · -1.2%
- By 2040
- 1,189,108 · -4.5%
- By 2050
- 1,145,706 · -7.9%
- By 2075
- 1,076,557 · -13.5%
- By 2100
- 978,987 · -21.3%
Race, ethnicity, and origin ACS 2023
- Neighborhood character
- Predominantly Black (68%)
- Race & ethnicity
- Black 68% White 21% Two or more races 6% Hispanic / Latino 3% Asian 2%
- Common ancestry
- Romanian 2% Italian 1% Slovak 1%
- Foreign-born
- 5% · China, Canada
- Languages at home
- 93% English-only · Spanish 2% Chinese 1% Other Indo-European 1%
Political lean MEDSL · Cuyahoga
- 2024 margin
- Solid D (+31.5) · D 65.4% · R 33.9%
- 2008→2024 swing
- -7.4pp toward R · 2008: 38.9pp · 2024: 31.5pp
- All cycles
- 2024: D+31.5 2020: D+34.1 2016: D+35.0 2012: D+38.7 2008: D+38.9
Not yet ingested
- Civics
- —
Market trends
- HPI YoY
- ▼ -201.50%
- Current HPI
- 108.2487
- Rent YoY
- ▲ 3.34%
- Metro
- Cleveland-Elyria, OH
- State GDP YoY
- ▲ 1.98%
- F500 in state
- 48
Industry mix (Fortune 500 HQ in OH)
| Industry | F500 HQs | Revenue |
|---|---|---|
| Insurance | 3 | $145B |
|
||
| Industrial Machinery | 3 | $49B |
|
||
| Financial Services | 3 | $24B |
|
||
| Consumer Goods | 2 | $93B |
|
||
| Aerospace / Defense | 2 | $47B |
|
||
| Utilities | 2 | $33B |
|
||
Price history
+176.4% since first listed26 events — show timeline
- 2026-04-06 Price Changed $169,999 MLSNOW
- 2026-03-24 Price Changed $179,999 MLSNOW
- 2026-03-07 Price Changed $194,999 MLSNOW
- 2026-02-11 Price Changed $199,999 MLSNOW
- 2026-01-29 Relisted — MLSNOW
- 2025-12-04 Listed $209,999 MLSNOW
- 2014-03-17 Sold (MLS) $56,000 MLSNOW
- 2014-03-16 Listing Removed — MLSNOW
- 2014-03-14 Sold (Public Records) $56,000 Public Records
- 2012-12-29 Listed $60,000 MLSNOW
- 2012-10-19 Listing Removed — MLSNOW
- 2012-04-19 Listed $72,000 MLSNOW
- 2011-10-07 Listing Removed — MLSNOW
- 2011-04-07 Listed $72,000 MLSNOW
- 2011-02-17 Listing Removed — MLSNOW
- 2010-08-17 Listed $70,000 MLSNOW
- 2010-05-09 Listing Removed — MLSNOW
- 2009-11-09 Listed $119,900 MLSNOW
- 2009-09-29 Listing Removed — MLSNOW
- 2009-06-29 Listed $124,900 MLSNOW
- 2008-06-13 Sold (MLS) $31,900 MLSNOW
- 2008-06-03 Listing Removed — MLSNOW
- 2008-03-03 Listed $41,900 MLSNOW
- 2006-10-11 Sold (Public Records) $221,000 Public Records
- 2005-02-07 Sold (Public Records) $165,000 Public Records
- 1984-09-28 Sold (Public Records) $61,500 Public Records
Property tax history
+2.2%/yrLatest (2025): $5,241 · +1.6% YoY. Source: county tax records.
Cash-flow waterfall
monthlySold comps — $/sqft
last 12 mo · ≤1 miLoading sold comps…